Introduction
Zirconolite, ideally CaZrTi2O7, was first described by Borodin et al. (Reference Borodin, Nazarenko and Rikhter1956), see also Bulakh et al. (Reference Bulakh, Nesterov and Williams2006), from the calcite–amphibole–clinopyroxene rock occurring in central part of the Afrikanda alkali-ultramafic complex, Kola Alkaline Province (Kukharenko et al., Reference Kukharenko, Orlova, Bulakh, Bagdasarov, Rimskaya-Korsakova, Nefedov, Ilingsky, Sergeev and Abakumova1965; Chakhmouradian and Zaitsev, Reference Chakhmouradian and Zaitsev1999, Reference Chakhmouradian and Zaitsev2002, Reference Chakhmouradian, Zaitsev, Wall and Zaitsev2004; Zaitsev and Chakhmouradian, Reference Zaitsev and Chakhmouradian2002). Subsequently, at Kola, the mineral was found in phoscorites and carbonatites from Kovdor, Vuoriyarvi, Seblyavr and TuriyMys (Chakhmouradian and Williams, Reference Chakhmouradian, Williams, Wall and Zaitsev2004, and references herein). Zirconolite occurrences, however, are not restricted to phoscorite/carbonatite complexes only. The mineral is known from a wide range of silicate rocks, and even skarns (e.g. Williams and Gieré, Reference Williams and Gieré1996, and references herein, Pascal et al., Reference Pascal, Di Muro, Fonteilles and Principe2009, Zubkova et al., Reference Zubkova, Chukanov, Pekov, Ternes, Schüller, Ksenofontov and Pushcharovsky2018).
Compositionally, zirconolite is characterised by complex element substitution, and may contain significant amounts of Nb, Fe, rare earth elements (REE), U and Th (e.g. Williams and Gieré, Reference Williams and Gieré1996; Gieré et al., Reference Gieré, Williams and Lumpkin1998; Bellatreccia et al., Reference Bellatreccia, Della Ventura, Caprilli, Williams and Parodi1999, Reference Bellatreccia, Della Ventura, Williams, Lumpkin, Smith and Colella2002; Della Ventura et al., Reference Della Ventura, Della Bellatreccia and Williams2000; Pascal et al., Reference Pascal, Di Muro, Fonteilles and Principe2009; Sharygin et al., Reference Sharygin, Doroshkevich and Khromova2016). The presence of U and Th in zirconolite, especially in geologically old rocks, leads to damage of the crystal structure and metamictisation. Young zirconolite, exhibits crystalline characteristics, even in Th and U-rich varieties, making it suitable for single-crystal X-ray analysis (Zubkova et al., Reference Zubkova, Chukanov, Pekov, Ternes, Schüller, Ksenofontov and Pushcharovsky2018). In addition to the importance of zirconolite as a host for high-field-strength and rare earth elements (Chakhmouradian and Williams, Reference Chakhmouradian, Williams, Wall and Zaitsev2004) and as a mineral-geochronometer (Wu et al., Reference Wu, Yang, Mitchell, Bellatreccia, Li and Zhao2010), synthetic zirconolite has been considered as a major component for ‘SYNROC’ materials (e.g. Lutze and Ewing, Reference Lutze and Ewing1988).
Zirconolite, both natural and synthetic, fulfils the various requirements for a titanate ceramic matrix for high-level waste (HLW), such as the ability to include a wide range of elements, radiation tolerance, and mechanical durability (Kessoft et al., Reference Kessoft, Sinclair and Ringwood1983; Zhang et al., Reference Zhang, Wang, Wang, Huang, Luo, Liang and Tan2018; Yudintsev et al., Reference Yudintsev, Nickolsky, Ojovan, Stefanovsky, Nikonov and Ulanova2022). This makes it an essential component for such applications (Kessoft et al., Reference Kessoft, Sinclair and Ringwood1983; Zhang et al., Reference Zhang, Wang, Wang, Huang, Luo, Liang and Tan2018). The structure of the zirconolite framework is typically characterised as being split into layers consisting of two distinct topologies. Depending on the composition and formation conditions, zirconolite may form the following polytypes: 2M, 3O, 3T and 4M (Cheary and Coelho, Reference Cheary and Coelho1997; Coelho et al., Reference Coelho, Cheary and Smith1997; Vance et al., Reference Vance, Lumpkin, Carter, Cassidy, Ball, Day and Begg2002; Gilbert et al., Reference Gilbert, Selfslag, Walter, Stennett, Somers, Hyatt and Livens2010; Whittle et al., Reference Whittle, Hyatt, Smith, Margiolaki, Berry, Knight and Lumpkin2012). Although numerous studies have been conducted to examine the role of cation doping on polytype crystallisation (Coelho et al., Reference Coelho, Cheary and Smith1997; Vance et al., Reference Vance, Lumpkin, Carter, Cassidy, Ball, Day and Begg2002; Gilbert et al., Reference Gilbert, Selfslag, Walter, Stennett, Somers, Hyatt and Livens2010; Ji et al., Reference Ji, Liao, Chen, Zhang, Shih, Chang, Sheu, Yan, Li and Wang2021), the effect of polytype performance on HLW immobilisation has not been thoroughly investigated. Various polytypes of crystalline zirconolite mineral samples have been investigated, including 2M (Chukanov et al., Reference Chukanov, Krivovichev, Pakhomova, Pekov, Schäfer, Vigasina and Van2014), 3O (Zubkova et al., Reference Zubkova, Chukanov, Pekov, Ternes, Schüller, Ksenofontov and Pushcharovsky2018; Chukanov et al., Reference Chukanov, Zubkova, Pekov, Vigasina, Polekhovsky, Ternes, Schüller, Britvin and Pushcharovsky2019), and 3T (Zubkova et al., Reference Zubkova, Chukanov, Pekov, Ternes, Schüller, Ksenofontov and Pushcharovsky2018). The intricate compositions of natural minerals and the insights gained from polytype crystallisation provide valuable insights into predicting the preferred polytype that might form from metamict zirconolite in SYNROC in response to temperature rise.
Herein we present a thorough investigation of geologically old, ca. 370 Ma, metamict zirconolite from the Kovdor phoscorites and carbonatites (Kola Alkaline Province), encompassing thermal annealing experiments, crystallisation behaviour, and thermal expansion of the (re)crystallised sample.
Zirconolite at Kovdor
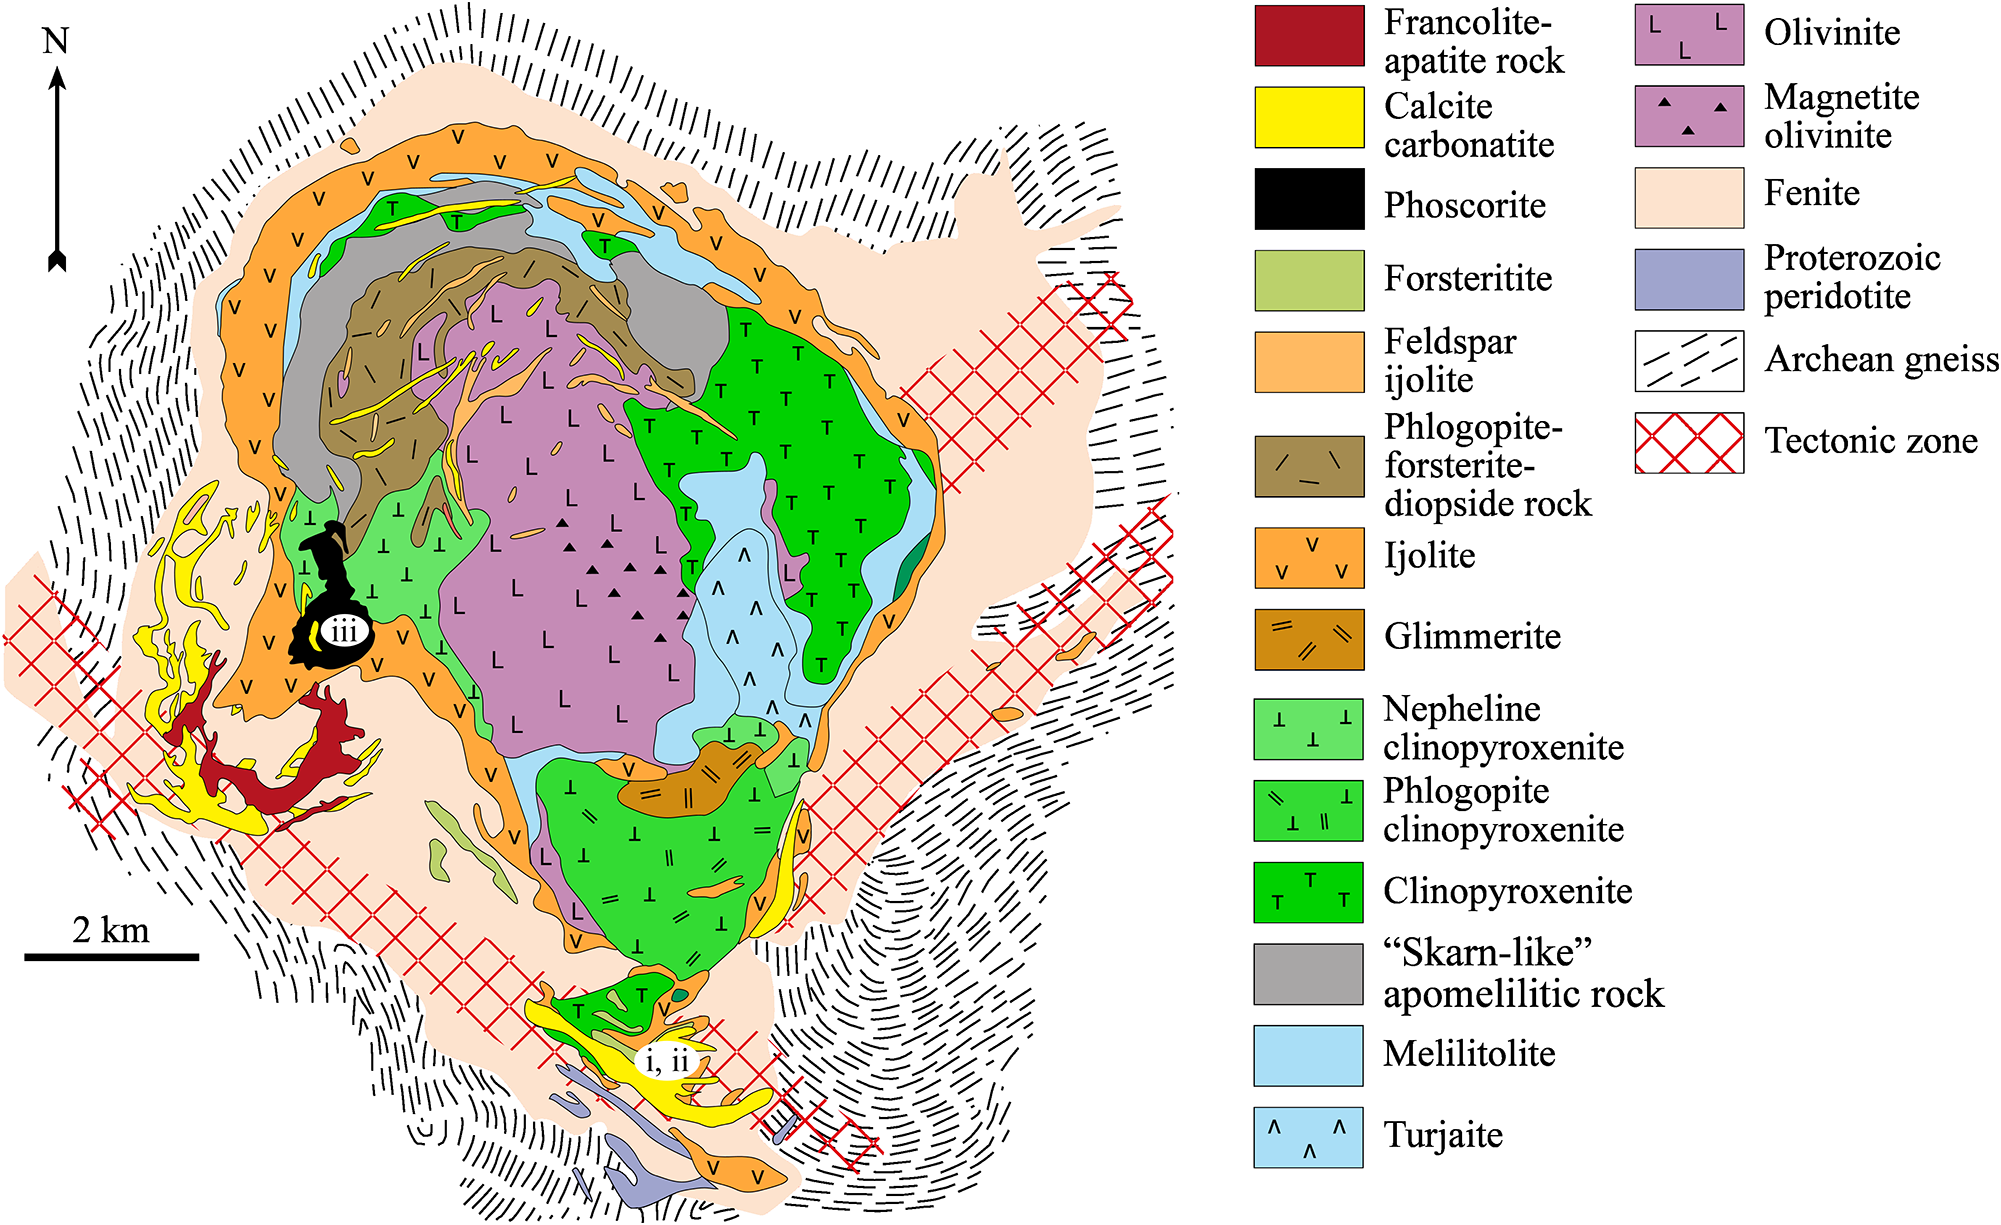
The Kovdor complex (∼42 km2) belongs to the Devonian Kola Alkaline Province (Fig. 1; Kukharenko et al., Reference Kukharenko, Orlova, Bulakh, Bagdasarov, Rimskaya-Korsakova, Nefedov, Ilingsky, Sergeev and Abakumova1965; Amelin and Zaitsev, Reference Amelin and Zaitsev2002; Krasnova et al., Reference Krasnova, Balaganskaya, Garcia, Wall and Zaitsev2004; Downes et al., Reference Downes, Balaganskaya, Beard, Liferovich and Demaiffe2005; Zaitsev et al., Reference Zaitsev, Terry Williams, Jeffries, Strekopytov, Moutte, Ivashchenkova, Spratt, Petrov, Wall, Seltmann and Borozdin2015; Ivanyuk et al., Reference Ivanyuk, Kalashnikov, Pakhomovsky, Mikhailova, Yakovenchuk, Konopleva, Sokharev, Bazai and Goryainov2016). Phoscorite and carbonatites form a vertical body, ∼1 km×1.5 km in size, in the southwestern part of the Kovdor intrusion. Field relations, modal mineralogy and whole-rock compositions suggest that phoscorites are represented by at least ten varieties, with highly variable content of forsterite, apatite, magnetite, phlogopite, tetraferriphlogopite, calcite and dolomite. Carbonatite types are calcite, calcite–dolomite and dolomite. Calcite carbonatites, differ in minor and accessory minerals, and two varieties are distinguished; calcite carbonatite with phlogopite and calcite carbonatite with tetraferriphlogopite.
Both phoscorite and carbonatites contain diverse Zr and Nb minerals; these include baddeleyite, pyrochlore-group minerals, zirconolite and rare calzirtite, lueshite and isolueshite (Rimskaya-Korsakova, Reference Rimskaya-Korsakova, Burova and Frank-Kamenetskiy1963; Kukharenko et al., Reference Kukharenko, Orlova, Bulakh, Bagdasarov, Rimskaya-Korsakova, Nefedov, Ilingsky, Sergeev and Abakumova1965; Kirillov and Burova, Reference Kirillov and Burova1967; Kapustin, Reference Kapustin1980; Strelnikova and Polezhaeva, Reference Strelnikova and Polezhaeva1981; Williams, Reference Williams1996; Subbotin and Subbotina, Reference Subbotin and Subbotina2000; Ivanyuk et al., Reference Ivanyuk, Yakovenchuk and Pakhomovsky2002; Chakhmouradian and Williams, Reference Chakhmouradian, Williams, Wall and Zaitsev2004; Zaitsev et al., Reference Zaitsev, Terry Williams, Jeffries, Strekopytov, Moutte, Ivashchenkova, Spratt, Petrov, Wall, Seltmann and Borozdin2015, Reference Zaitsev, Zhitova, Spratt John Zolotarev and Krivovichev2017). Zirconolite, originally described as zirkelite by Kukharenko et al. (Reference Kukharenko, Orlova, Bulakh, Bagdasarov, Rimskaya-Korsakova, Nefedov, Ilingsky, Sergeev and Abakumova1965), occurs in several varieties of phoscorites and carbonatites: (i) calcite–forsterite–magnetite phoscorite with phlogopite; (ii) calcite carbonatite with forsterite and phlogopite; (iii) calcite-forsterite-magnetite phoscorite with tetraferriphlogopite; and (iv) calcite carbonatite with tetraferriphlogopite (Williams, Reference Williams1996; Zaitsev et al., Reference Zaitsev, Terry Williams, Jeffries, Strekopytov, Moutte, Ivashchenkova, Spratt, Petrov, Wall, Seltmann and Borozdin2015). The mineral is extremely rare in phoscorites and carbonatites containing phlogopite, though relatively abundant in phoscorites and carbonatites with tetraferriphlogopite.
Three compositional varieties of zirconolite were recognised by Zaitsev et al. (Reference Zaitsev, Terry Williams, Jeffries, Strekopytov, Moutte, Ivashchenkova, Spratt, Petrov, Wall, Seltmann and Borozdin2015) as follows: (i) REE- and Nb-rich zirconolite (9.5–17.8 wt.% REE2O3 and 18.4–22.8 wt.% Nb2O5) in calcite–forsterite–magnetite phoscorite with phlogopite; (ii) REE- and Nb-poor zirconolite (<0.05 wt.% REE2O3 and 3.7 wt.% Nb2O5) in calcite carbonatite with forsterite and phlogopite, and (iii) REE-enriched and Nb-rich zirconolite (2.5–6.3 wt. REE2O3 and 15.8–22.2 wt.% Nb2O5) in phoscorite and carbonatite containing tetraferriphlogopite. REE-rich zirconolite probably contains significant amounts of the nöggerathite end-member, and Nb-rich zirconolite could be enriched in the stefanweissite end-member (Chukanov et al., Reference Chukanov, Zubkova, Britvin, Pekov, Vigasina, Schäfer, Ternes, Schüller, Polekhovsky, Ermolaeva and Pushcharovsky2018, Reference Chukanov, Zubkova, Pekov, Vigasina, Polekhovsky, Ternes, Schüller, Britvin and Pushcharovsky2019).
Zirconolite (as zirkelite, see e.g. Bayliss et al., Reference Bayliss, Mazzi, Munno and White1989), has also been described from carbonatites hosted by ijolites and fenites that occur in the southern part of the Kovdor complex (Osokin, Reference Osokin1979). Carbonatites are calcite and dolomite–calcite types. The former are divided in three distinct varieties with minor to major silicates: (i) aegirine–diopside±orthoclase and Ti-bearing andradite (‘melanite’); (ii) phlogopite±diopside; and (iii) forsterite. Zirconolite in calcite carbonatites occurs as tabular (platy) crystals with triangular, cubic or cuboctahedron habits. Compositionally, zirconolite from the southern calcite carbonatites is similar to that hosted within tetraferriphlogopite-bearing phoscorites and carbonatites (2.5–5.2 wt.% REE2O3 and 14.0–33.4 wt.% Nb2O5); however, both cubic and cuboctahedron zirconolite contain a significant amount of Na (1.6–2.4 wt.% Na2O) (Osokin, Reference Osokin1979). However as the bulk samples were analysed by wet chemical methods, the presence of Na and high Nb content suggests there are a significant amount of other mineral(s) in the zirconolite samples.
Samples and methods
In this investigation we have used material from collections of heavy mineral fractions (collected by O.M. Rimskaya-Korsakova, N.I. Krasnova and A.N. Zaitsev) from the southern carbonatites and phoscorites–carbonatites from the southwestern part of Kovdor (Fig. 1). The samples are: (i) euhedral tabular crystals (southern carbonatites); (ii) euhedral cubic crystals (southern carbonatites); and (iii) euhedral to subhedral prismatic crystals, fragments of broken crystals and anhedral crystals (southwestern phoscorite–carbonatites with tetraferriphlogopite).
Geological map of the Kovdor ultrabasic-alkaline rocks–phoscorite–carbonatite complex (Krasnova et al., Reference Krasnova, Balaganskaya, Garcia, Wall and Zaitsev2004, figure 4.1). i, ii and iii – locations of the zirconolite samples investigated. Published with permission from the Mineralogical Society of UK and Ireland.

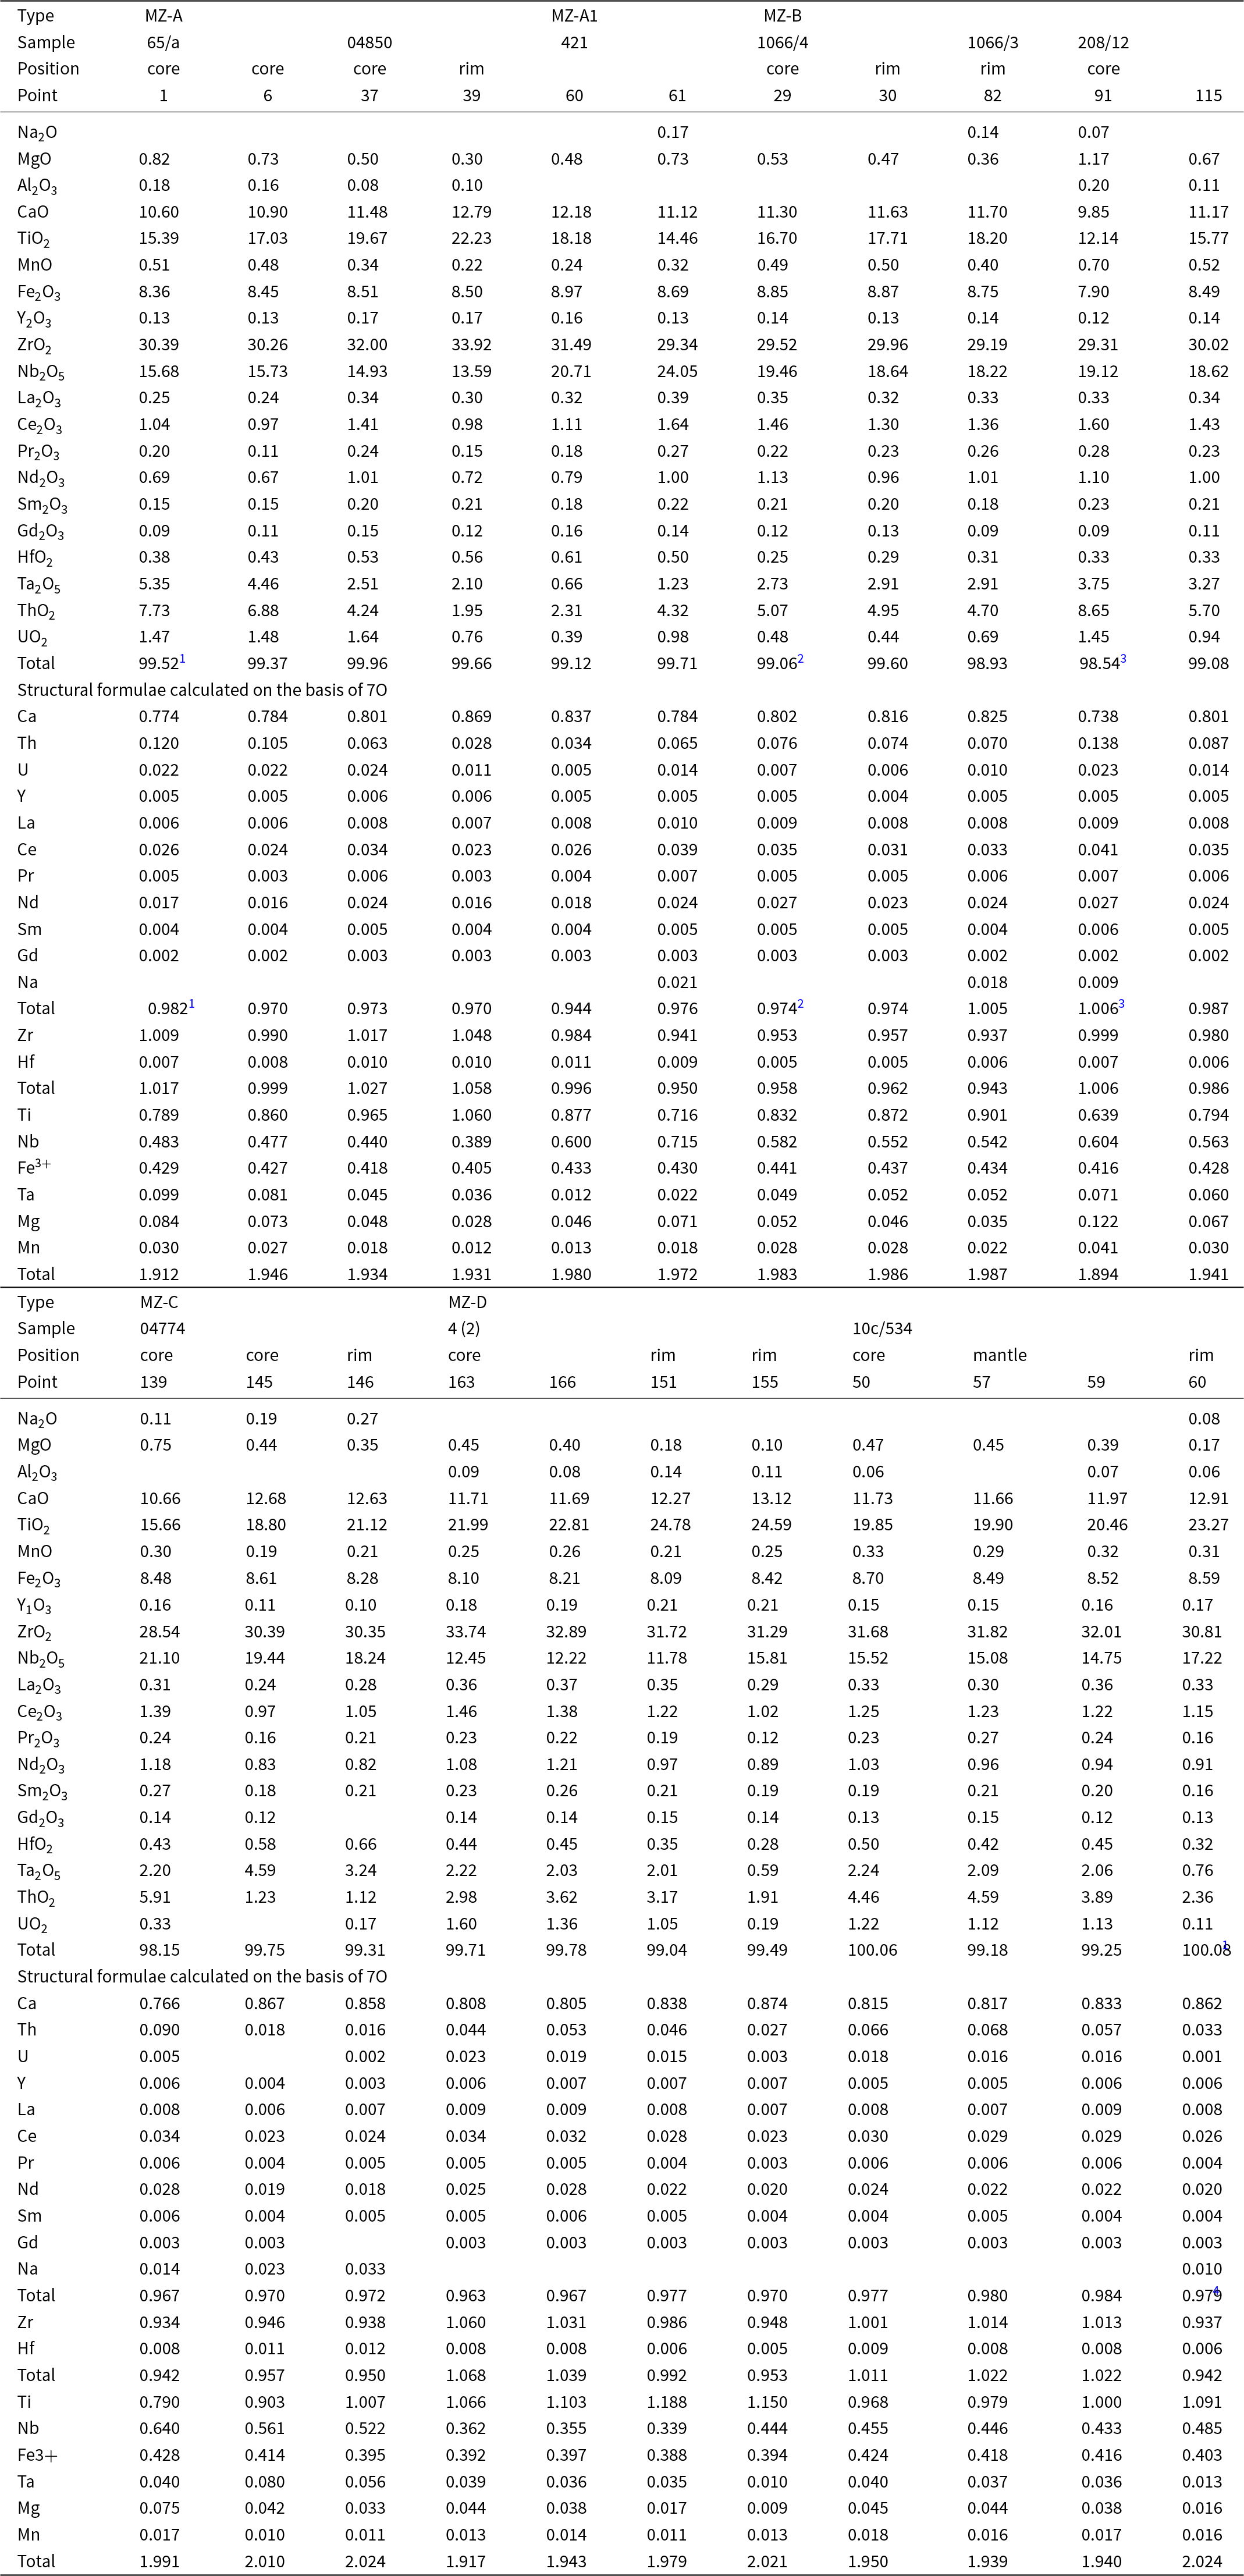
Metamict zirconolite crystals, mounted in blocks, were examined by scanning electron microscopy (SEM), using a JEOL 5900LV SEM, with an Oxford instruments Energy Dispersive X-ray Spectrometer (EDS) at the Natural History Museum (London). Zirconolite was analysed using a Cameca SX-100 electron microprobe, with wavelength dispersive X-ray spectrometers (WDS) (NHM, London, Tables 1 and 2). Analytical conditions of 20 kV accelerating voltage, 20 nA beam current and 1 μm beam diameter, were used for 138 spot analyses. Standards used were well-characterised natural minerals and synthetic compounds.
Representative compositions of metamict zirconolite

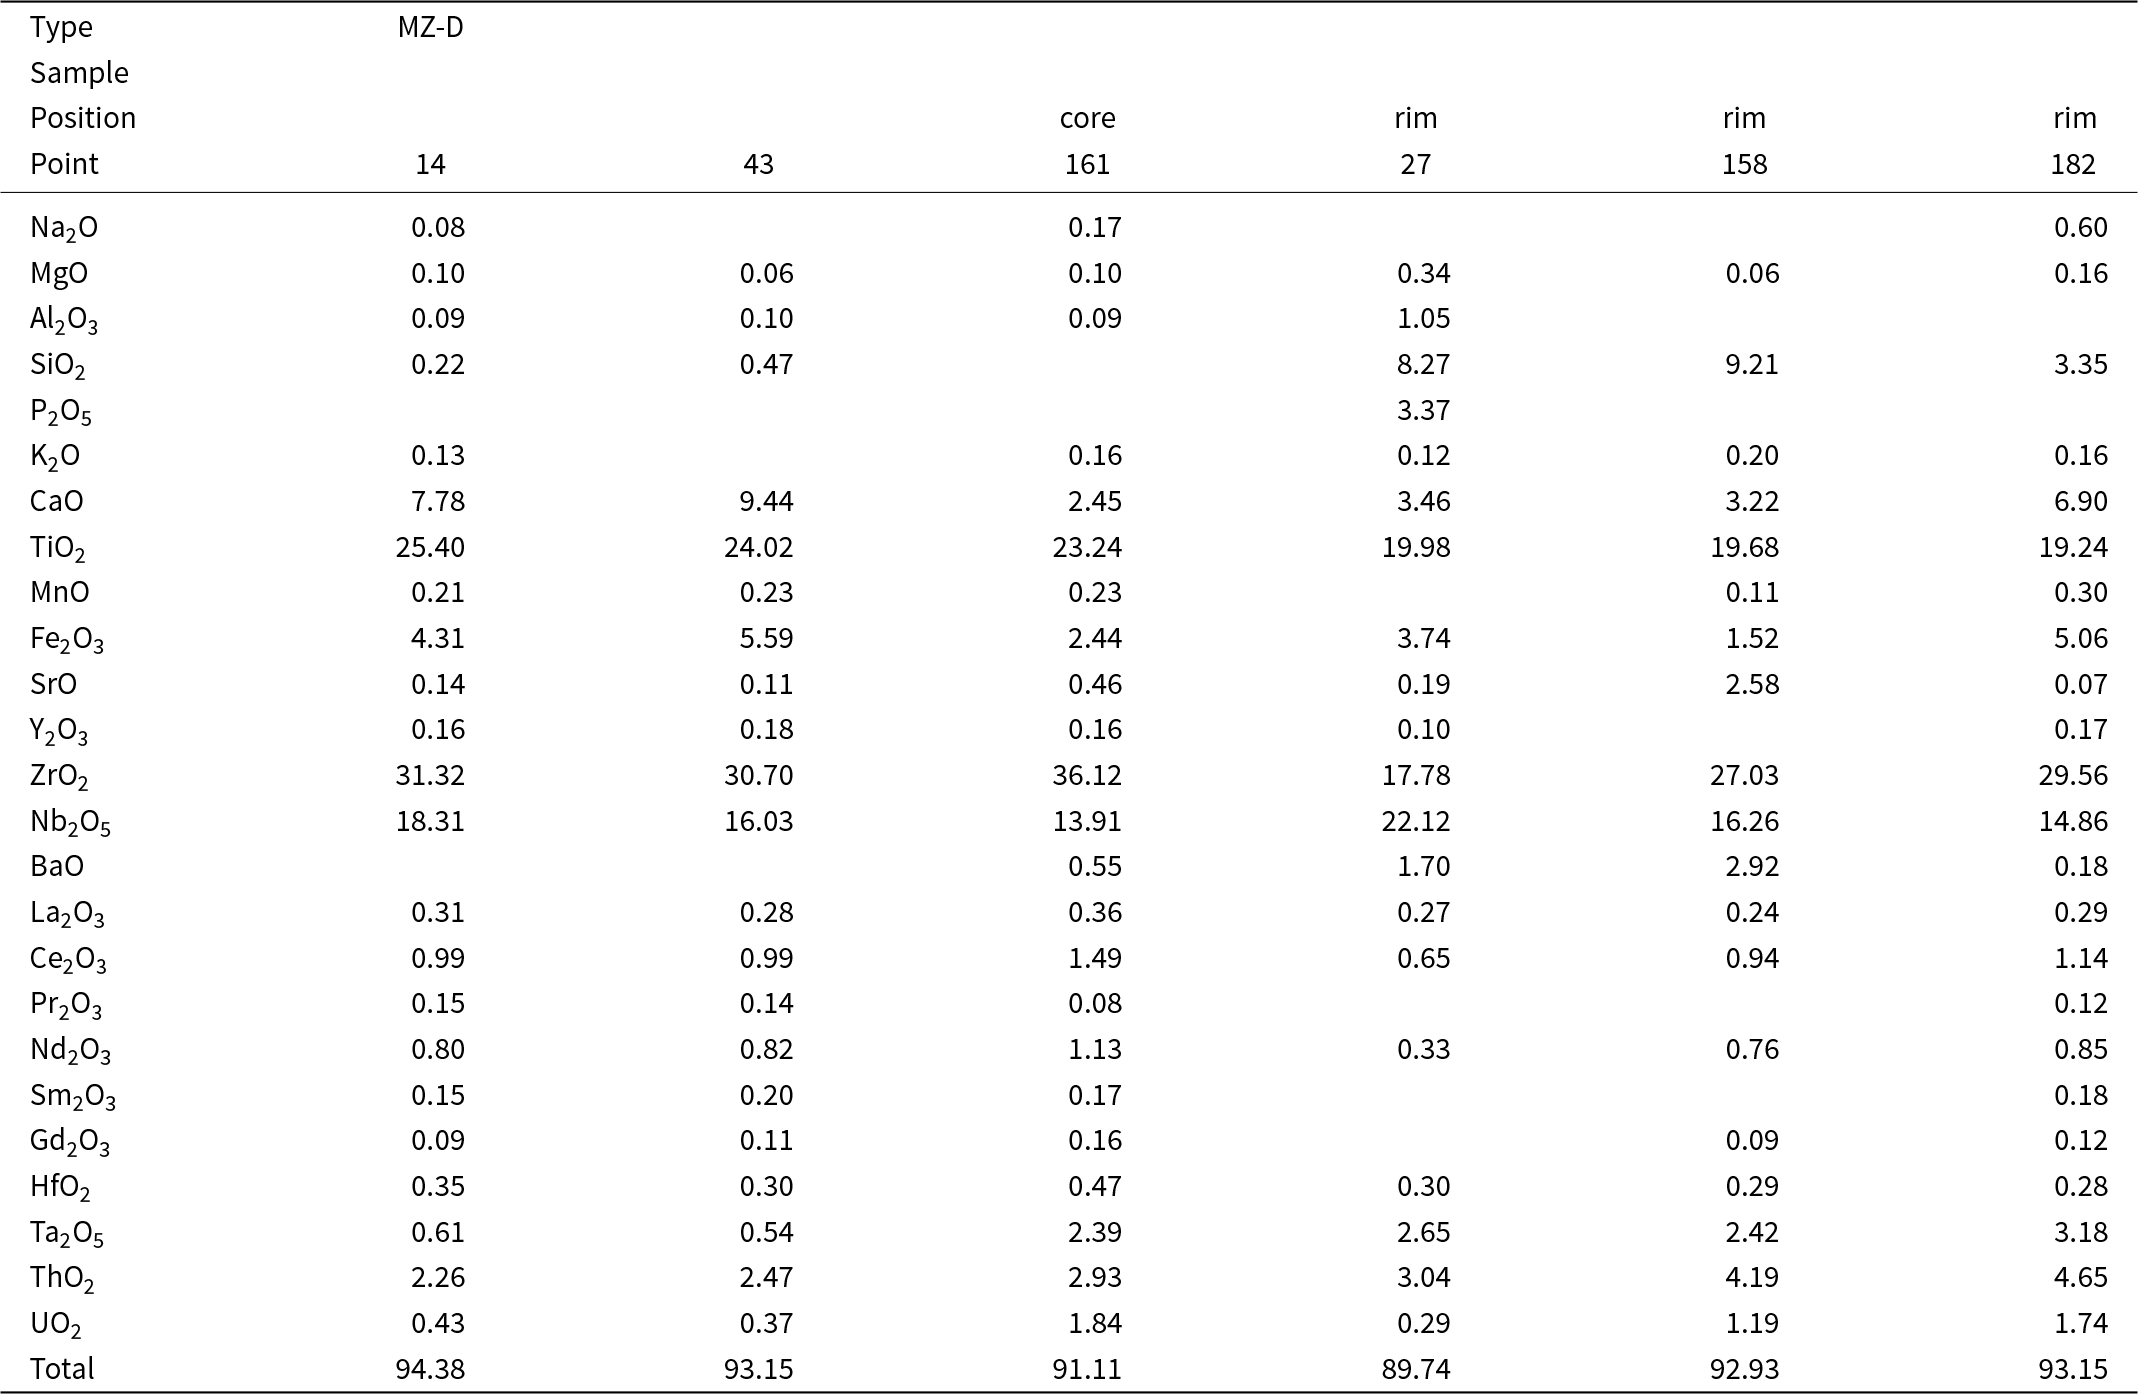
(1) Notes: Superscripts indicate sums including: 0.11 wt.% PbO (0.002 apfu); (2) 0.04 wt.% PbO (0.001 apfu); (3) 0.13 wt.% PbO (0.002 apfu); and (4) 0.10wt.% Dy2O3 (0.002 apfu). Si, K, P, Sr, Ba, Pb, Dy, Er, Yb, W, F and Cl – below detection limit. Blanks – content of the element is below detection limit.
All heated crystals were investigated using a Hitachi S-3400N (SEM), equipped with an Oxford Instruments X-Max 20 (EDS), (St. Petersburg State University, Table 3). Quantitative analyses were performed with an accelerating voltage of 20 kV and a beam current of 1.8 nA. Acquisition time was 30 s, with a resolution up to 4 nm. The following standards were used for the quantification: MAC (Micro Analysis Consultants Ltd., United Kingdom) and Geller reference standards (Geller microanalytical laboratory).
Raman spectra were acquired by the means of a Horiba Jobin-YvonLabRamHR800 Raman spectrometer (St. Petersburg State University), equipped with Olympus BX41 optical microscope with a resolution of 2 cm−1 and the 532 nm laser with a beam spot size of 5 μm. Data processing was performed using CrystalSleuth software.
The recrystallisation of zirconolite was investigated in air by high-temperature powder X-ray diffraction (HTPXRD) using a Rigaku Ultima IV diffractometer (CoKα radiation, 40 kV/30 mA, Bragg–Brentano geometry, PSD D-Tex Ultra, St. Petersburg State University) with a thermo-attachment in the range 30–1200°C with the step size of 30°C. A finely ground sample was deposited on a platinum sample holder (20 × 12 × 1.5 mm) from an ethanol suspension. Phase analysis was performed using PDF-2 database (ICDD, Reference ICDD2020), PDXL (Rigaku, 2016) and TOPAS V.5.0 (Bruker, 2011) software.
The thermal expansion of zirconolite was investigated using the same equipment and conditions. The visualisation and calculation of the thermal expansion was performed using the RTT program package (Bubnova et al., Reference Bubnova, Firsova, Volkov and Filatov2018).
All the zirconolite crystals investigated are metamict and in the text below we refer to them as MZ (metamict zirconolite), and recrystallised zirconolite obtained by heating of metamict samples as RZ (recrystallised zirconolite).
Internal zoning and composition of metamict zirconolite
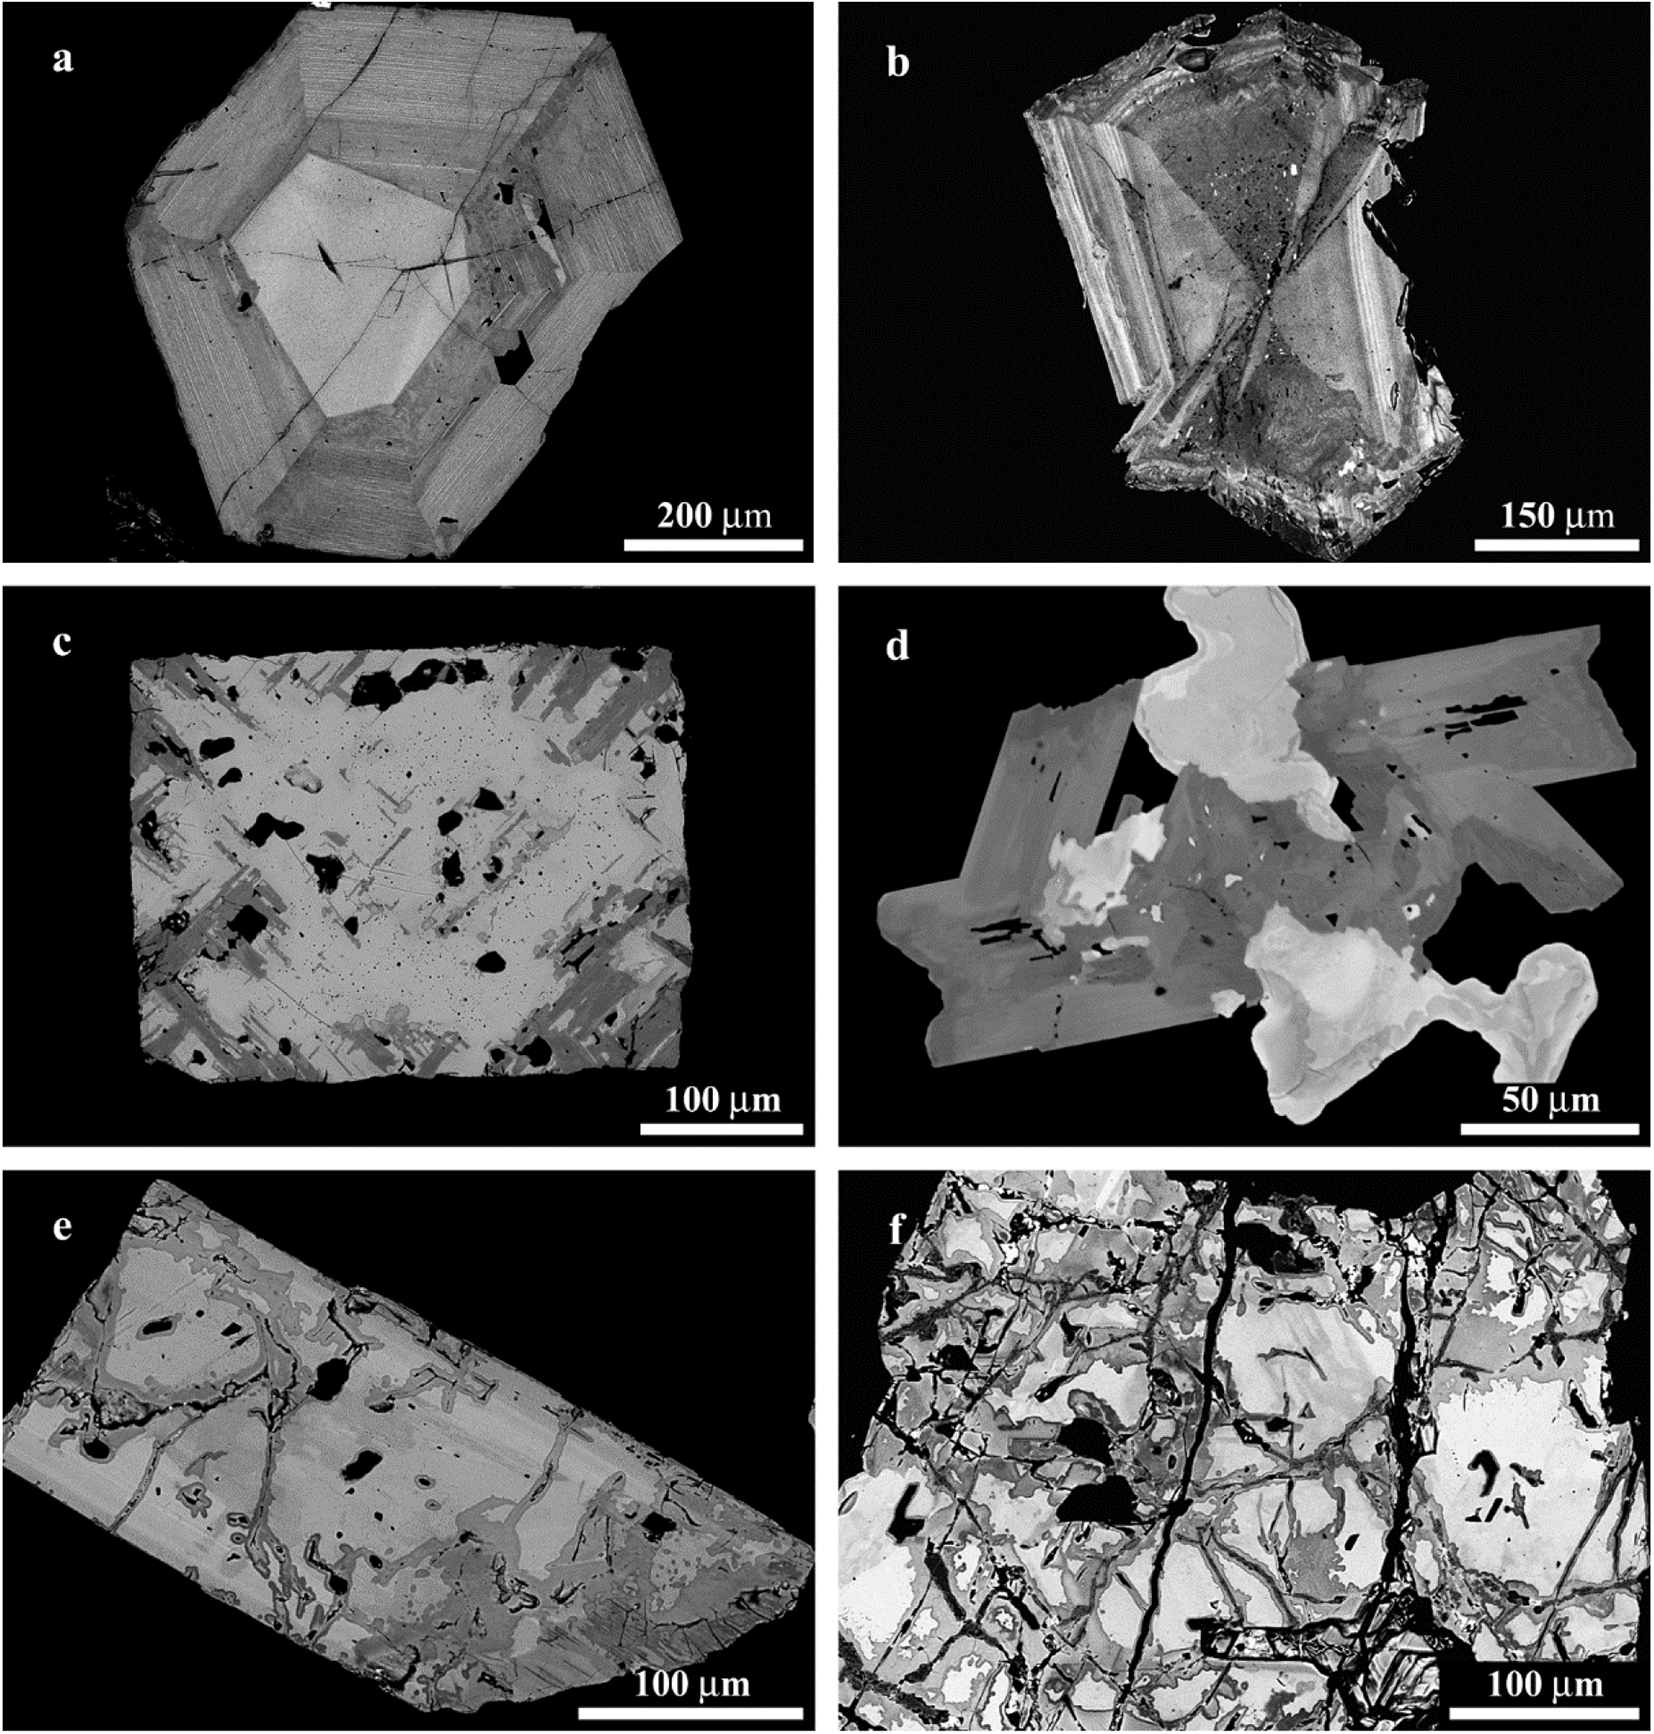
The zirconolite crystals investigated can be classified into four groups based on their morphology and internal zoning. The MZ-A group is represented by euhedral tabular (platy) crystals from the southern carbonatites. They are similar morphologically, to some of the zirkelite crystals from Seblyavr phoscorites and carbonatites described by Bulakh et al. (1998). Back-scattered electron images (BSE), show that all crystals are characterised by well-developed zoning with a brighter core and darker rim (Fig. 2a). Crystal rims always show a rhythmic-type zonation with concentric strips that are parallel to the crystal edges. One of the zirconolite crystals is characterised by well-developed sector- and rhythmic-type zoning (MZ-AA, Fig. 2b).
Morphology and internal texture of the zirconolite: (a) euhedral tabular crystal with rhythmic-type zoning (MZ-A group); (b) euhedral crystal with rhythmic- and sector-type zoning (MZ-AA group); (c) cubic crystal with pyrochlore (grey) and zirconolite (dark grey) (MZ-B group); (d) zirconolite (dark grey)-pyrochlore (light grey and white) intergrowth (MZ-C group); (e) euhedral crystal showing variable degree of mineral alteration (dark grey areas) (MZ-D group); and (f) internal texture of highly altered (grey and dark grey) subhedral crystal. Back-scattered electron images.

The second group, denoted as MZ-B, is represented by euhedral cubic zirconolite crystals also occurring in the southern carbonatites. The BSE images of all the crystals show that they consist of intergrowths of two minerals; pyrochlore and zirconolite (Fig. 2c). This can be explained by the structural relationship between zirconolite and pyrochlore (Coelho et al., Reference Coelho, Cheary and Smith1997; Grey et al., Reference Grey, Mumme, Ness, Roth and Smith2003). Observed intergrowths of zirconolite and pyrochlore explain the high sodium content of cubic zirconolite crystals analysed by Osokin (Reference Osokin1979). The presence of Na in zirconolite from Kovdor phoscorite (0.7 wt.% Na2O) was also reported by Kukharenko et al. (Reference Kukharenko, Orlova, Bulakh, Bagdasarov, Rimskaya-Korsakova, Nefedov, Ilingsky, Sergeev and Abakumova1965).
The third and fourth zirconolite groups MZ-C and MZ-D, respectively, are from phoscorites and carbonatites containing tetraferriphlogopite from the southwestern part of the complex. MZ-C is zirconolite occurring in association with pyrochlore and rarely baddeleyite (Fig. 2d; see also Figure 1a in Williams, Reference Williams1996, and Figure 8 in Zaitsev et al., Reference Zaitsev, Terry Williams, Jeffries, Strekopytov, Moutte, Ivashchenkova, Spratt, Petrov, Wall, Seltmann and Borozdin2015). This occurs as euhedral to subhedral prismatic crystals, and BSE images commonly show heterogeneous internal structures and composition. The compositional disparities are attributed to distinct zones of crystal growth (sector-type zoning, as depicted in Fig. 2d), and certain crystals exhibit late-stage mineral alteration.
MZ-D zirconolite occurs as euhedral to subhedral prismatic crystals and fragments of broken crystals. All crystals in this group exhibit microcracks and the BSE images suggest significant alteration in the mineral composition (Fig. 2e, f). Similar alteration textures have been previously observed for zirconolite from Afrikanda (Bulakh et al., Reference Bulakh, Nesterov and Williams2006).
Representative zirconolite compositions and calculated atoms per formula units (apfu) are presented in Table 1.
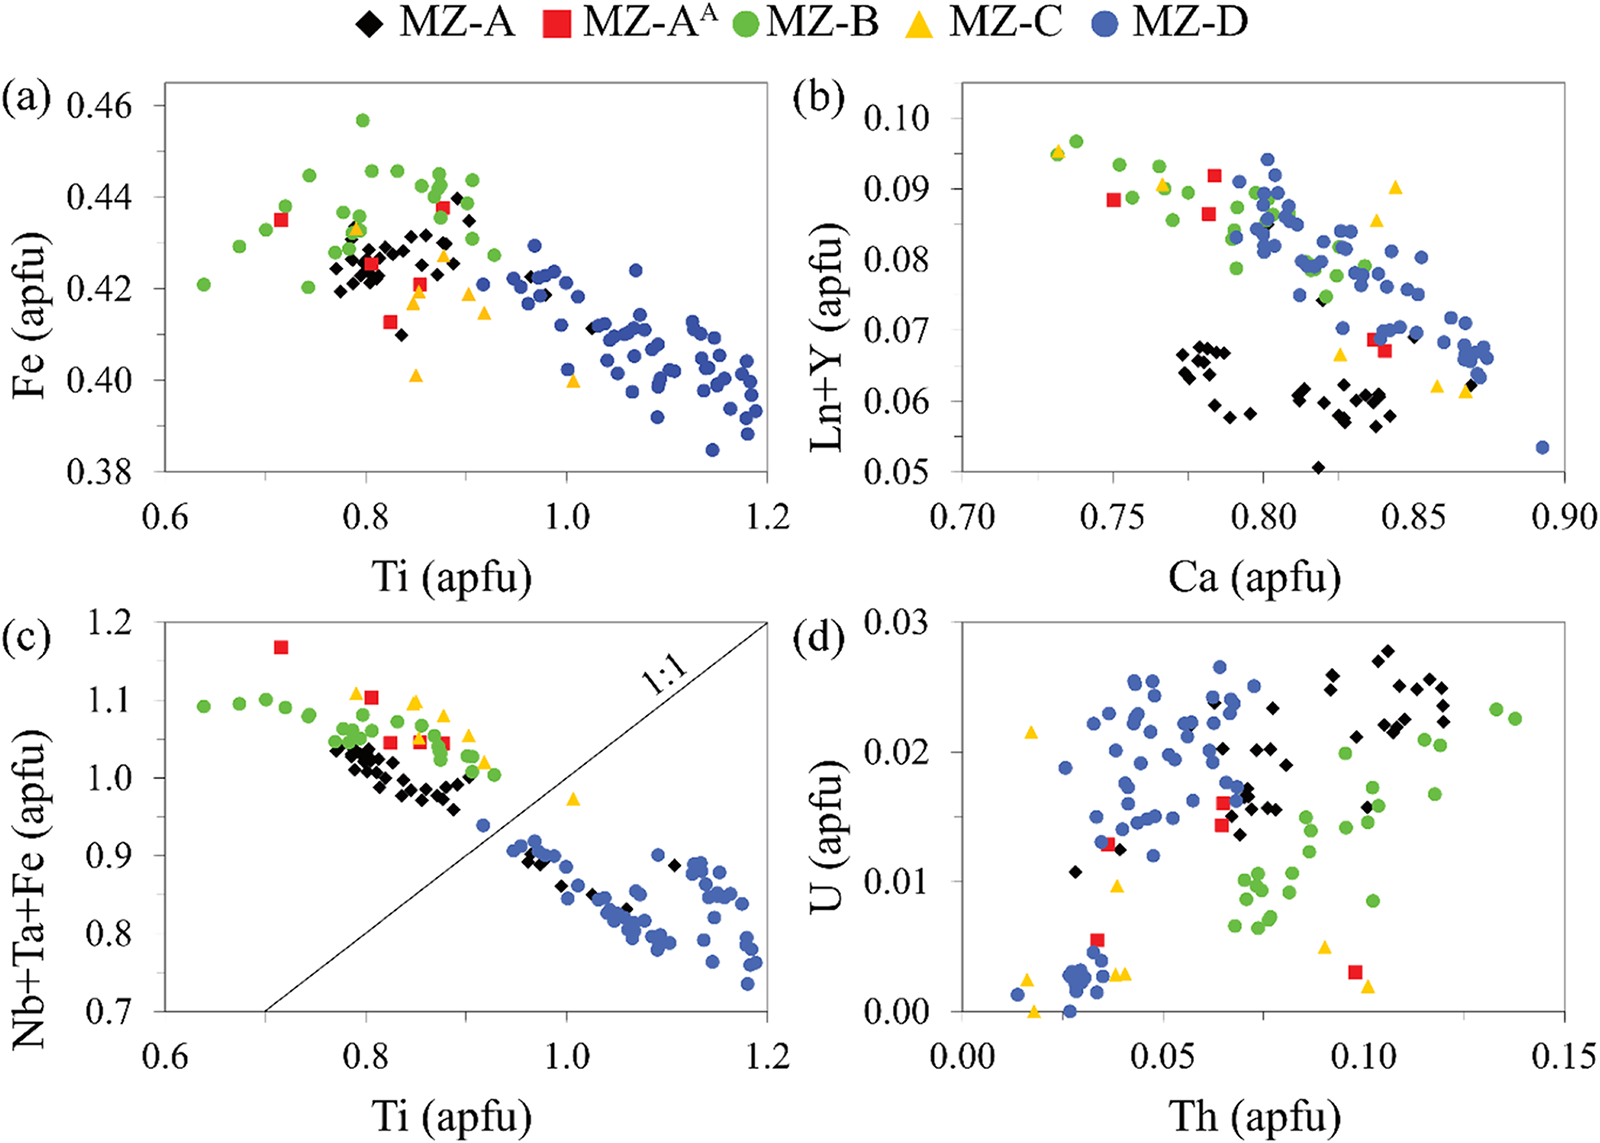
Limited published data for Kovdor zirconolite (wet chemistry method in Kukharenko et al., Reference Kukharenko, Orlova, Bulakh, Bagdasarov, Rimskaya-Korsakova, Nefedov, Ilingsky, Sergeev and Abakumova1965 and Osokin, Reference Osokin1979, and electron probe microanalysis in Williams, Reference Williams1996 and Zaitsev et al., Reference Zaitsev, Terry Williams, Jeffries, Strekopytov, Moutte, Ivashchenkova, Spratt, Petrov, Wall, Seltmann and Borozdin2015) show highly variable compositions. Our new data confirm the previously recognised zirconolite composition variability as the zirconolite investigated is strongly enriched in Nb (10.8–24.1 wt.% Nb2O5), contains essential amounts of Fe (7.9–9.0 wt.% Fe2O3), Th (1.0–8.7 wt.% ThO2), Ta (0.5–5.3 wt.% Ta2O5), REE (2.1–5.0 wt.% REE2O3) and minor U (0.1–1.9 wt.% UO2). As expected, Ti has a negative correlation with Nb+Ta and Fe (Fig. 3a, c), and Ca apfu correlates negatively with REE (Fig. 3b).
Compositional variations of zirconolite: (a) Ti vs Fe; (b) Ca vs Ln+Y; (c) Ti vs Nb+Ta+Fe; and (d) Th vs U (apfu – atoms per formula unit).

The significant enrichment of carbonatitic zirconolite in Nb and Fe has been discussed by Sharygin et al., (Reference Sharygin, Doroshkevich and Khromova2016) in their study of Fe–Nb-rich zirconolite from Belaya Zima calcite carbonatites. They suggested that such a mineral variety is typical for intrusive carbonatites, and a new mineral, within the zirconolite group, with the ideal formula CaZr(TiNb0.5Fe3+0.5)O7 (that can also be written as Ca2Zr2(Ti2Nb)FeO14) could be established. In fact, in the zirconolite Ti investigated is the dominant component in only 61 of 128 spot analyses (Fig. 3c).
The composition of zirconolite from the localities investigated at Kovdor (southern carbonatites and southwestern phoscorites + carbonatites) and groups (MZ-A, AA, B, C and D) partly overlap (Fig. 3). There are, however, some differences in compositions. For example, zirconolite (groups MZ-A, B and C) is enriched in Nb, Ta and Fe and depleted in Th (Fig. 3d) compared to those from group MZ-D; data points for zirconolite group MZ-A form a distinct field on Ca vs REE plot.
The alteration of zirconolite (group MZ-D, Table 2, 10 spot analyses) led to the mineral enrichment in Si (up to 9.2 wt.% SiO2), Ba (up to 2.9 wt.% BaO), Sr (up to 2.6 wt.% SrO), Al (up to 1.0 wt.% Al2O3), and rarely P (3.4 wt.% P2O5 in single spot analysis). The content of CaO, ZrO2 and Fe2O3 are decreasing (up to 1.7, 17.8 and 1.5 wt.% respectively). Analytical totals are low and range between 89.7 and 96.1 wt.%.
Representative compositions of altered zirconolite

Notes: Dy, Er, Yb, W, F and Cl – below detection limit. Blanks – content of the element is below detection limit.
Composition of the heat-treated zirconolite
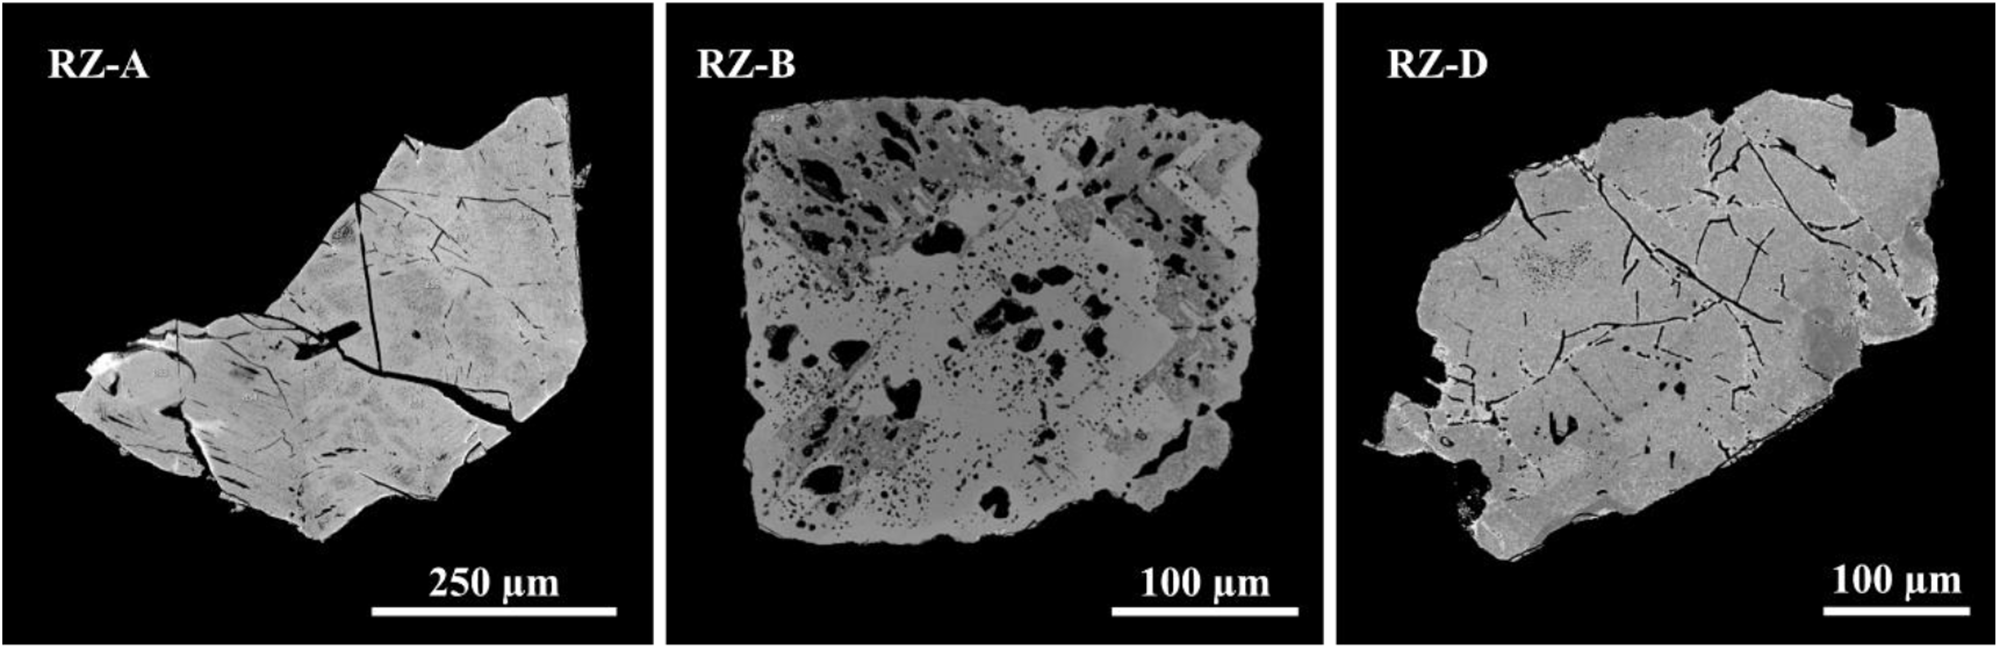
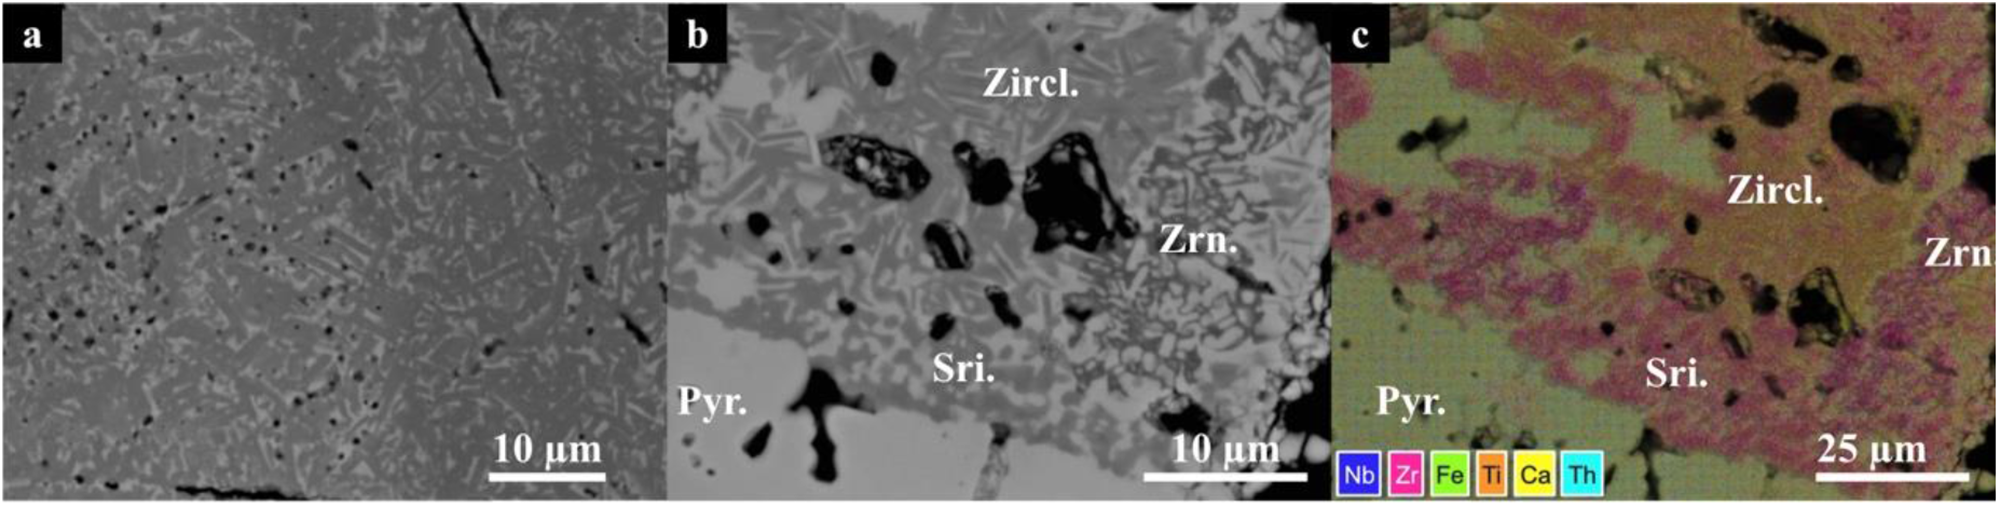
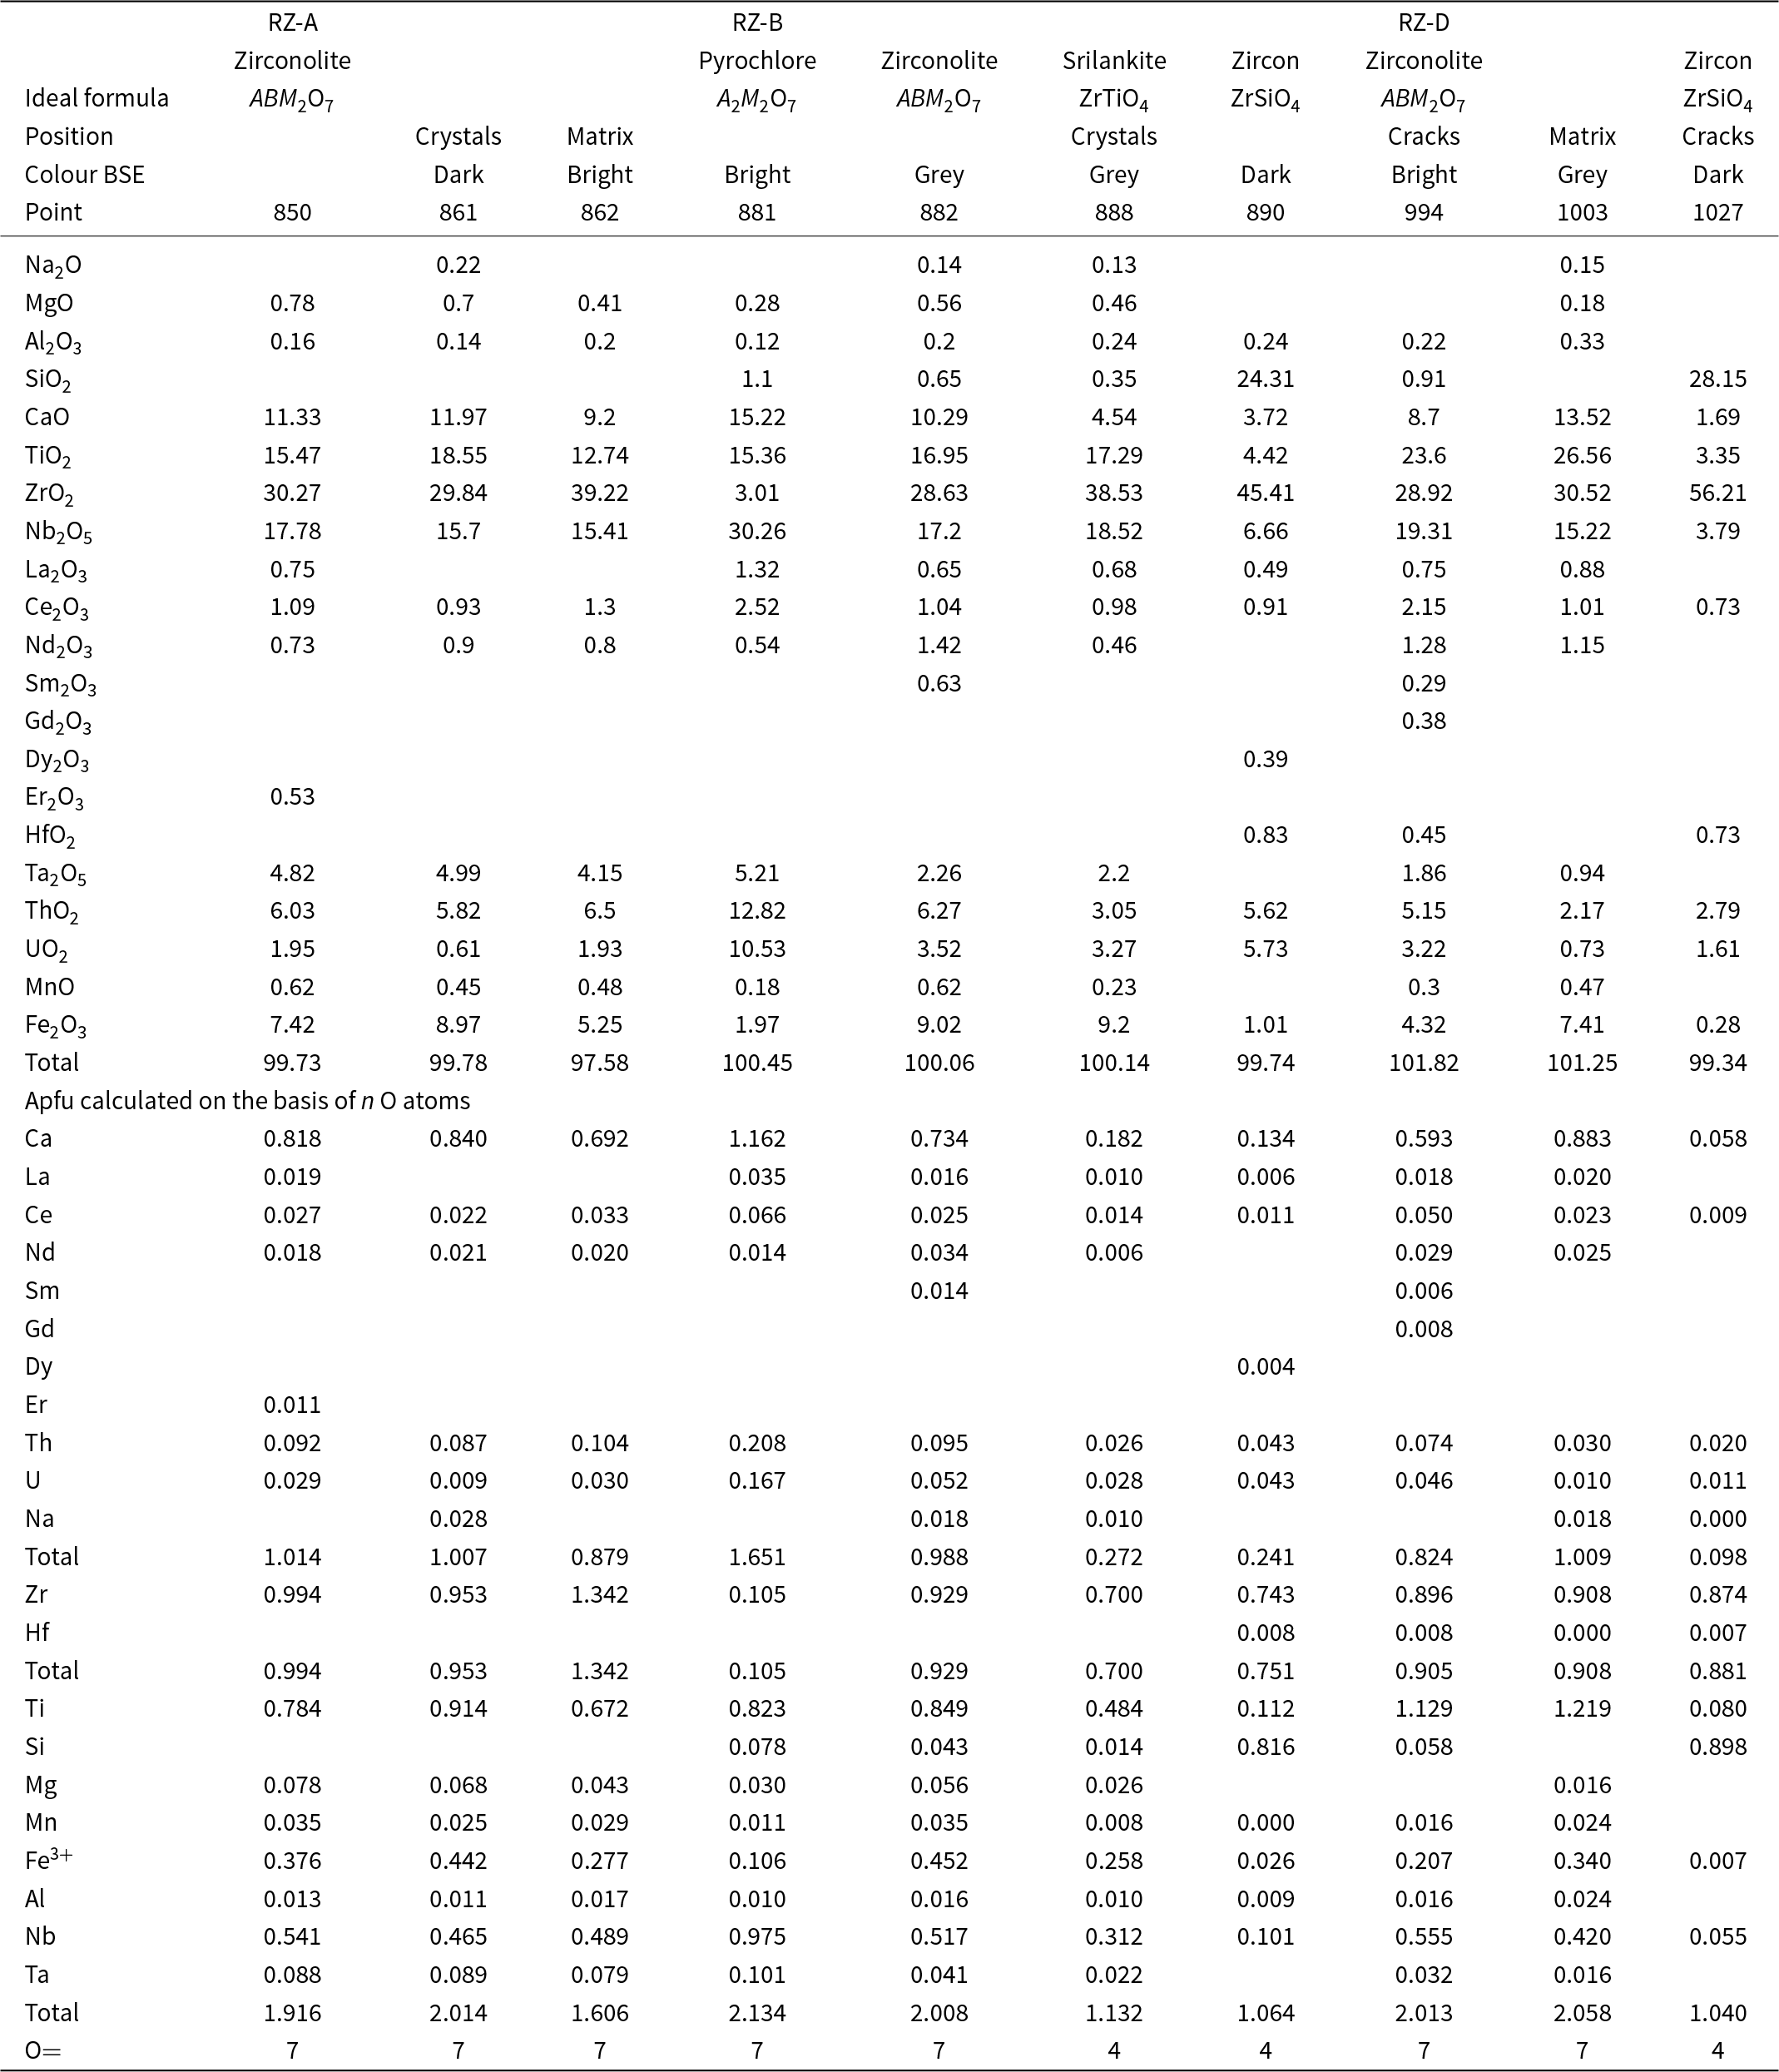
Representative zirconolite compositional data and calculated atoms per formula units (apfu) values are presented in Table 3. The compositional zoning in MZ-A is significantly eliminated after heating, i.e. RZ-A in Fig. 4. Microcrystals of zirconolite in RZ-A can be observed in BSE in Fig. 5a, where unoriented dark grey crystals have formed within a brighter matrix. These darker crystals (2–5 µm) in have lower U, REE, and higher Mg, Fe contents (Table 3, point 861–862).
Representative grains of recrystallised zirconolite (RZ) samples, obtained by heating metamict zirconolite in air at 1200°C for 10 hours. The compositional zoning present in the zirconolite is essentially eliminated in RZ-A and RZ-D after heating. The intergrowth texture of zirconolite in pyrochlore persists after heating in RZ-B.

Back-scatter electron image of: (a) dark grey zirconolite microcrystals within a brighter matrix of zirconolite composition in sample RZ-A; and (b) zirconolite, zircon and srilankite crystallised within pyrochlore in sample RZ-B. (c) False-colour element-distribution map covering the region in (b) at a slightly lower magnification. The composition is given in Table 3.

Representative compositions (Hitachi SEM) of recrystallised zirconolite, pyrochlore, srilankite and zircon

In the RZ-B type the intergrowth texture of zirconolite in pyrochlore persists after heating, as illustrated in Fig. 4. However the crystallised zirconolite in RZ-B, akin to RZ-A, manifests an elongate habit with a crystal size in the range of 2–5 µm. The SEM data and element-distribution mapping (Table 3; Fig. 5b, c) show other phases including: srilankite, pyrochlore, baddeleyite and zircon is present.
Microcrystals of zirconolite can also be identified in RZ-D, where compositional zoning has also been eliminated after heating. The redistribution of elements in these crystallites could not be investigated in detail because of the limitations of the microprobe analysis. Generally in the samples, brighter phases congregate around cracks and display lower Fe and higher U content.
Raman spectroscopy
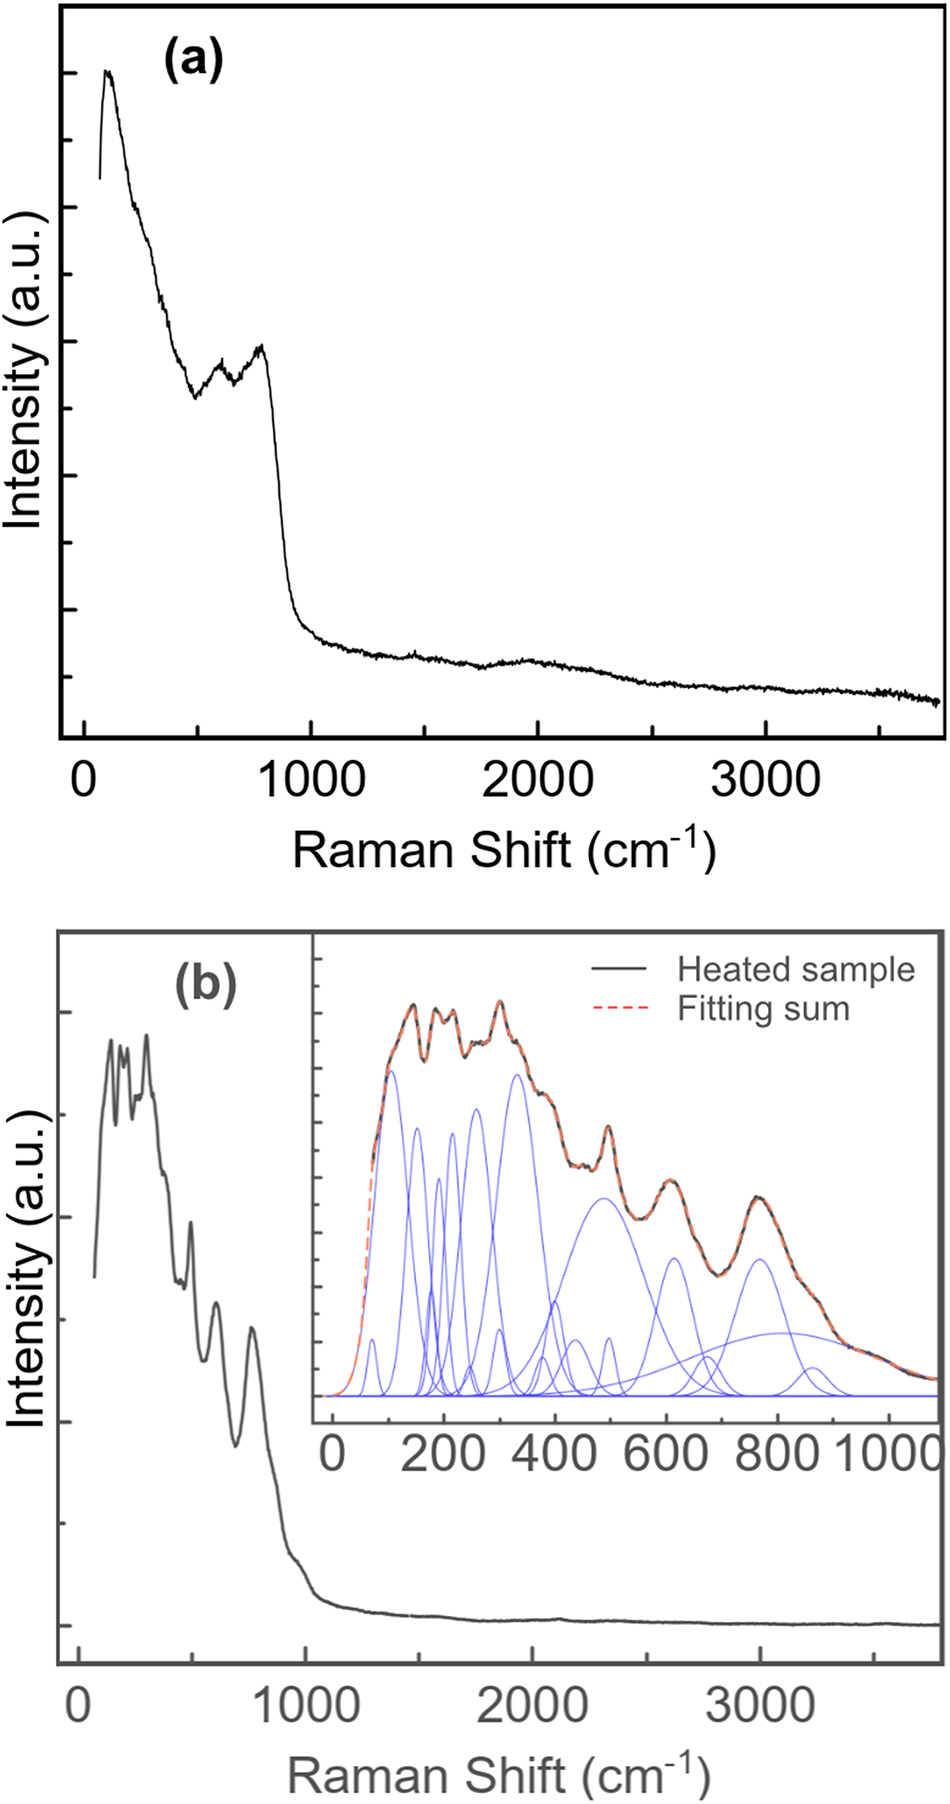
Raman spectra of all MZ samples are similar and show the absence of H2O and (OH)- (Fig. 6a).
Raman spectra of zirconolite MZ-D (a) and recrystallised RZ-D (b) (laser 532 nm).

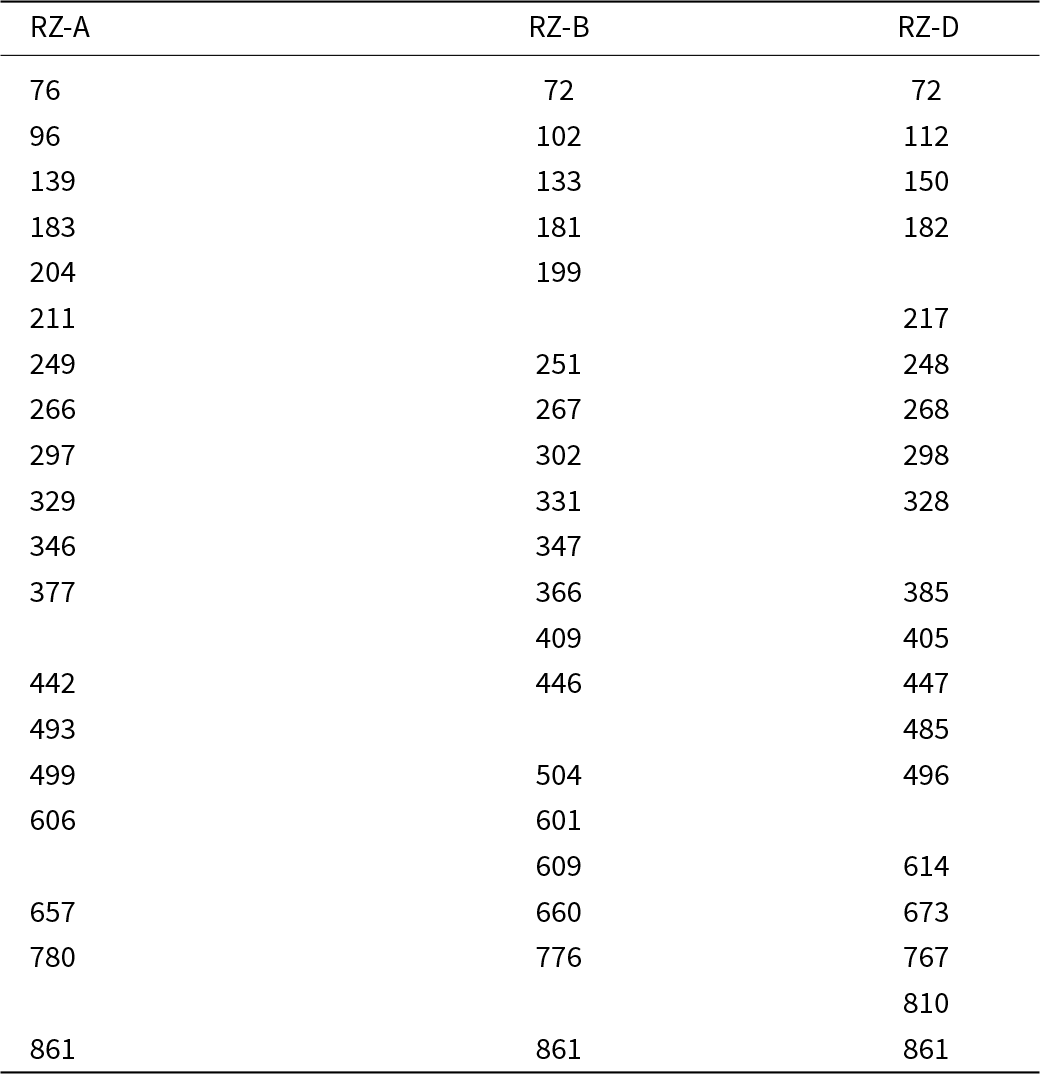
Raman spectra of all heat-treated samples are also very similar. RZ-D sample demonstrates a number of well defined and intense Raman bands (Fig. 6b). The main peaks are observed at 150, 182, 217, 268, 496, 614 and 767 cm–1, and shoulders at 72, 112, 248, 298, 328, 385, 405, 447, 485, 673, 810 and 861 cm–1. The observed vibrations are in agreement with those previously reported in zirconolite-type minerals (Chukanov et al., Reference Chukanov, Krivovichev, Pakhomova, Pekov, Schäfer, Vigasina and Van2014, Reference Chukanov, Zubkova, Britvin, Pekov, Vigasina, Schäfer, Ternes, Schüller, Polekhovsky, Ermolaeva and Pushcharovsky2018) and synthetic zirconolite (Salamat et al., Reference Salamat, McMillan, Firth, Woodhead, Hector, Garbarino, Stennett and Hyatt2013; Zhang et al., Reference Zhang, Wang, Wang, Huang, Luo, Liang and Tan2018; Blackburn et al., Reference Blackburn, Sun, Gardner, Maddrell, Stennett and Hyatt2020; Thompson et al., Reference Thompson, Frankland, Bright, Read, Gilbert, Stennett and Hyatt2021). The peak at 770 cm−1 is assigned to the symmetric Ti–O vibrations in TiO6 octahedra. The bands in the range 400–800 cm–1 correspond to lower intensity Ti–O internal vibrations, whereas those below 400 cm–1 can be attributed to Ca–O and Zr–O vibrations in CaO8 and ZrO7 polyhedra (Chukanov et al., Reference Chukanov, Zubkova, Britvin, Pekov, Vigasina, Schäfer, Ternes, Schüller, Polekhovsky, Ermolaeva and Pushcharovsky2018; Blackburn et al., Reference Blackburn, Sun, Gardner, Maddrell, Stennett and Hyatt2020). Table 4 lists the peaks observed in RZ-A, RZ-B and RZ-D samples.
Raman shift (cm–1) of bands observed in recrystalised zirconolite (RZ) samples

In situ recrystallisation of the metamict zirconolite
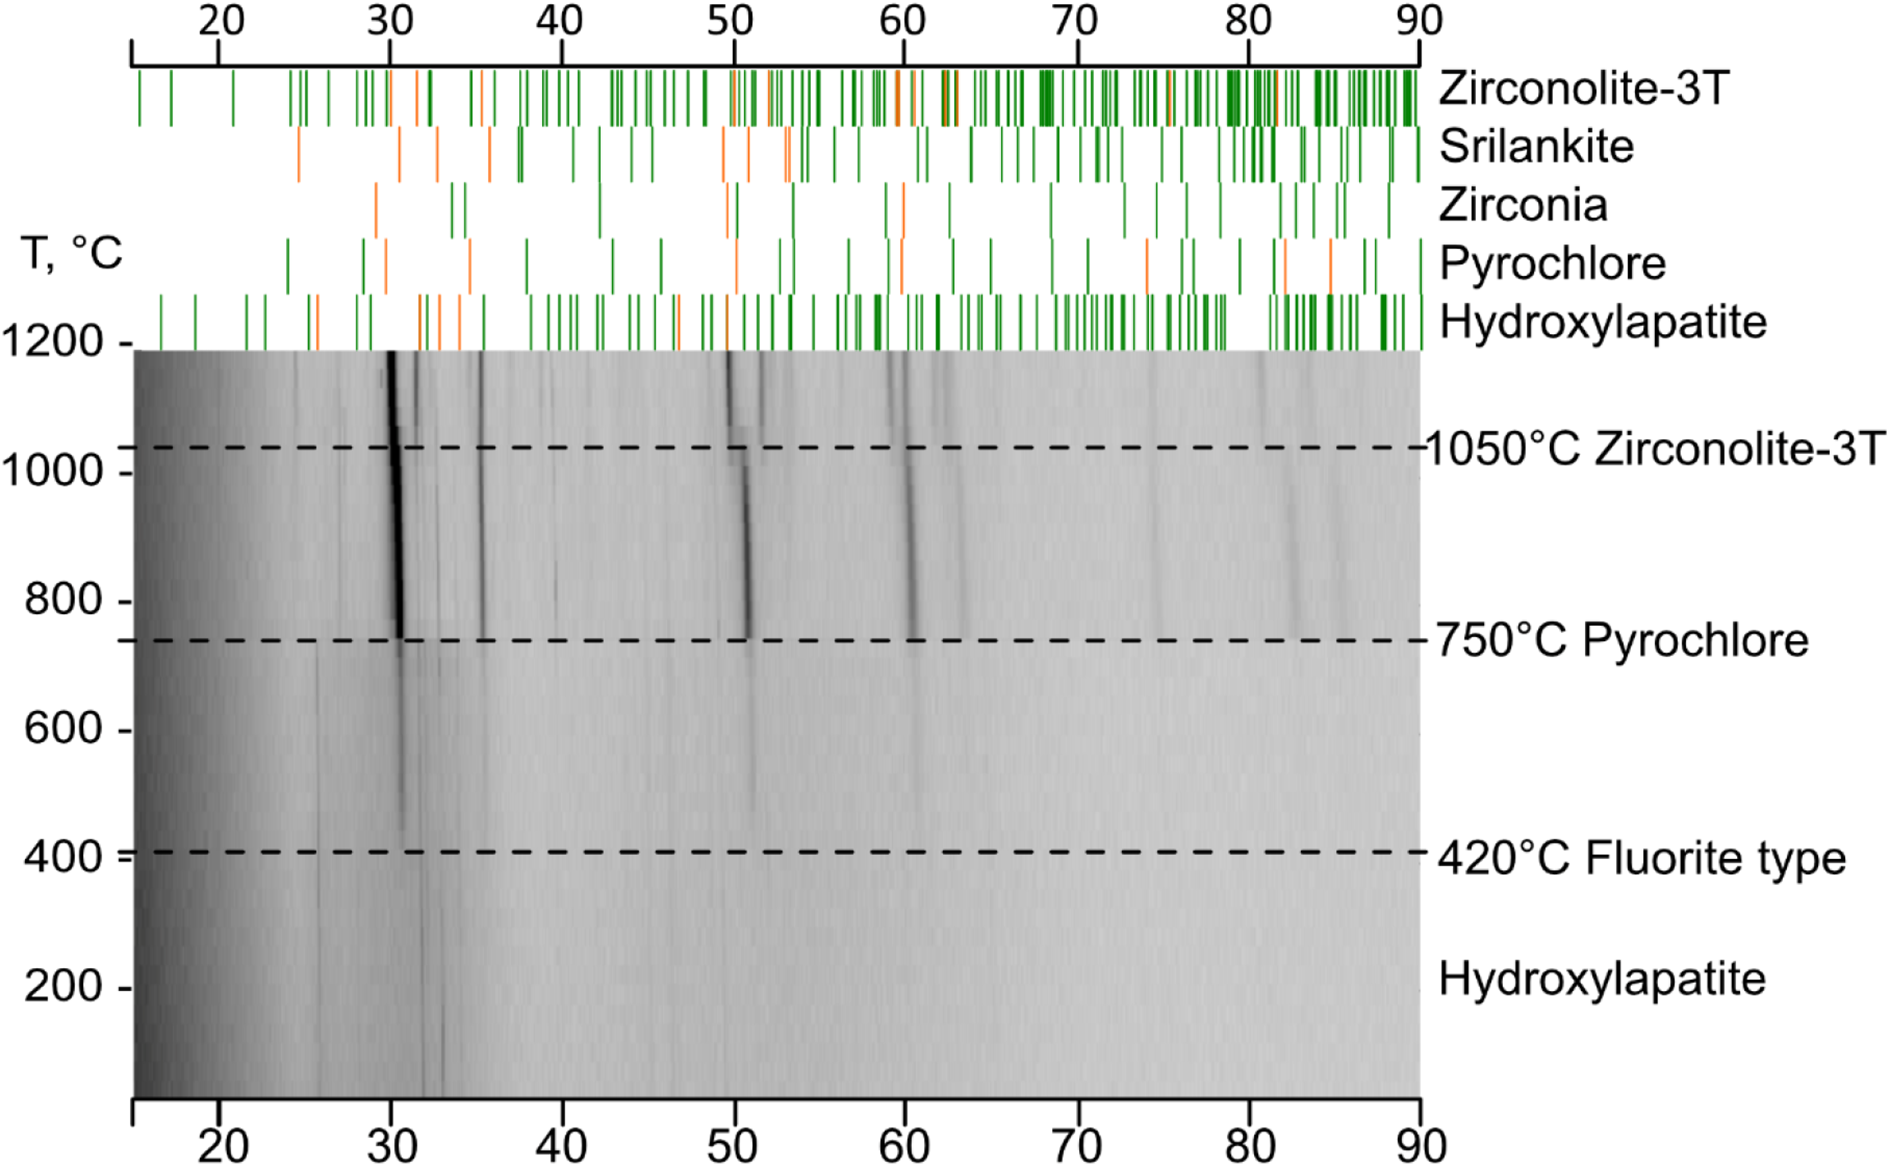
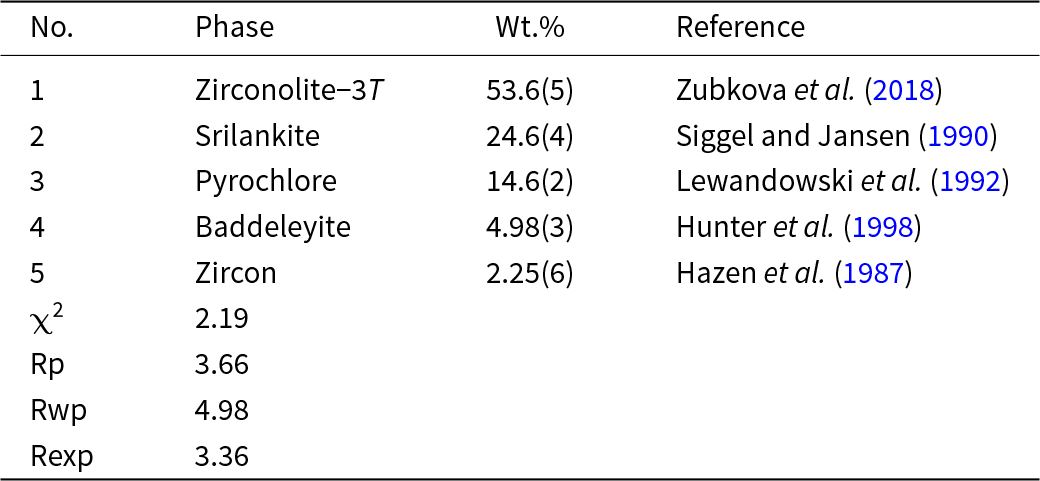
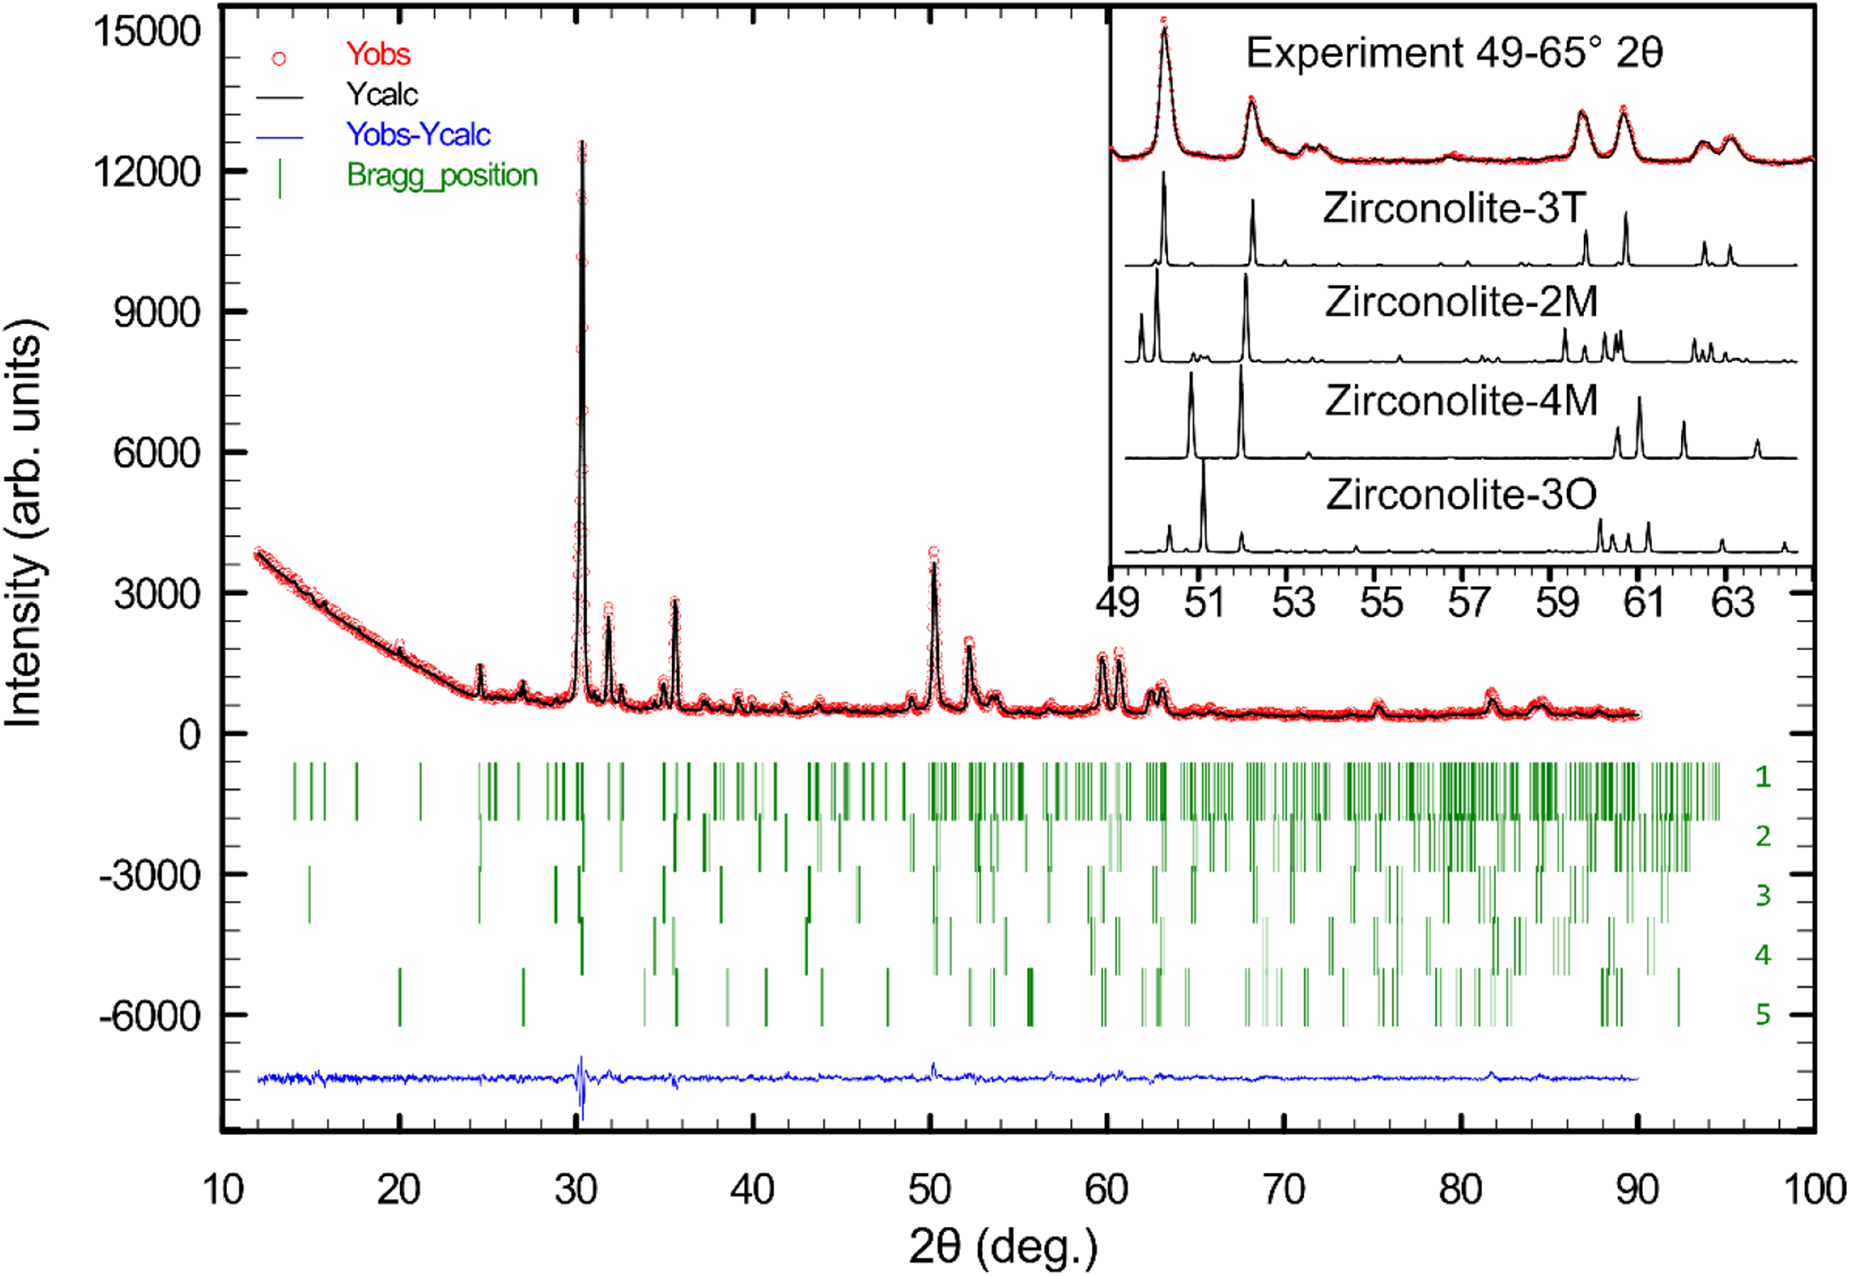
The evolution of the metamict MZ-D upon heating to 1200°C is shown in Fig. 7. The initial sample contains crystalline hydroxylapatite inclusions (detected using HTPXRD). Upon heating, dehydration of hydroxylapatite occurs and decomposition is observed above 750°C. A fluorite-type phase starts to crystallise at 420°C and crystallisation of a pyrochlore phase can be identified at 750°C. Five major phases were identified and related data are given in Table 5. The phases are: zirconolite-3T (54 wt.%), srilankite (25 wt.%), pyrochlore (15 wt.%), baddeleyite (5 wt.%) and zircon (2 wt.%). This phase identification is in good agreement with the compositional data listed in Table 3.


The HTPXRD results show that zirconolite crystallises at 1050°C. Calcium is substituted by Th, U and rare earth elements, whereas Nb and Ta partially occupy Ti sites. Of the possible polymorphs, zirconolite-2M is likely to be unstable for this composition with multiple substitutions and is more common for zirconolites with a relatively simple composition and minor substitutions (Vance et al., Reference Vance, Lumpkin, Carter, Cassidy, Ball, Day and Begg2002). Several previous investigations have observed the appearance of polytypes such as 3T, 3O and 4M with increasing levels of substitution in the Ca, Zr and Ti sites (Gilbert et al., Reference Gilbert, Selfslag, Walter, Stennett, Somers, Hyatt and Livens2010; Ji et al., Reference Ji, Su, Liao, Ma, Wang, Shih, Chang, Lee, Chan and Li2020). The inset in Fig. 8 gives a comparison of the reflection positions for RZ-D against the reference patterns for different polymorphs. The most intense reflection at 2θ = 30.1° is common for all polytypes, leading to a frequently incorrect phase identification. However, the observed reflections at 50.2 (220), 59.7 (042) and 60.6 (226) can be assigned to zirconolite-3T.
X-ray diffraction pattern for RZ-D. Details for the five identified phases 1–5 and references are given in Table 5; χ2 = 2.19 indicates a good fit. The inset shows reference patterns for various possible polytypes compared with RZ-D (red line) in the range 2θ = 49–65°. Zirconalite-3T is the best match. Reference patterns used: zirconolite-3T (Zubkova et al., Reference Zubkova, Chukanov, Pekov, Ternes, Schüller, Ksenofontov and Pushcharovsky2018), zirconolite-2M (Whittle et al., Reference Whittle, Hyatt, Smith, Margiolaki, Berry, Knight and Lumpkin2012), zirconolite-4M (Coelho et al., Reference Coelho, Cheary and Smith1997), and zirconolite-3O (Chukanov et al., Reference Chukanov, Zubkova, Pekov, Vigasina, Polekhovsky, Ternes, Schüller, Britvin and Pushcharovsky2019).

Thermal expansion of zirconolite-3T
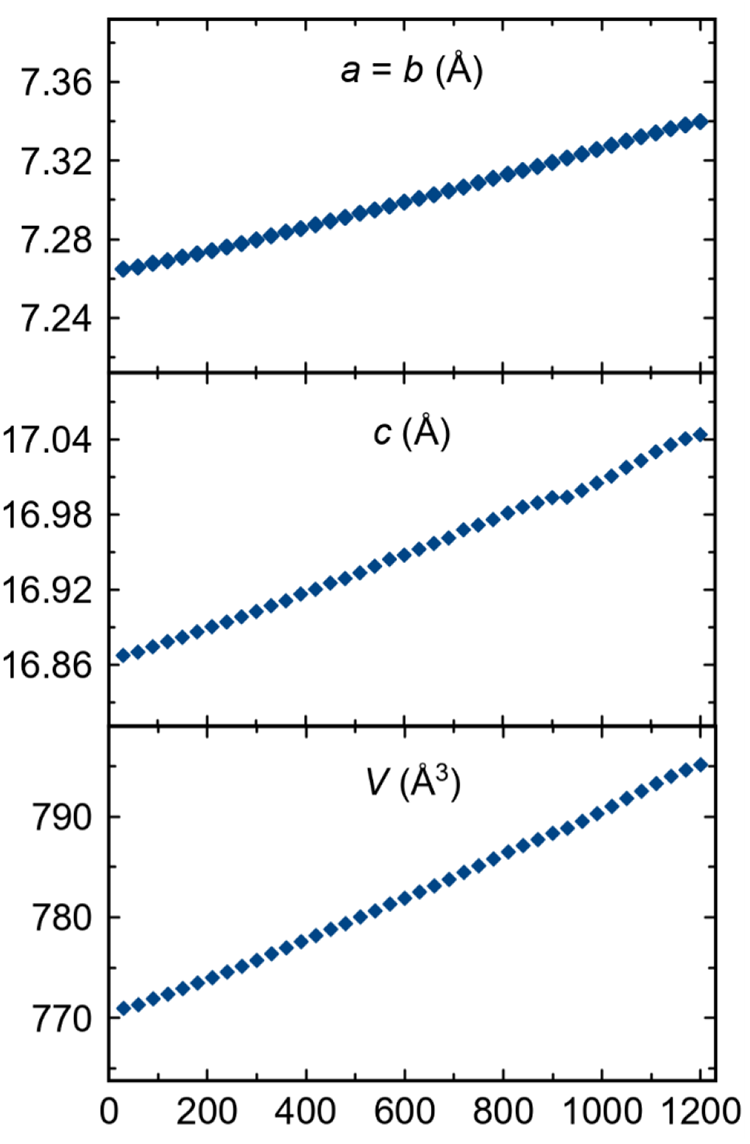
The sample RZ-D was used to examine the thermal expansion of zirconolite-3T. Zirconolite-3T is very stable upon heating to 1200°C and the a unit-cell parameter increases linearly from 7.26 to 7.34 Å, while c increases from 16.87 to 17.04 Å (Fig. 9).
Temperature dependence of unit-cell parameters of zirconolite-3T.

Coefficients of thermal expansion (CTE) were obtained by fitting a quadratic polynomial to the temperature dependence of unit-cell parameters in the range 25–1200°C:
 \begin{align*}
a(\text{T}) &= b(\text{T}) = 7.26240(12) +0.00005634(47) \times {\text{T}} \nonumber\\
&\quad + 0.00000000737(37)\text{T}^2\\
C(\text{T})&=16.86206(78) + 0.0001322(30) \times {\text{T}} \nonumber\\
&\quad + 0.0000000156(24)\text{T}^2\\
V(\text{T})&=770.201(41)+0.01795(16) \times {\text{T}} + 0.00000249(13)\text{T}^2
\end{align*}
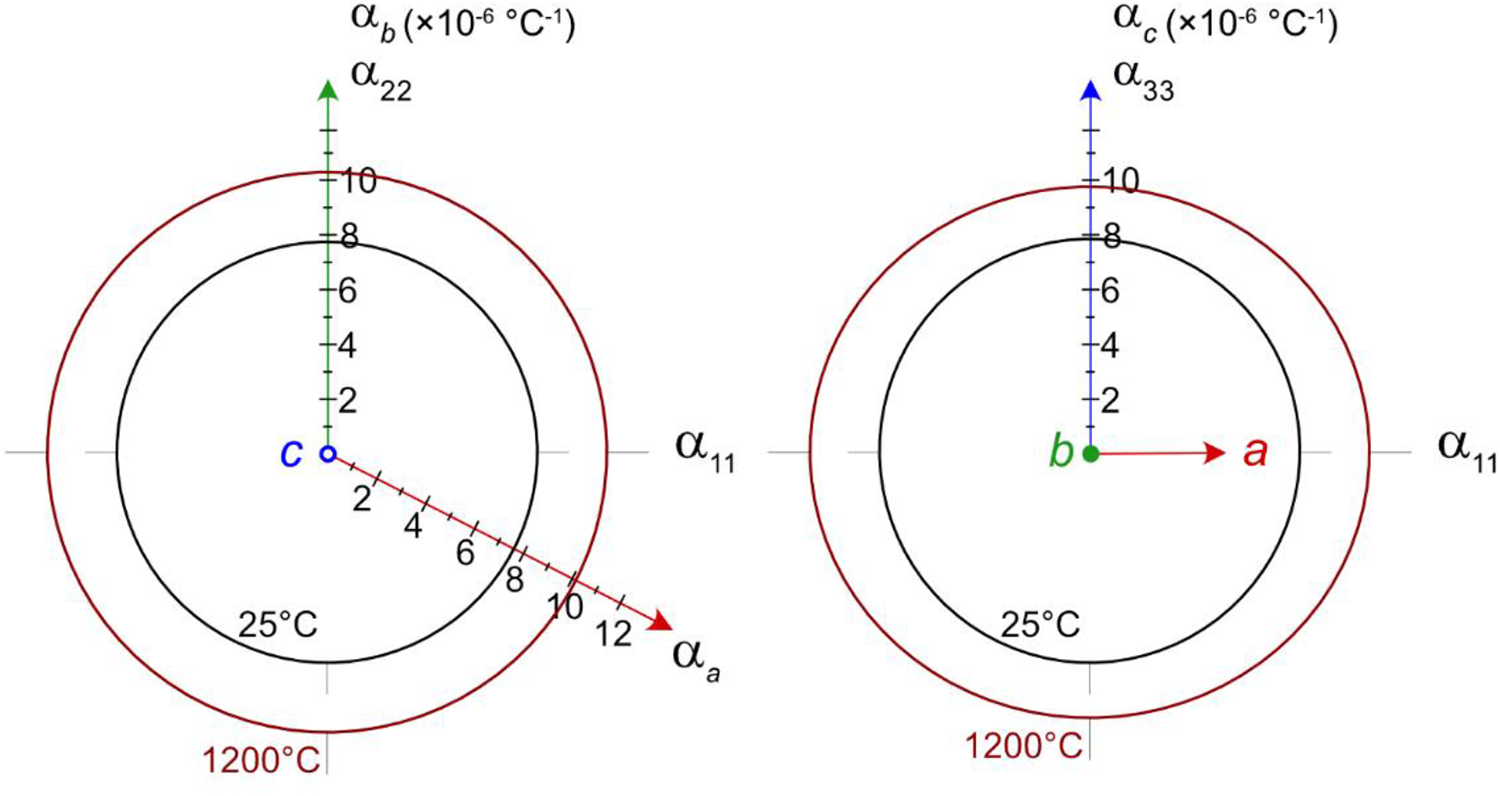
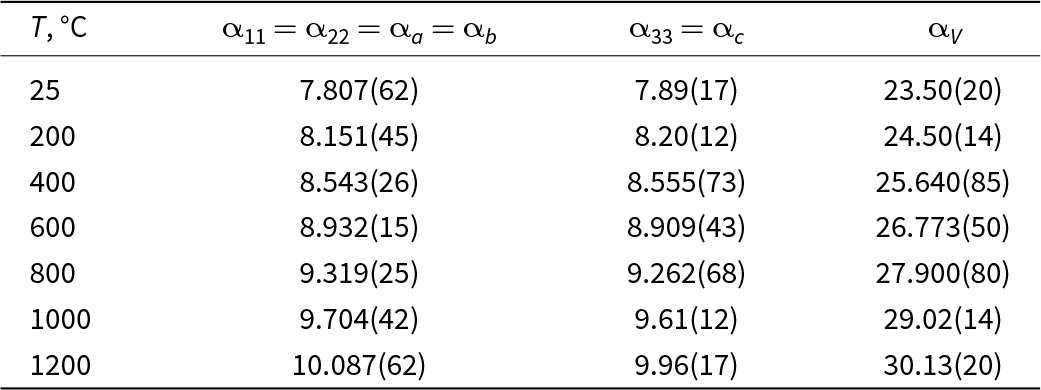
The CTE values obtained are given in Table 6 and illustrated in Fig. 10. The thermal expansion in the ab plane is isotropic and constrained by the symmetry. The average CTE values in the temperature range 25–1200°C are as follows:  ${{\bar \alpha }}$a =
 ${{\bar \alpha }}$b =
 ${{\bar \alpha }}$11 =
 ${{\bar \alpha }}$22 = 8.95· 10–6 deg–1. Similarly, the thermal expansion along the c-axis yields a similar value:
 ${{\bar \alpha }}$a =
 ${{\bar \alpha }}$b = 8.93·10–6 deg–1, indicating almost isotropic thermal expansion of zirconolite-3T.
Sections of CTE for zirconolite-3T.


Discussion and concluding remarks
At Kovdor, zirconolite occurs in diverse phoscorite and carbonatites. Crystal morphology, internal zoning and mineral composition suggest that at least four groups (populations) of zirconolite are present in phoscorites and carbonatites. All the zirconolite crystals investigated are metamict, and the mineral exhibits notable concentrations of niobium, iron, lanthanides and actinides.
On heating metamict crystals zirconolite-3T crystallises at 1050°C. The pyrochlore-type and fluorite-type phases precede the crystallisation of zirconolite-3T (Fig. 7). This observation is in agreement with previous studies showing that when the precursor powder with the composition of zirconolite is heated, the first compound formed has a fluorite-type structure (Vance et al., Reference Vance, Ball, Blackford, Cassidy and Smith1990). A reverse sequence of phase evolution was observed for zirconolite damaged by radiation. Ewing and Headley (Reference Ewing and Headley1983) have reported that upon radiation damage, the crystalline zirconolite first transforms into a mixture of fluorite-type phases, eventually becoming completely amorphous. In addition, the formation of pyrochlore may point to the decomposition of the solid solution of zirconolite. As previous research shows, zirconolite is gradually replaced by pyrochlore, when actinides are present in significant amounts in the Zr site (Vance et al., Reference Vance, Lumpkin, Carter, Cassidy, Ball, Day and Begg2002; Zhang et al., Reference Zhang, Wang, Wang, Huang, Luo, Liang and Tan2018).
In general, the CTE obtained for the zirconolite-3T mineral sample with complex composition agrees well with previous studies. Ball et al. (Reference Ball, Thorogood and Vance1992) reported CTE values of 10.05(19) ×10–6 deg–1 and 9.83(15) ×10–6 deg–1 for 3T and 2M polytypes, respectively. The lower CTE value observed in our investigated for zirconolite-3T may be attributed to the complex chemistry and polyphase nature of the material. It seems that matrix materials may reduce CTE in polyphase ceramics compared to their monophasic counterparts. Zirconolite-3T with an almost isotropic thermal expansion confirms the remarkable properties of these phases for use in complex and multi-component ceramics for the immobilisation of HLW.
Acknowledgements
We thank two anonymous reviewers and Associate Editor Irina Galuskina for many useful remarks that significantly improved initial version of the manuscript. ANZ acknowledges support from The Natural History Museum (London). Technical support by the X-ray diffraction and Geomodel SPbSU Resource Centers is gratefully acknowledged.
Funding statement
This work was financially supported by the Russian Science Foundation through the grant 24-63-00006 (for OIS).
Competing interests
The authors declare none.