

1. Introduction
A key finding in the current literature on distributive politics is that the distributive allocation of government goods and services can contribute to political survival in both democratic and non-democratic states. In countries with competitive elections, there has been much discussion on how elected politicians strategically distribute different varieties of collective and particularistic goods to build their support base (e.g., Stokes and Dunning, Reference Stokes and Dunning2013; Diaz-Cayeros et al., Reference Diaz-Cayeros, Estevez and Magaloni2015). Similarly, recent studies based on authoritarian regimes have demonstrated that non-democratic leaders allocate different varieties of public and private goods to prevent elite defection and popular uprisings while deterring support for the opposition (e.g., Magaloni, Reference Magaloni2006; Blaydes, Reference Blaydes2011; Mahdavi, Reference Mahdavi2015).
We argue that existing studies may have neglected a critical precondition of this widely accepted conventional wisdom, as suggested by the literature. In many developing countries and conflict-fraught areas, political leaders often lack adequate institutional means and apparatus to exercise effective control and detect citizens' preferences and support (Fearon and Laitin, Reference Fearon and Laitin2003; Muralidharan et al., Reference Muralidharan, Niehaus and Sukhtankar2016). Under these constraints, we argue that distributive allocations can contribute to political survival through a different channel – the selective delivery of infrastructure-oriented public projects helps to strengthen control in the areas of contested statehood through increases in the presence of government agencies and functionaries that can bolster the central state's administrative and security surveillance at the grassroots level.
To illustrate our argument, we focus on the Chinese government's campaign of poverty alleviation in Xinjiang, one of the poorest, most unstable, and most ethnically diverse provinces in the country. In the early 1990s, Beijing announced the campaign of poverty alleviation and development (fupin kaifa) as a key policy instrument for the Han-dominated Chinese state to address the issues of economic backwardness and ethnic grievance in Xinjiang (Tong, Reference Tong2010). Using a unique panel dataset, we examine the allocation of fiscal assistance and work-for-relief grants across different counties, as well as their effects. Both programs were key components of China's national poverty alleviation plan between 1994 and 2000 – namely the ‘8-7’ Plan. The Plan was introduced to mitigate poverty and increase agricultural production in Xinjiang by financing the construction of various production facilities, such as roads, power grids, and irrigation pumps. We examine how these programs impacted local public spending and other development outcomes.
We find that poverty-relief transfers in Xinjiang have contributed more to the making of state capacity than improving rural development and reducing ethnic violence. These transfers have a statistically significant effect on increasing the local government's spending on public security and administrative management. In comparison, the transfers have a statistically insignificant effect on rural development. In the case of ethnic violence, fiscal assistance and work-for-relief grants exhibit opposite effects, making anti-poverty payments' overall impact on conflict reduction ambiguous. Furthermore, we show that the increase in local state capacity corresponds to the central government's growing top-down command over the province. The results suggest that poverty relief in Xinjiang may have largely altered the local government's spending priorities toward categories that are crucial not only for the purpose of project implementation, but also for stronger state apparatus.
Our paper reports on the literature on distributive politics and authoritarian governance. In a broad vein, the findings highlight the need to consider the political implications of infrastructure-oriented public patronage and individual-oriented particularistic transfers differently (e.g., Stokes and Dunning, Reference Stokes and Dunning2013; Harding and Stasavage, Reference Harding and Stasavage2014; Diaz-Cayeros et al., Reference Diaz-Cayeros, Estevez and Magaloni2015)Footnote 1 – the former type of allocations may focus more on building state capacity rather than building political support. The distinction here can be crucial, particularly in the context of authoritarian regimes. Existing studies of distributive allocations in China and non-democratic states have primarily focused on how these strategic payments contribute to political survival by cultivating and securing support or compliance among the autocrat's inner circle or the general public (e.g., Magaloni, Reference Magaloni2006; Shih and Qi, Reference Shih, Qi, Shue and Wong2007; Saich, Reference Saich2008; Blaydes, Reference Blaydes2011; Mahdavi, Reference Mahdavi2015). We demonstrate that anti-poverty transfers for infrastructure construction can also build the foundation of authoritarian control by extending the state's presence in peripheral areas as a means to counter various challenges, such as lack of information (Lee and Zhang, Reference Lee and Zhang2017; Brambor et al., Reference Brambor, Goenaga, Lindvall and Teorell2020). Our results also complement Albertus et al. (Reference Albertus, Fenner and Slater2018), who study how autocrats build and maintain their power through ‘coercive distribution’ by using redistribution to undermine the power of rival political forces while extending their authoritarian influence on their citizens. More research is needed to understand how the strengthening of the administrative state in authoritarian regimes can lead to better government service delivery or more surveillance.
Our paper engages with the literature on Chinese political economy by exploring how intergovernmental transfers can contribute to the state's infrastructural presence in peripheral ethnic regions. Although studies during the past decade have attempted to uncover the determinants of fiscal subsidies in China (e.g., Su and Yang, Reference Su and Yang2000; Wang, Reference Wang, Liew and Wang2004; Shih et al., Reference Shih, Zhang and Liu2007), few studies have examined the impact of poverty-alleviation payments on institutional development.Footnote 2 Most research aims to understand how the allocated goods encourage loyalty and compliance among political elites and various groups of citizens in the country (e.g., Saich, Reference Saich2008; Solinger, Reference Solinger2015). We use poverty alleviation in Xinjiang to illustrate that the central government can focus more on ‘purchasing’ capacity when allocating financial and other resources. Our paper also reports on studies that similarly explore the changing role of the Chinese state in the Reform Era (Shue, Reference Shue1988; Hu and Wang, Reference Hu and Wang2001). The results also suggest that the 8–7 Plan may have paved the way for the targeted poverty alleviation program introduced by Xi Jinping (see Zeng, Reference Zeng2020).
For causal identification, we employ a newly extended covariate balancing propensity score (CBPS) to estimate the causal effect of poverty alleviation transfers (Fong et al., Reference Fong, Hazlett and Imai2018). CBPS combines propensity score estimation with balance covariates to derive the inverse probability of treatment weights (IPTWs). The method has been generalized to allow continuous treatments, as well as introducing a non-parametric balance-based estimation approach for the weights.Footnote 3 As alternatives, we employ first-differenced and instrumental variable regression analysis, which yields similar results.
We would like to emphasize that poverty alleviation in Xinjiang illuminates the relationship between distributive politics and state building. Although the poverty alleviation transfers examined here took place more than two decades ago, it is one of the most well-documented policy programs through which the central government explicitly declared its intention to bring order and peace in the province through the construction of large-scale local public production facilities. Between 1994 and 2000, the Chinese government's poverty alleviation campaign allocated nearly 5 billion RMB to Xinjiang (about 625 million in USD according to the exchange rates in 2000); in comparison, Yunnan – another ethnically diverse province – received about 1 billion RMB. In fact, the size of payments for poverty alleviation is comparable to other non-poverty-relief fiscal subsidies. In some counties, the amount of the payments was twice as much as non-relief subsidies. The results of additional analysis also show that other non-relief intergovernmental transfers do not have the same capacity-building effects as poverty alleviation payments.
Our paper proceeds as follows. In Section 2, we discuss the existing literature to develop testable hypotheses. In Section 3, we introduce the campaign of poverty alleviation in China and its implementation in Xinjiang. In Section 4, we present the data and define the key variables before providing the CBPS and other estimates of the effect of poverty-reduction transfers in Xinjiang. In Section 5, we examine the implications of local state building and highlight the central government's increasing control over the provincial government throughout the 1990s. We conclude our paper by discussing the implications for future research.
2. Distributive allocations for state building
Since Lasswell (Reference Lasswell1936), who inquires ‘who gets what, when and how,’ many have been interested in learning why some areas or groups in a country have received more or better government resources and services (Golden and Min, Reference Golden and Min2013). Existing studies suggest that the distributive allocations of public goods and services can contribute to political survival by shaping the attitudes of those who benefit from these allocations. For instance, elected politicians, depending on their risk preferences, tend to selectively target their core or swing voters when rendering distributive decisions (e.g., Stokes and Dunning, Reference Stokes and Dunning2013; Diaz-Cayeros et al., Reference Diaz-Cayeros, Estevez and Magaloni2015). Also, politicians may have incentives to focus on the poor because the arranged transfers will create the largest marginal utility to those living in impoverishment, and, as a result, bring the largest number of votes per dollar spent (Dixit and Londregan, Reference Dixit and Londregan1996). Despite the absence of fully competitive elections, recent studies of authoritarian regimes have shown that the distributive allocations of public goods or private patronage can help autocrats stay in power (e.g., Magaloni, Reference Magaloni2006; Blaydes, Reference Blaydes2011; Mahdavi, Reference Mahdavi2015).
Current research on post-Reform China has similarly explored how fiscal transfers and social welfare policies have sustained the Chinese Communist Party's legitimacy by inducing loyalty among its members while gaining citizens' support (Saich, Reference Saich2008). Shih et al. (Reference Shih, Zhang and Liu2007) show that fiscal transfers have been focused on localities with a large number of Party cadres and associates, in order to retain their political loyalty. In the case of education reform, Lü (Reference Lü2014) studies how social policy reform can shape Chinese citizens' perception of government legitimacy. Similarly, Huang (Reference Huang2015) argues that the central government allows local officials to undermine the threat of popular grievances by selectively determining the coverage and generosity of health insurance programs. When constructing the ideal types of current social assistance programs in China, Solinger (Reference Solinger2015) explicitly suggests that the anti-poverty programs in China aim to address grievances in the general population.
We contend, however, that previous studies may have neglected a crucial precondition. To ensure these allocations achieve the expected ‘support-building’ scenario, it is crucial that politicians and government agencies are capable of defining the criteria of payment, specifying eligible recipients, and ensuring that the planned payments will reach designated beneficiaries. Such capacity, as elaborated by Mann (Reference Mann1984), is manifested by the government's infrastructural power, undertaken by a set of administrative organizations. The state plays a crucial role in commanding and coordinating different government agencies and functionaries within its territory – their ‘penetration’ into the society builds the foundation for effective governance, allowing the state to maintain political order while staying informed about citizens' needs and preferences (e.g., Rotberg, Reference Rotberg and Rotberg2004; Rothstein and Stolle, Reference Rothstein and Stolle2008; Soifer and vom Hau, Reference Soifer and vom Hau2008).
In many developing countries, state incapacity has hindered effective territorial control (e.g., Herbst, Reference Herbst2000; Michalopoulos and Papaioannou, Reference Michalopoulos and Papaioannou2014; Muralidharan et al., Reference Muralidharan, Niehaus and Sukhtankar2016). Although governments in these countries have been providing various pro-poor benefits to individuals and households, the implementation of these allocations has been a daunting task due to low or weak state capacity. For instance, without a functioning statistical system, the government will not have accurate information to determine or verify the eligibility of service delivery and locate eligible individuals. Taxation will also be problematic because government agencies are not fully aware of their tax base. With no efficient and reliable bureaucracy, there is also no guarantee that the planned payments will take place. Even in China, where the central state has been considered relatively strong, prior research has noted similar predicaments, highlighting non-state and familial communities as the key forces of local public goods provision (Tsai, Reference Tsai2007; Xu and Yao, Reference Xu and Yao2015). Lee and Zhang (Reference Lee and Zhang2017) summarize the importance of information in understanding state capacity, as the amount and depth of information regarding the citizens and different locations are crucial in ensuring effective governance. In their operationalization of state building, Brambor et al. (Reference Brambor, Goenaga, Lindvall and Teorell2020) adopt a similar position by considering various information collection and processing activities through government agencies, such as censuses, statistical yearbooks, and civil and population registers.
These challenges are common in countries fraught with ethnic violence. Although previous studies have explored how fiscal subsidies help to contain regional grievances and prevent ethnically divided countries from disintegration (e.g., Treisman, Reference Treisman1999), governments in many of these countries have also had a difficult time imposing reliable administrative and policing forces to counter rebel and insurgent groups, especially in remote areas (Fearon and Laitin, Reference Fearon and Laitin2003). Even if fiscal appeasement can be a potential solution to reduce violence and conflicts, Berman et al. (Reference Berman, Shapiro and Felter2011) demonstrate that the delivery of government relief can best reduce conflicts when government administration holds sufficient local knowledge.
In a nutshell, the conventional wisdom that the allocations of government goods and services will bring loyalty or support can be problematic, as it assumes a certain degree of state capacity that can be absent in developing or unstable countries. We propose that selective distributions of anti-poverty goods can contribute to political survival by allowing the state to build its ruling capacity at the local level. In particular, when poverty alleviation transfers are allocated to build roads, bridges, power stations, water pumps, and other production facilities in politically unstable areas, we argue that the government will have the incentive to build up its administrative and security forces. These forces can play a key role in managing the allocated resources and supporting the construction of the assigned projects. In the long run, these agencies and functionaries allow the state to stay informed and to mobilize the collection of human and financial resources, as suggested by Migdal (Reference Migdal2004) – the ‘routine performance’ of state actors and agencies plays a crucial role in establishing and sustaining political control. These infrastructure projects are pivotal for state development, as put by Van de Walle and Scott (Reference Van de Walle and Scott2011) and Joyce and Mukerji (Reference Joyce and Mukerji2017), by facilitating the state's penetration and the standardization of its daily control. In other words, infrastructure-focused poverty alleviation schemes allow the state to extend its reach to peripheral areas and create regular forces to exercise its governing authority as the central state establishes mechanisms to monitor and inspect the progress and outcome of poverty alleviation programs.
In a case study of the Fujian Province in China, Lyons (Reference Lyons1998) also hints that poverty reduction serves to boost the Center's oversight over the province, as poverty alleviation entails the creation of new provincial branches of the Leading Group of Poverty Alleviation and Development in Beijing. In a review of China's Western Development Program, Naughton (Reference Naughton, Naughton and Yang2004) also suggests that the infrastructure investment arranged by the central government may have extended its control in peripheral areas. Outside China, Hechter (Reference Hechter1975) theorizes the concept of ‘internal colonialism’ to elucidate the growth of England's presence in the British Isles through administrative expansion and resource extraction. Similarly, based on the experience of poverty alleviation in Lesotho, Ferguson (Reference Ferguson1990) finds that road construction and electrification have facilitated state building in the country. Although the programs initiated by the World Bank may appear to be ‘apolitical,’ these programs have helped the central state to wield its authority in remote and impoverished areas. Callen (Reference Callen2016) focuses on how the establishment of the national railway network in the USA reflected the interactive dynamics between the federal government and individual states, which, in turn, shaped the trajectory of state building in the nineteenth century.
The scenarios we have described above resemble our case of poverty alleviation in Xinjiang, as poverty alleviation there explicitly focused on infrastructure construction. In a conflict-fraught and peripheral province, the central government inevitably needs to tackle the issue of state incapacity. The corollary of our argument is that poverty alleviation payments, when focusing on the local public facilities, can trigger the investment in governance infrastructure that will not only facilitate the construction of these infrastructure projects, but also strengthen the state's control in these areas. Our argument, thus, departs from the conventional ‘building support’ story, as we focus on how the distributive allocations allow political elites to increase their control in the areas of contested statehood.
Empirically, we focus on the relationship between poverty alleviation transfers and the local government's spending priorities. We expect to observe that the transfers allocated for infrastructure construction lead to increases in public spending in the categories that are vital for governing capacity. More specifically, following from our argument, the increases in the capacity-related spending should take place during the construction stage of an infrastructure project. We expect the effect to be immediate even before the infrastructure is in place. Existing literature has identified different dimensions of state capacity (e.g., Hendrix, Reference Hendrix2010). Although a comprehensive review is beyond the scope of this paper, a capable state will be able to impose effective control by deploying adequate bureaucratic agencies and security forces to maintain political and social order to ensure a smooth implementation of its proposed policies. We, therefore, expect to see poverty alleviation in Xinjiang associated with increases in the per capita spending on government administration and public security.
Hypothesis 1 Capacity-building poverty-reduction transfers will increase the local government's per capita spending on public administration.
Hypothesis 2 Capacity-building poverty-reduction transfers will increase the local government's per capita spending on public security.
As government agencies and functionaries are on their way to increasing their security and administrative capacity, it will take time to build sufficient information capacity to extract taxes and other fiscal revenues – a crucial aspect of state capacity in the literature (e.g., Levi, Reference Levi1988). As a result, we hypothesize that
Hypothesis 3 Capacity-building poverty-reduction transfers will not immediately increase the government's per capita revenue collection.
When poverty alleviation transfers focus more on the building of administrative and security capacity, these transfers may not have an immediate effect on development and conflict reduction since both objectives demand the presence of capable governing forces. In fact, if the primary objective here is to bolster the government's administrative and security capacity, poverty alleviation can even incite more conflicts – ‘[t]he daily exercise of state power through public expenditures, security policies, and revenue collection’ can end up reinforcing or exacerbating existing ethnic conflicts (Migdal, Reference Migdal2004: 29).
Hypothesis 4 Capacity-building poverty-reduction transfers will not immediately improve rural development.
Hypothesis 5 Capacity-building poverty-reduction transfers will not immediately reduce ethnic violence.
Our findings on ethnic violence can help to discern the nature of the increases in the spending on public security. On the one hand, if we observe more security spending along with an intensification of ethnic violence, then the increases in security spending will serve as a response to the conflicts rather than boosting the local government's control in the province. On the other hand, if the increases in security spending are observed without seeing more incidents of ethnic violence, security spending in this case, perhaps, serves as a preemptive endeavor of the provincial government to facilitate the implementation of assigned infrastructure projects, which is consistent with our argument.
The argument we have proposed here does not necessarily suggest that the local government has to ‘divert’ the poverty alleviation funds for other purposes. Instead, the argument suggests that the government will have the incentives to strengthen its governing capacity to support the execution of the assigned development projects – in the case of Xinjiang, the poverty alleviation program focused on the construction of production facilities. Although it may be tempting to argue that the Chinese government has used various development programs to increase repression in the province (see Becquelin, Reference Becquelin2000), this scenario is unlikely given the data we have or that remain to be verified by future research. In the official records, each poverty alleviation transfer was designated to a specific infrastructure project, and the data of local finances and the payments for poverty alleviation are separately listed in different sources (see Section 4.1). As such, the increases in security spending do not necessarily suggest that the local government was using the poverty alleviation transfers to ‘pay for more repression.’ Our argument is not that poverty alleviation transfers have ‘funded’ the spending for public administrative and security; what we attempt to argue is that transfers for infrastructure construction can encourage more spending on public administrative and security. Relatedly, poverty relief during the period was not ‘windfalls’ as often depicted in the literature (e.g., Gervasoni, Reference Gervasoni2010). The subsidies of interest here were not meant to release provincial officials from their existing revenue-collection responsibilities.
Also, we do not argue that the Chinese government has fully resolved the challenges of weak capacity and political control in Xinjiang through poverty alleviation. The political and socioeconomic implications of the attempts at state building remain to be studied. Our theory instead highlights that infrastructure construction can affect public investment in a way that helps to strengthen the state's administrative presence and security surveillance in unstable areas.
3. Poverty alleviation in Xinjiang
Compared with other provinces, Xinjiang is unique in several ways. For one thing, Xinjiang is entangled in poverty. Despite four decades of market reform, economic development in Xinjiang still lags behind wealthy Han coastal provinces. In 2011, Xinjiang had the lowest disposable income for urban households and ranked among the ninth lowest for disposable income of rural households (ranked 23rd out of 31 provinces).Footnote 4 Recent research has also documented considerable disparity in income and other socioeconomic indicators between the Han and the Uyghurs, the group that accounts for the majority of the total population in Xinjiang (e.g., Bhalla and Luo, Reference Bhalla and Luo2013; Wu and Song, Reference Wu and Song2014).
Meanwhile, Xinjiang has been fraught with conflicts between the Han and ethnic minorities (Bovingdon, Reference Bovingdon2010). The Uyghurs, a Turkic Muslim group, constitute the largest ethnic group in the province.Footnote 5 Between 1980 and 2000, the provincial government of Xinjiang documented one large-scale anti-government armed riot, eight inter-group conflicts, 12 incidents of social disorder, 14 mass protests, and 18 major crimes, including arson, bombings, and the assassinations of Han and Uyghur government officials (Provincial Government of Xinjiang, 2004). Such records are exceptional if one considers that other groups have been relatively compliant and seldom mobilize against Beijing (Dillon, Reference Dillon1999; Kaup, Reference Kaup2000; Han, Reference Han2011).
To address this predicament, Beijing introduced a series of poverty alleviation programs, the earliest of which took place in the 1980s. These programs, covering all poverty-stricken localities with per capita income below the stipulated income line, were not exclusively designed for the province.Footnote 6 However, Xinjiang has constantly been highlighted as a principal target of the central government's poverty relief efforts. As documented by the official documents (Provincial Government of Xinjiang, 2009), Beijing began providing a variety of goods and financial support in the mid-1980s. In 1986, the State Council convened the Leading Group on Economic Development in Impoverished Areas, which Beijing in 1993 turned into the Leading Group of Poverty Alleviation and Development. In the following year, the Leading Group released ‘the 8–7 National Plan for Poverty Reduction’ (hereafter ‘8-7 Plan’), an initiative in which Beijing attempted to relieve the sufferings of 800 million (eight yi in Chinese) poor people within 7 years.
Under the 8–7 Plan, the central government integrated three programs that had existed in Xinjiang in the 1980s: fiscal assistance (caizheng fupin), work-for-relief grants (yigong daizhen), and special loans (fupin daikuan). The fiscal assistance program was administered by the provincial government in Urumqi (the capital city of Xinjiang).Footnote 7 Composed of the Underdeveloped Areas Funds and the New Grants for Economic Production, fiscal assistance supplements regular yearly fiscal transfers to provinces. The work-for-relief grant program was managed by the National Development and Reform Commission (NDRC) in Beijing, formerly the State Planning Commission (SPC), providing a consistent regulatory framework for the allocation and purpose of these grants throughout the country (Zhu et al., Reference Zhu, Lai and Deng2001). Although the SPC and the subsequent NDRC have their own local branches in Urumqi, as delineated by Chow (Reference Chow2011), these two government bodies are, in fact, centralized so that their branches are not accountable to the provincial government but to the SPC and NDRC in Beijing. As a result, the designation of work-for-relief grants is largely under Beijing's control. Finally, the special loans were jointly assigned by Urumqi, Beijing, and the Agricultural Bank of China.
By design, these transfers were delivered to finance the delivery of primary education and the construction of sanitation, electricity supply, transportation, water pumps, industrial plants, and other basic infrastructure (Provincial Government of Xinjiang, 2009). In this paper, we focus on the allocation of fiscal assistance and work-for-relief grants because these two programs were solely under the discretion of provincial and central government. In contrast, special loans involve the consideration of specific distribution formulas and stochastic market trends in the financial sector. Also, we will examine the allocation of poverty-reduction aid between 1994 and 2000 because the data for the 8–7 National Plan are relatively complete.Footnote 8 Finally, our analysis excludes all municipalities governed by the Xinjiang Production and Construction Corps (XPCC). XPCC is a unique para-military economic organization that can be traced back to the People's Liberation Army troops that Beijing dispatched to take over the province after the Civil War (Wei, Reference Wei2011).
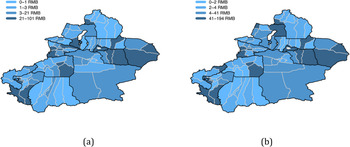
The campaign of poverty alleviation and development has by no means treated all counties in the province equally. As shown in Figure 1, the average amount of transfers varies sharply across Xinjiang, which thus warrants additional explanation and analysis in the following sections. Moreover, note that these two programs, which were managed by different government agents, more or less concentrated on a similar group of counties. At glance, it appears that fiscal assistance and work-for-relief complement rather than substitute each other.Footnote 9
Fiscal assistance and work-for-relief grants across all counties in Xinjiang during the 8–7 National Plan: (a) fiscal assistance and (b) work-for-relief grants.

4. Empirical strategy
4.1 Data and variables
We analyze a unique dataset that includes various fiscal, political, demographic, and economic variables for all counties in Xinjiang between 1994 and 2000. The data are collected from various sources, such as the Xinjiang Yearbook, the Xinjiang Statistical Yearbook, and the Xinjiang Gazetteers. Additional fiscal data are taken from the Fiscal Statistics of Provinces, Municipalities, and Counties in China. The unit of analysis is county-year. As the lowest level of government administration in China, the county is the level of government administration where the Chinese government implemented the 8–7 Plan. Table A1 in the Appendix provides the summary statistics of our variables.
4.1.1 Poverty-alleviation transfers
The main explanatory variables are the per capita payments of two types of relief transfers (yuan/person): fiscal assistance and work-for-relief grants. Both variables are logged given their skewed distributions.Footnote 10 As mentioned earlier, under the 8–7 Program, fiscal assistance was largely at the discretion of the provincial government in Urumqi whereas the central government in Beijing mainly managed the work-for-relief grants. Studying these two programs separately will allow us to examine whether these two levels of government jurisdictions had similar or different distributive imperatives when they allocated poverty-relief transfers in Xinjiang.
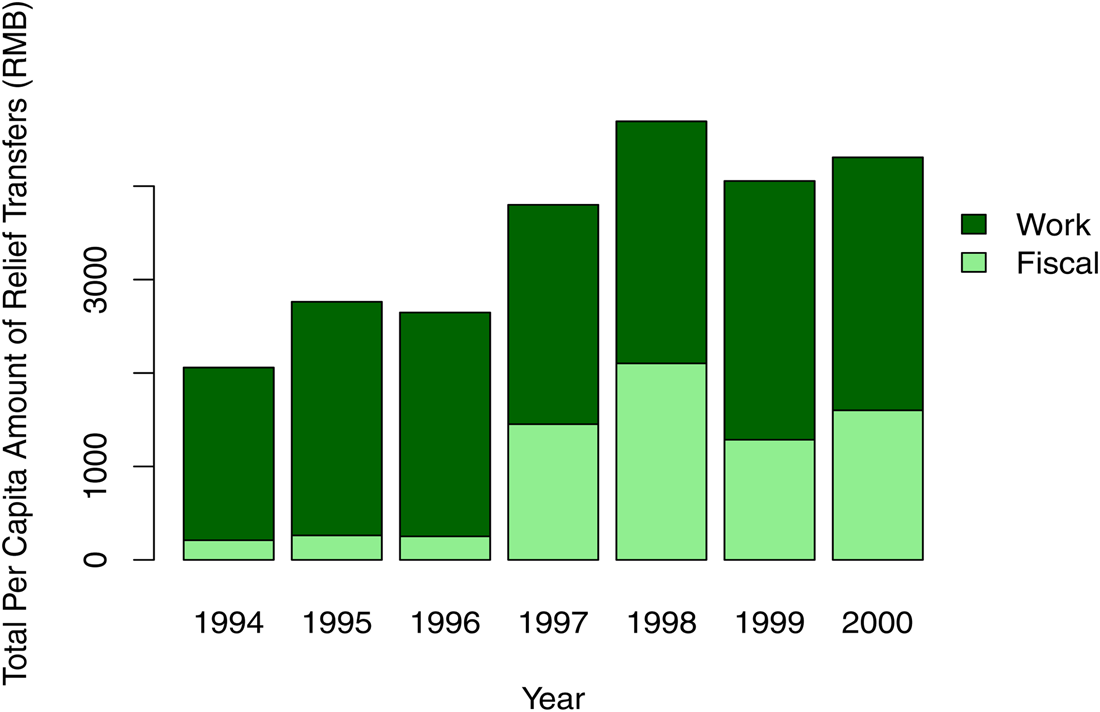
Figure 2 shows the relative size of these two programs during the 8–7 Plan. Although the total amount of poverty alleviation transfers grew significantly over time, work-for-relief grants accounted for a larger share of these transfers. However, per capita fiscal assistance grew dramatically between 1994 and 2001.
Fiscal assistance and work-for-relief grants during the 8–7 National Plan.

4.1.2 Capacity-related government spending
The primary outcomes of interest are three measures that can capture the government's efforts at state building from local government's spending data. First, we use the rate of change in per capita local fiscal revenues to indicate local government's capacity to collect resources.Footnote 11 Next, we use the rates of change in per capita government spending on public security and administrative management, respectively, to measure the attempt to increase the security and administrative capacity of local government.Footnote 12
4.1.3 Rural development
In line with existing studies that investigate the effectiveness of Chinese poverty alleviation campaigns (e.g., Park et al., Reference Park, Wang and Wu2002; Meng, Reference Meng2013), we use the change in per capita agricultural production as the outcome variable in order to estimate the welfare effect of poverty-alleviation transfers. Including the change in per capita agricultural production as one of the outcome variables allows us to compare the impact of the 8–7 Program over different capacity- and welfare-related outcomes. If the 8–7 Plan focused more on capacity building as hypothesized, the allocated transfers should have a smaller or even insignificant effect on the growth of the rural economy.
4.1.4 Ethnic violence
We include a binary indicator that takes the value of 1 if a county had at least one incident of ethnic violence in the previous year. The violence data are provided by Bovingdon (Reference Bovingdon2010) and Cao et al. (Reference Cao, Duan, Liu, Piazza and Wei2018). In line with Cao et al. (Reference Cao, Duan, Liu, Piazza and Wei2018), we use this variable to indicate the presence of any ethnically related political instability in a county, such as terrorism, insurgency, riots, assassinations, and violent street protests.
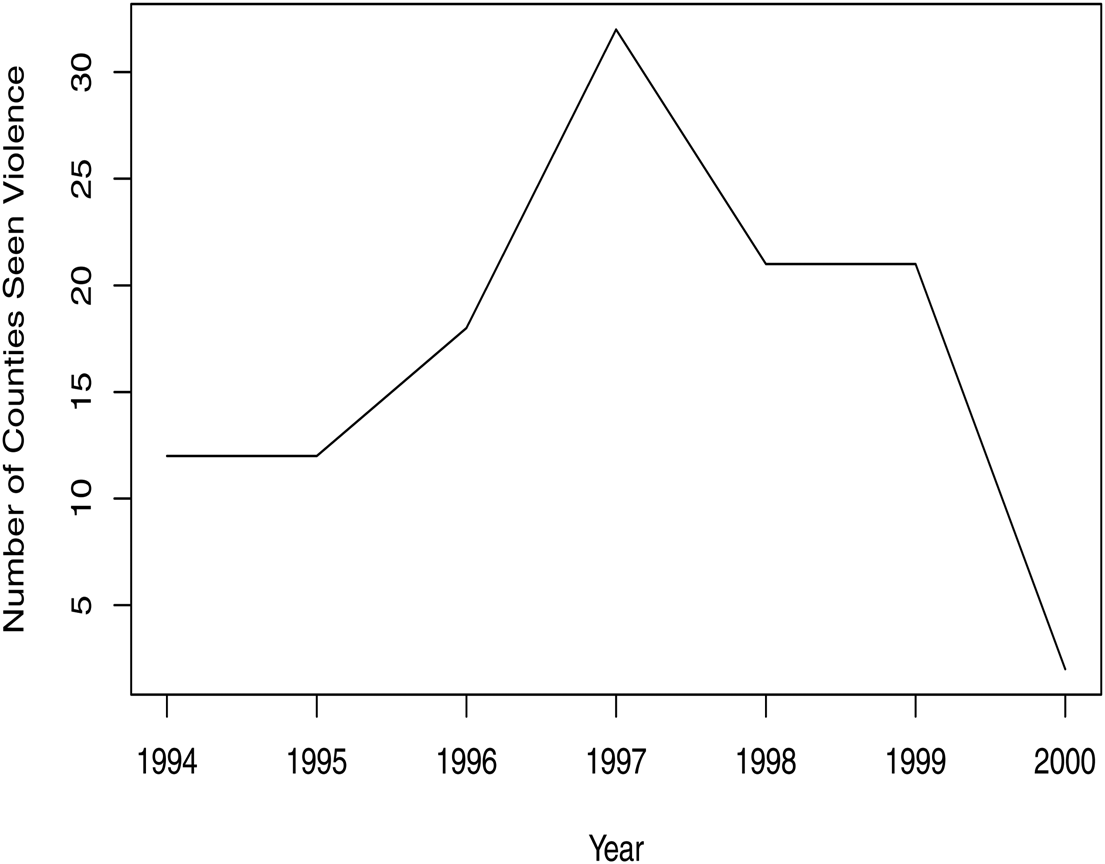
As suggested by Han and Paik (Reference Han and Paik2014), using an indicator is more appropriate than using the frequencies because counting the actual number of incidents is often difficult or impossible. Figure 3 shows the number of counties that witnessed the occurrence of ethnic violence between 1994 and 2000. Notably, nearly a third of counties in Xinjiang were afflicted by ethnic violence.
Number of counties with ethnic violence between 1994 and 2000.

4.1.5 Other variables
We include the following economic and demographic confounders. First, we control for the log of each county's lagged GDP per capita (yuan/person). If poverty alleviation aims at economic equalization, the Center and the provincial government should concentrate transfers on areas with relatively low average income.
Beijing and Urumqi can focus on counties where county governments are incapable of collecting adequate revenues in their respective jurisdictions. Therefore, we include fiscal dependence, defined as the share of fiscal subsidies allocated through other channels in each county's total revenues. If poverty alleviation focuses on supporting fiscally weak local governments, the degree of fiscal dependence will be positively correlated with observed transfers. Finally, we include each county's economic growth rate because the allocation of the relief payments can be based on the principle of economic productivity and thus continuously focus on growing counties. In our analysis, all economic variables are lagged by 1 year.
We also control for the proportion of Uyghur population in each county. Since the 1980s, the Uyghurs have been involved in many incidents of ethnic violence in the province. As the government highlighted ‘ethnic minority areas’ as a key target for poverty alleviation (Park et al., Reference Park, Wang and Wu2002), poverty-relief transfers may be positively correlated with the relative size of the Uyghur population in each county.Footnote 13 In addition, we include population density in each county. Considering the prevalence of ‘urban bias’ in China and other developing countries (e.g., Wallace, Reference Wallace2013), densely populated localities may receive more transfers when other things are held constant.Footnote 14
4.2 Identification strategy
Given the concerns of reverse causality and selection bias, the conventional approach to regress the outcome variables on transfers and other variables may yield estimates that say little about the causal effect of poverty alleviation. Recent research has adopted rigorous causal identification strategies to estimate the effect of poverty alleviation programs. Meng (Reference Meng2013) and Lü (Reference Lü2015) both employ a fuzzy regression discontinuity (FRD) design. Treating the 1992 average rural income as the forcing variable, both studies claim that the FRD design provides a quasi-experiment setting since the assignment of treatment status on either side of the cutoff along the forcing variable can be treated as if random. The FRD design relies on the assumption that the poverty line (RMB 400) specified by the central government will increase the probability that a county would be designated as a National Poverty County (NPC) under the 8–7 Plan, the treatment status of interest.Footnote 15 With the FRD design, the poverty line based on the 1992 rural average income can be used as the instrumental variable for NPC status to estimate the effect of poverty alleviation in the full sample or in a subsample that only includes observations within a given bandwidth around the income cut-off point.
Although the FRD design is compelling, we argue that it is not a useful identification strategy in the context of Xinjiang for several reasons. First, both studies use the 1992 rural per capita income with RMB 400, the nationwide poverty line defined by Beijing, to create the discontinuity design such that being under RMB 400 increases a county's probability of being selected as an NPC.Footnote 16 However, in Xinjiang, where Beijing named 25 NPCs in 1994, only two counties had rural average income below RMB 400.Footnote 17 Given the unique political situation in Xinjiang, it is very likely that Beijing used different and additional economic and political criteria to determine the NPC status in the province (Park et al., Reference Park, Wang and Wu2002). Second, both studies create a binary indicator of NPC as the treatment when estimating the effect of the 8–7 Plan. Doing so can conceal important information as there remains considerable variation regarding the actual amount of payments across designated NPCs. In fact, as explained by the Provincial Government of Xinjiang (2009), the 8–7 Plan also intentionally included non-NPC counties, making NPC status a less accurate treatment status for the province.
We employ the recently developed CBPS to estimate the causal effects of poverty alleviation on state capacity, rural development, and ethnic violence in Xinjiang. The CBPS, similar to other propensity score estimation techniques, follows the strategy of ‘selection on the observables’ (SOO) to identify causal effect from observational data. SOO posits that one can identify, at least partially, the effect if observations in the sample are nearly identical based on observed pre-treatment covariates. The observations only differ regarding the status of treatment assignment. With the assumption that no additional unobserved confounders exist, whether a unit receives the treatment or not can then be presumed to be ‘as if random’ within a stratum of observed pre-treatment covariates. In practice, the SOO strategy uses observed covariates to construct counterfactuals against the treated units to identify the effect (Sekhon, Reference Sekhon2009). A common estimation technique based on the SOO strategy is matching, through which researchers use observable variables to ‘pair’ most similar observations, between which the assignment of treatment can be reasonably assumed ‘as if’ random. One can also carry out matching or weighting by using observed covariates to estimate treatment assignment, namely the ‘propensity score,’ for each unit and apply the derived scores or weights to adjust the observed confounded imbalances between the treated and control units. In addition to propensity score, the SOO assumption also leads to the adoption of IPTW) to reconstruct the condition under which the treatment is independent of pre-treatment covariates (Robins et al., Reference Robins, Hernan and Brumback2000).
However, the standard matching and propensity score approaches only allow binary treatment status. The parametric estimation of propensity score can also be biased if the model is not correctly specified. The CBPS explicitly addresses these two challenges. Although the CBPS achieves covariate balance and treatment prediction at the same time (Imai and Ratkovic, Reference Imai and Ratkovic2014), recent progress on CBPS provides a non-parametric estimation of IPTWs, making model misspecification a less severe concern. More crucially, the extended CBPS generalizes the treatment regime to accommodate non-binary and continuous treatments (Fong et al., Reference Fong, Hazlett and Imai2018). The new CBPS is thus more appropriate for current purposes, given that poverty-reduction transfers, the primary treatment of interest, are continuous variables. The conventional FRD estimation is problematic in this case as it creates extremely few cases under the discontinuity of the forcing variable under the stipulated threshold for effect identification.
In sum, we prefer CBPS over FRD design. The implementation of CBPS analysis begins with the estimation of CBPS weights. The estimation is carried out by regressing the treatment variables, namely the per capita amount of fiscal assistance or work-for-relief grants, on observed pre-treatment covariates, including the log of lagged GDP per capita, lagged fiscal dependence, lagged economic growth rate, the proportion of Uyghur population, and population density (log) in county i and year t − 1.Footnote 18 The derived CBPS weights will then be applied in the conventional ordinary least squares (OLS) analysis to estimate the effects of poverty-alleviation transfers. We regress the outcome variables on both treatments (i.e., per capita fiscal assistance and work-for-relief grants), controlling for all observed covariates X:

where y refers to the outcome variable at county i in year t. The coefficient β indicates the estimated treatment effects of poverty alleviation transfers. X represents the matrix of pre-treatment covariates whereas γ is the vector of their corresponding coefficients. We cluster the standard errors by county to account for within-county correlation of errors over time.Footnote 19
4.3 Main results
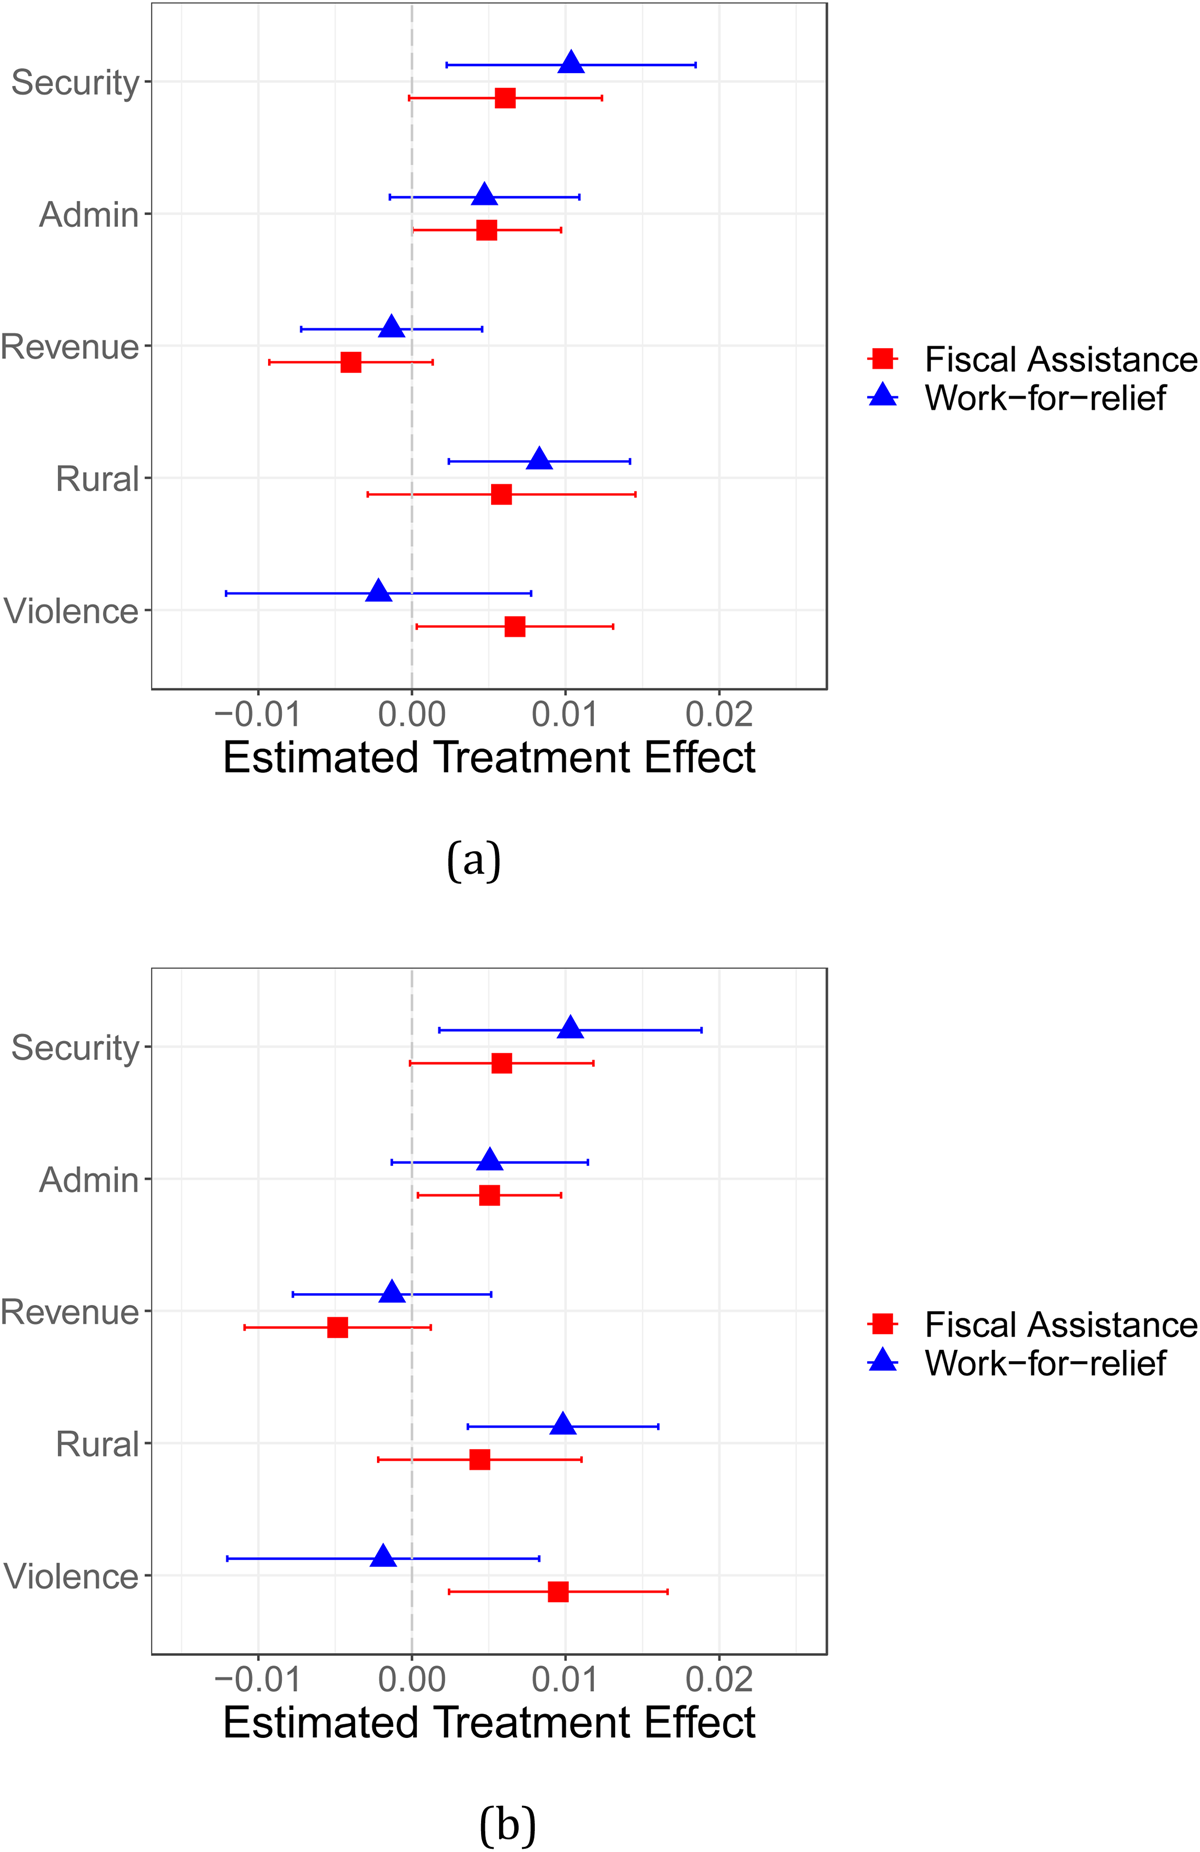
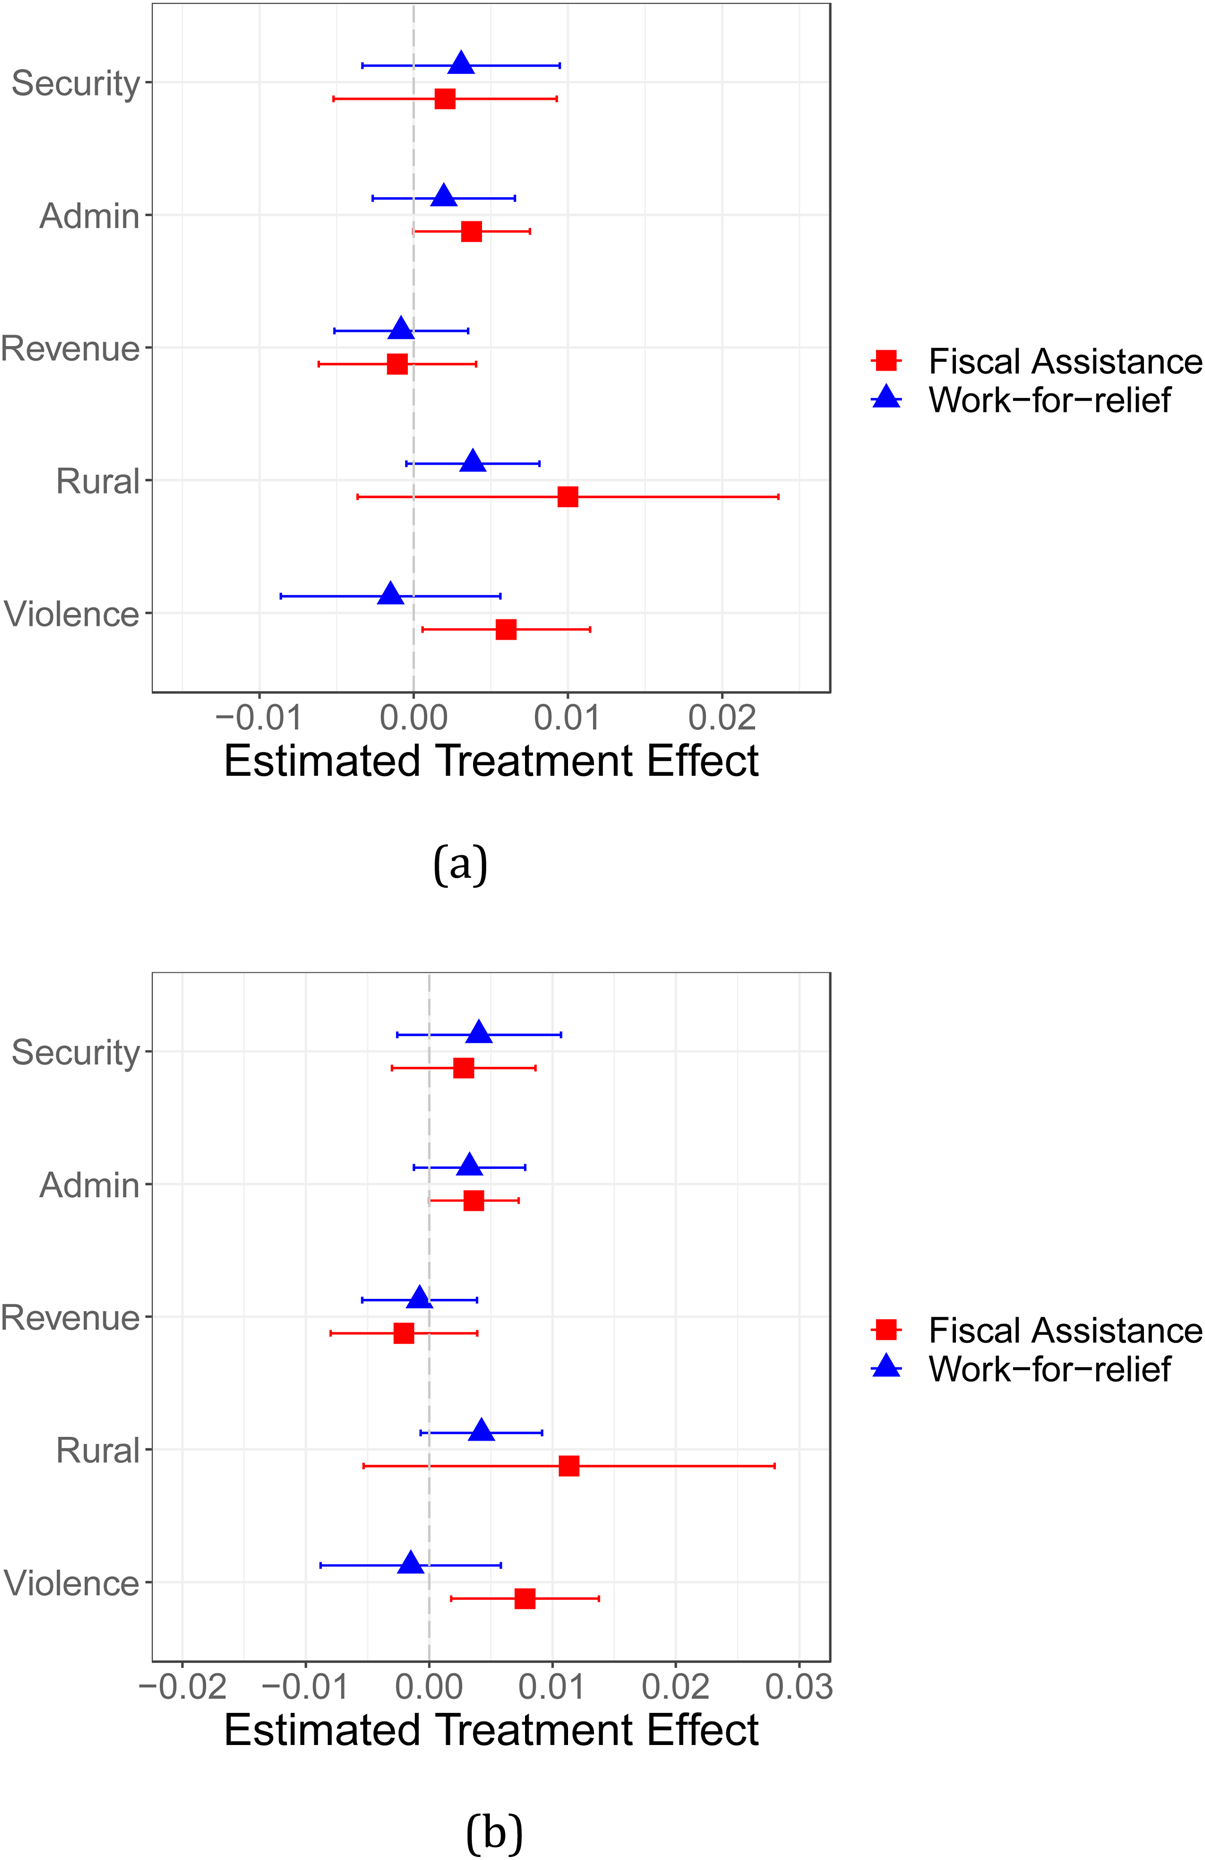
Figure 4 presents the estimated treatment effects of fiscal assistance and work-for-relief grants with 95% confidence intervals.Footnote 20 We carry out the analysis with and without 1-year lagged-dependent variables to capture the unobserved trend in the dependent variables over time. As shown in Figure 4, the results are similar, although including lagged-dependent variables slightly improves the efficiency of estimation.
Estimated effects of poverty-alleviation transfers. The error bars show 95% confidence intervals: (a) without lagged dependent variables (DVs) and (b) with lagged DVs.

The first two outcomes concern the effect of poverty alleviation transfers on the government's security and administrative capacity. To begin, both poverty alleviation payments have a positive effect on the rate of change in per capita spending on public security. The point estimates are consistently statistically significant with and without the lagged-dependent variable. In contrast, with 95% confidence intervals, the effects of poverty alleviation on per capita spending on administrative management are only statistically significant when the treatment is per capita fiscal assistance. Altogether, the transfers under the 8–7 Plan appear to boost local government's capacity on public security and, to a lesser degree, administrative management. Given that per capita fiscal assistance and work-for-relief grants grew by seven times and by 50%, respectively, before and after the 8–7 Plan, the estimated coefficients suggest that fiscal assistance and work-for-relief transfers, respectively, accounted for about 10 and 15% of the increases in per capita security and administrative spendings.
Next, neither poverty-alleviation program has a conclusive effect on the rate of change in per capita local fiscal revenue. For both treatments, the estimated effects are not statistically different from zero. This result is consistent with the ‘building capacity’ hypothesis – as government agencies and functionaries build up their ruling capacity at the grassroots level, there can be a time lapse before they can fully take control of the local tax base for resource extraction.
Finally, although poverty alleviation appears to have positive effects on building the government's security and administrative capacity, its impact on rural development and conflict reduction is mixed or even negative. First, although the estimated effect on the rate of change in per capita agricultural production is always positive, the estimated effect becomes statistically different from zero only in the case of work-for-relief grants. The two programs demonstrate opposite effects on the prevention of ethnic conflicts. On the one hand, the work-for-relief grants seem to undermine it (although the effect is not statistically significant); on the other hand, fiscal assistance appears to intensify ethnic violence.Footnote 21
To illustrate, several policy campaigns that took place at the same time as the 8–7 Plan indeed align with our quantitative findings. As documented by the yearbooks of Xinjiang, first, we found that the provincial government was involved in a series of campaigns to increase its presence at the grassroots level, particularly by establishing a large number of service points of civil affairs across the province. The official attempts of community building started with Urumqi and were later expanded to other prefectures such as Aksu, Bortala, Ili, and Kashgar toward the end of the 8–7 Plan. During the same period, the public security bureau of Xinjiang also carried out various endeavors to strengthen the government's control of the population in the province. More specifically, these endeavors aimed to boost the provincial government's surveillance over household registration (especially in the countryside), as well as the issuing of identity documents.
4.4 Counterarguments and robustness checks
We carry out several additional tests to evaluate the robustness of the main findings and address rival arguments. All results are available in the Appendix.
One may contend that poverty alleviation transfers may merely increase the government's overall spending instead of boosting security and administrative capacity. We have conducted another analysis with non-capacity government spending as the outcome variable and find that neither relief payment has a statistically significant effect on government spending on categories unrelated to administrative management and public security (Table A9). The results also suggest, although one may contend that our outcome variables represent patronage (Ang, Reference Ang2016), the spending for other categories that might be used for patronage (e.g., fixed asset construction) seems unaffected. Similarly, one may argue that poverty alleviation is only a part of Beijing's financial support in Xinjiang. As a result, the effects of relief transfers are trivial. We conduct another test to estimate the effects of per capita non-relief intergovernmental transfers and find that they do not have any notable impact on the main outcome variables (Table A10). We have also conducted a separate analysis to observe whether poverty alleviation transfers, to facilitate local state-building, have impacted telecommunication within Xinjiang. As shown in Table A11, we do not find any statistically significant results. The results, however, are not surprising given that, during the 8–7 Plan, poverty alleviation in the province primarily focused on the construction of agricultural production facilities. We have also estimated whether the 8–7 Plan had any impact on the growth of GDP per capita, which does not yield consistently significant results (Table A12) – that said, in the case of work-for-relief transfers, poverty alleviation appears to have a negative impact. One may argue that poverty alleviation in Xinjiang meant to create government jobs for the Han Chinese even though these transfers were for designated infrastructure projects. We have carried out two tests to examine whether the 8–7 Program had any impact on the size of the Han population, as well as the size of the fiscally dependent population, which includes local officials. We do not find any statistically significant results (see Tables A13 and A14). Although these two dependent variables may not rule out the possible changes in the presence of Han officials in Xinjiang brought by poverty alleviation transfers, we believe that increasing the presence of the Chinese Han in the government is still consistent with our argument. That is, poverty alleviation in Xinjiang has largely strengthened the control of the Han-dominated Chinese state.
Finally, we have also conducted an additional test based on a longer panel dataset that includes all variables until 2004. The findings shown in Figure 5 are very similar to the main findings – the only notable exception is that the estimated effects on the growth of per capita security spending are no longer statistically significant, although they remain positive as hypothesized. The exception here, however, should be received with caution as it is important to point out that the Chinese government changed the way spending on public security was recorded during the 2000–2001 fiscal year.
Estimated effects of poverty-alleviation transfers, 1994–2004. The error bars show 95% confidence intervals: (a) without lagged DVs and (b) with lagged DVs.

4.5 Alternative identification
We conduct an alternative analysis with all variables being first-differenced to address model endogeneity, as suggested by Berman et al. (Reference Berman, Shapiro and Felter2011) (Section A3 in the Appendix). Meanwhile, we aggregate our observations by county and instrument the treatment with per capita relief between 1990 and 1993. Here, we assume that the 8–7 Plan mostly reorganized and continued the previous campaign of poverty alleviation in the late 1980s and early 1990s rather than targeting a different set of localities, an assumption that is plausible based on our review above. The results still support our main hypotheses. We find that changes in poverty alleviation transfers, especially work-for-relief grants, are positively correlated with changes in per capita security spending. The estimations of instrumental variable suggest that poverty relief under 8–7 only had a significantly positive effect on per capita spending on public security and government administration (Section A4 in the Appendix).
In sum, the empirical results align more closely with the proposed ‘building capacity’ hypothesis of poverty reduction. We find that poverty alleviation under the 8–7 Plan in Xinjiang appears to focus more on strengthening the government's ruling capacity to maintain security and order with the presence of public administration.
5. Increases in central command over provincial transfers
The results above suggest that poverty alleviation under the 8–7 Plan mainly focused on strengthening the security and administrative capacity of local governments in Xinjiang. One may still wonder how the presence of more capable local governments contributes to the central government's control.
We conduct an OLS test to study the relationship between fiscal assistance and work-for-relief grants. In the following analysis, Concurrent aid is the key explanatory variable.Footnote 22 The estimated coefficients, if positive, will imply that these two programs ‘reinforce’ each other. In contrast, a negative coefficient will indicate these two programs ‘substitute’ for each other, as a locality will receive less support from one program if it receives more from the other program. In addition to Concurrent aid, we control for lagged GDP per capita (log), lagged fiscal dependence, lagged economic growth rate, a binary indicator of previous ethnic violence, the proportion of Uyghur population, and population density:

where i and t refer to individual county and year, respectively. The matrix X denotes the control variables; γ is the vector of their corresponding coefficients. The model also includes county-(κ) and year-fixed effects (τ) to account for the additional unobserved location-specific and time-invariant factors. We cluster the standard errors by county to account for within-county correlation of errors over time. The main coefficient of interest is β.
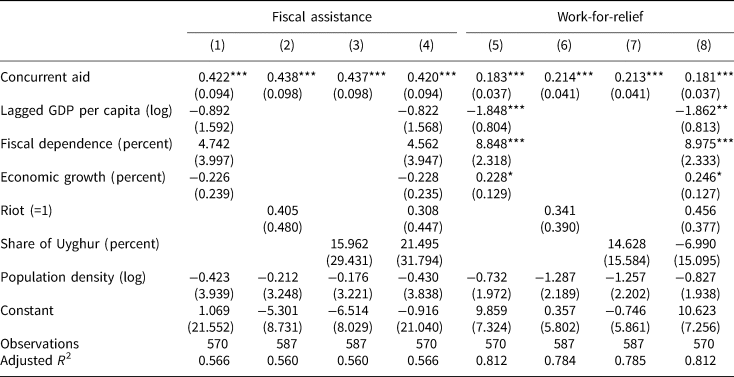
Table 1 presents the results. The Concurrent aid coefficients for fiscal assistance and work-for-relief grants are all statistically significant and positive. However, although the positive correlation between the two programs suggests some degree of mutual reinforcement between the central and provincial governments, the size of coefficients is smaller in the case of work-for-relief grants. Using the coefficients from the full model (models 4 and 8), a 1% increase in work-for-relief grants, on average, corresponds to a 0.4% increase in fiscal assistance, whereas a 1% increase in fiscal assistance only corresponds to a 0.2% increase in work-for-relief grants. Therefore, work-for-relief grants, compared with fiscal assistance, seem less complementary. Moreover, the estimated coefficients from models 1 to 4 reveal that fiscal assistance, after taking into account possible explanatory factors, is only correlated with the work-for-relief grants allocated by the central government in Beijing.
Correlation between the two poverty alleviation programs

All models include county and year fixed effects with robust-cluster standard errors by county.
Note: *P < 0.1; **P < 0.05; ***P < 0.01.
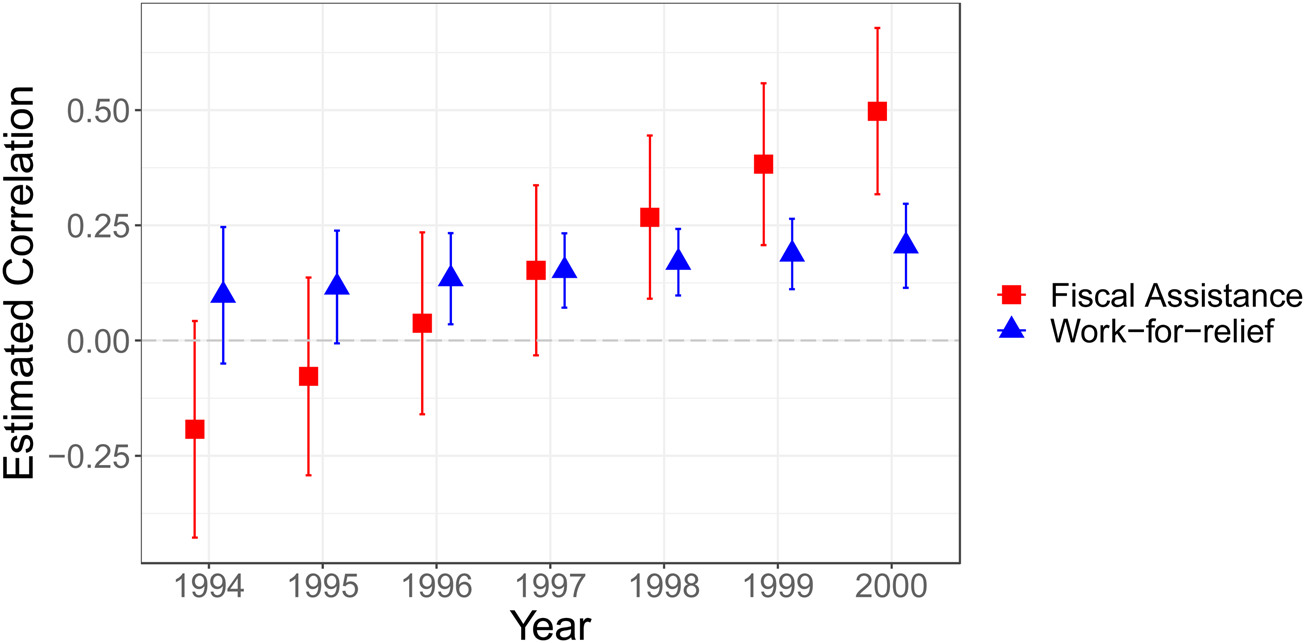
We then study how the correlation between the two programs evolved over time. We run the tests that let the Concurrent aid coefficients vary by year. As shown in Figure 6, at the beginning the estimate is negative for fiscal assistance, which suggests that Urumqi mostly allocated fiscal assistance to localities that were not covered by work-for-relief grants. Put differently, fiscal assistance started as a substitute for work-for-relief grants, although it appears that work-for-relief grants also attempted to complement fiscal assistance. After 1997, however, the two programs became clearly positively correlated, suggesting that they began to complement each other. Interestingly, this change is consistent with the observation that poverty alleviation in Xinjiang during the 8–7 Plan grew primarily under Beijing's command. In 1997, the NDRC in Beijing began to participate in the management of fiscal assistance (Meng, Reference Meng2000). This change coincided with the year in which the central government convened a Politburo Standing Committee meeting, which demanded the central government's more active command over poverty alleviation in Xinjiang (Tong, Reference Tong2010). As the central government commanded the distributive allocations of poverty relief transfers, empowering the local state seems to, accordingly, have increased the central state's ruling capacity in Xinjiang through infrastructure-oriented transfers.
Correlation between the two poverty alleviation programs (by year). The error bars represent 95% confidence intervals.

6. Conclusion
This paper presents a systematic analysis of poverty alleviation transfers in Xinjiang during the 8–7 National Plan. Consistent with the hypotheses, we find that the relief payments have encouraged the local government to increase its spending, which facilitated the implementation of the assigned projects and increased political control in the long run. More specifically, the 8–7 National Plan appears to have the most salient impact on boosting the government's security and administrative capacity through the construction of public infrastructure. As we examine how poverty alleviation leads to the enlargement of local state apparatus as part of broad state-building endeavors, our results align with recent reflections on the ‘hearts and minds’ strategy as a means of conflict reduction (e.g., Hazelton, Reference Hazelton2017).
In a broad vein, our findings reinforce the importance of the distinction between different types of government goods and services. Although much of the literature has focused on how particularistic anti-poverty payments can increase political elites' chance of political survival by improving beneficiaries' material well-being, we show that intergovernmental transfers that the government allocates to mitigate poverty through infrastructure construction can focus more on building the government's ruling capacity at the grassroots level. Recent studies on both democratic and non-democratic countries have discussed the difference between public patronage and more individual-oriented transfers, which can be present in specific contexts and yield different implications for political survival. These distinctions are crucial for those interested in authoritarian governance – further research is needed to understand the political and socioeconomic implications of an increasingly stronger administrative and security state. Will greater state capacity necessarily lead to better government service delivery and revenue collection, which can contribute to authoritarian durability without much use of repression? If yes, how long will it take?
Furthermore, our findings suggest the need to distinguish different types of outcomes. Although the literature highlights that selective delivery of government goods and services contributes to political survival by improving well-being of recipients, we argue and demonstrate that these distributive allocations may also help to sustain political power by inducing the building of state capacity. To fully evaluate the effect of public goods and service provision, it is crucial to separate and take account of capacity- and welfare-related outcomes. In the case of Xinjiang, to construct the assigned production facilities, the county governments allocated additional funds to strengthen their administrative and security capacity, which in turn strengthened political control in the long run.
One can extend the current project to other ethnic autonomous regions, as well as other provinces, to see whether the same pattern seen in Xinjiang travels or not. The Chinese government may be preoccupied with redistribution between rich and poor areas in more stable but similarly poverty-stricken provinces. Local officials who seek to maximize their career prospects by achieving economic prosperity may also highlight economic efficiency by focusing on fast growing localities governed by their upper-level allies when allocating fiscal transfers (e.g., Jiang, Reference Jiang2018). The statistical results in this paper can be complemented by qualitative evidence to capture additional insights. For instance, if the objectives of resource allocation indeed vary between different levels of local jurisdictions, it will be enlightening to interview any government official who has personally experienced alternative distributive imperatives when serving in other provinces.
Supplementary material
The supplementary material for this article can be found at https://dataverse.harvard.edu/dataset.xhtml?persistentId=doi%3A10.7910%2FDVN%2FGAWWYW.
Acknowledgements
The author is grateful to Jesse Acevedo, Randall Akee, Ruth Carlitz, Jim DeNardo, Barbara Geddes, Miriam Golden, Chad Hazlett, Jean Hong, Yue Hou, Franziska Barbara Keller, Jeff Lewis, Tao Lin, Paasha Mahdavi, Yuree Noh, Lauren Peritz, Mike Thies, Risa Toha, Dan Posner, Dan Treisman, Feng Yang, and Jing Vivian Zhan for their constructive feedback on different parts of this project. James Tong, who passed away in 2020, read my first draft of this paper and offered many valuable suggestions. The participants of the UCLA Comparative Politics Reading Group, the Graduate Seminar on China (GSOC) at the Chinese University of Hong Kong, the Midwest Political Science Association Annual Conference, the Fudan-UC Young Scholar Workshop, and the American Political Science Association offered helpful comments. The author also thanks the editor and three anonymous reviewers for their careful reading of this manuscript and their insightful comments. The Universities Service Centre (USC) at the Chinese University of Hong Kong, the Harvard-Yenching Library and the Fairbank Center for Chinese Studies at Harvard University, and the Yale University Library provided generous financial and research support. Xun Cao and his collaborators kindly shared the ethnic violence data.