Introduction
Underweight and overweight – referred to as the ‘dual or double burden of nutritional status’ at population level in this study – are now recognized as a global epidemic. Although underweight people are more susceptible to various infectious diseases, non-communicable diseases (NCDs) caused by overweight and obesity are faster growing public health concerns because of their significant and adverse health and socioeconomic consequences. Rapid urbanization, industrialization and socioeconomic development have significantly changed lifestyles, and thereby dietary patterns, among many people in developing countries. As a result, the nutritional transition is placing people in many countries under the double burden of malnutrition – undernutrition on the one side and overnutrition on the other.
The co-existence of overweight and obesity at population level is now a common phenomenon in most developing countries, including Bangladesh (Khan & Kraemer, Reference Khan and Kraemer2009; Little et al., 2016; Tanwi et al., Reference Tanwi, Chakrabarty and Hasanuzzaman2019; Hashan et al., Reference Hashan, Gupta, Day and Kibria2020a). Successive studies conducted among Bangladeshi women have suggested that the prevalence of overweight and obesity is on an upward trend and that of underweight is gradually decreasing (Khan & Kraemer, Reference Khan and Kraemer2009; Kamal et al., Reference Kamal, Hassan and Alam2015; Sarma et al., Reference Sarma, Saquib and Hasan2016; Hoque et al., Reference Hoque, Hasan, Rahman, Long and Mamun2017; Biswas et al., Reference Biswas, Garnett, Pervin and Rawal2017; Tanwi et al., Reference Tanwi, Chakrabarty and Hasanuzzaman2019; Hashan et al., Reference Hashan, Gupta, Day and Kibria2020a). Furthermore, similar to in India (Gouda & Prusty, Reference Gouda and Prusty2014), the proportion of overweight and obesity is higher in adult females than their male counterparts in Bangladesh (Khan & Kraemer, Reference Khan and Kraemer2009; Biswas et al., Reference Biswas, Garnett, Pervin and Rawal2017).
A landmark review of the literature has suggested that although obesity and overweight are mainly attributed to heterogeneity of socioeconomic status, the direction of the relationship is not consistent across countries (Wang & Beydoun, Reference Wang and Beydoun2007; Corsi et al., Reference Corsi, Kyu and Subramanian2011). Although some studies have found that a more affluent socioeconomic status is associated with a higher risk of being overweight and obese (Moore et al., Reference Moore, Hall, Harper and Lynch2010; Subramanian et al., Reference Subramanian, Perkins, Ozaltin and Davey-Smith2011; Biswas et al., Reference Biswas, Garnett, Pervin and Rawal2017), others have suggested that the risk of being overweight and obese is associated with less-affluent socioeconomic status (Dinsa et al., Reference Dinsa, Goryakin, Fumagalli and Suhrcke2012; Ahmed et al., Reference Ahmed, Rwabilimbo, Abrha, Page, Arora and Tadese2020). A review of the literature suggests that, among others, respondent’s age, sex, marital status, education, parity, household size and living environment are important determinants of underweight, overweight and obesity status (Khan & Kraemer, Reference Khan and Kraemer2009; Hanandita & Tampubolon, Reference Hanandita and Tampubolon2015; Kamal et al., Reference Kamal, Hassan and Alam2015; Sarma et al., Reference Sarma, Saquib and Hasan2016; Bishwajit, Reference Bishwajit2017; Hoque et al., Reference Hoque, Hasan, Rahman, Long and Mamun2017; Biswas et al., Reference Biswas, Garnett, Pervin and Rawal2017; Rahman et al., Reference Rahman, Rahman, Rahman and Jesmin2019; Hashan et al., Reference Hashan, Rabbi, Haider and Gupta2020b; Ahmed et al., Reference Ahmed, Rwabilimbo, Abrha, Page, Arora and Tadese2020; Shrestha et al., Reference Shrestha, Mishra, Ghimire, Gyawali, Pradhan and Schwarz2020; Yeshaw et al., Reference Yeshaw, Kebede, Liyew, Tesema, Agegnehu, Teshale and Alem2020).
Studies of the prevalence and socioeconomic correlates of underweight, overweight and obesity in women in Bangladesh have mostly been based on Bangladesh Demography and Health Survey (BDHS) data sets (see e.g. Khan & Kraemer, Reference Khan and Kraemer2009; Kamal et al., Reference Kamal, Hassan and Alam2015; Sarma et al., Reference Sarma, Saquib and Hasan2016; Bishwajit, Reference Bishwajit2017; Hoque et al., Reference Hoque, Hasan, Rahman, Long and Mamun2017; Biswas et al., Reference Biswas, Garnett, Pervin and Rawal2017; Rahman et al., Reference Rahman, Rahman, Rahman and Jesmin2019; Hashan et al., Reference Hashan, Rabbi, Haider and Gupta2020b). The analytical techniques used in these studies have been either simple linear regression or simple multinomial logistic regression analysis. However, these have largely failed to capture community-level effects on the nutritional status of women. Using the same DHS data sets, many studies conducted in developing countries have found significant community-level effects of being underweight and overweight or obese (Hanandita & Tampubolon, Reference Hanandita and Tampubolon2015; Ahmed et al., Reference Ahmed, Rwabilimbo, Abrha, Page, Arora and Tadese2020; Shrestha et al., Reference Shrestha, Mishra, Ghimire, Gyawali, Pradhan and Schwarz2020; Yeshaw et al., Reference Yeshaw, Kebede, Liyew, Tesema, Agegnehu, Teshale and Alem2020). The present study aimed to examine the prevalence and individual- and community-level risk factors for being underweight and overweight or obese compared with having a normal body mass index (BMI) among ever-married non-pregnant women aged 15–49 years in Bangladesh.
Methods
Data
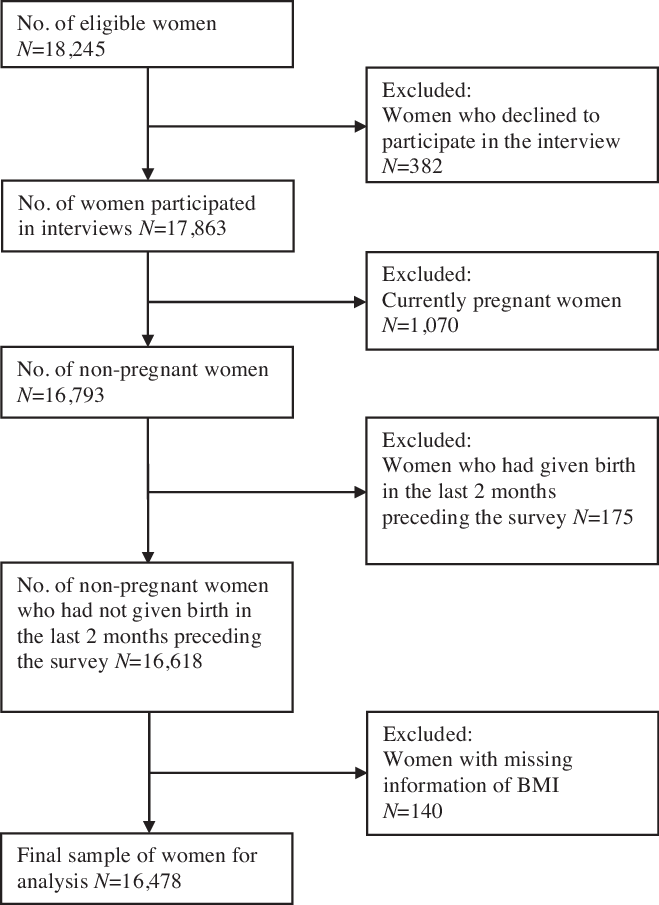
The data used in this study were obtained from the latest round of the BDHS conducted in 2014. The survey was conducted by the National Institute of Population, Research and Training (NIPORT) under the Ministry of Family Planning and Welfare, Government of Bangladesh. Initially 18,245 women were found married and were aged 15–49 years, hence they were deemed eligible for interview in the 2014 BDHS. Finally, 17,863 women were successfully interviewed from 17,300 households using a two-stage cluster sampling procedure with an overall response rate of 98%. In the first stage, 600 primary sampling units (PSUs), i.e. clusters, were selected with probability proportional to the PSU size from 207 PSUs in urban areas and 393 PSUs from rural areas. As in previous studies, each cluster was considered as a community (Hanandita & Tampubolon, Reference Hanandita and Tampubolon2015). The survey gathered information on various issues, including fertility, contraceptive use, maternal and child health care, nutritional status of mother and child and socio-demographic characteristic. Details of the sampling design, including the sampling frame and sample implementations, are provided in the survey report (NIPORT et al., 2016). Women who were pregnant at the time of the survey and those who had given birth during the last 2 months preceding the survey date were excluded from the analyses. After exclusion of respondents with missing information, a total of 16,478 ever-married non-pregnant women aged 15–49 years were finally selected for analysis in this study. The sampling procedure is summarized in Figure 1.
Flow chart of selection procedure of sample women from the 2014 BDHS. Source: author’s calculation based on BDHS 2014 data.

Outcome variables
The outcome variables were underweight, overweight and obesity. The 2014 BDHS weighed all ever-married women aged 15–49 years using a solar-powered scale with an accuracy of ±100 g. The women’s heights were measured using an adjustable wooden measuring board, specifically designed to provide accurate measurements (to the nearest 0.1 cm) taking into consideration the situation in developing countries. Women’s weights and heights were used to calculate their BMI, and this was used to classify women as underweight, normal weight, overweight or obese according to the WHO classification: BMI<18.5 kg/m2 was defined as ‘underweight’, indicating chronic energy deficiency; BMI of 18.5–24.9 kg/m2 as ‘normal weight’; BMI of 25.0– 29.9 kg/m2 as ‘overweight’; and BMI≥30.0 kg/m2 as obese. Due to the small proportion of obese women this category was merged with overweight and labelled as ‘overweight/obese’. In the multivariable analysis ‘normal’ BMI was used as the reference category.
Predictor variables
Following the literature, the following important explanatory variables were included in the analysis: current age, current marital status, parity, household (HH) size, number of children aged ≤5 years in the HH, women’s level of education, earning cash, current amenorrhoeic status, household wealth index, frequency of watching television (TV), membership of a non-government organization (NGO) and religion. The survey lacked a direct measure of economic status on the basis of individual income or consumption expenditure, and this information was not available in the data set. The survey adopted an alternative procedure to measure a composite score (HH wealth index) based on various economic proxies, including household amenities, housing conditions and consumer durables. This is a common practice in population and health analyses (Vyas & Kumaranayake, Reference Vyas and Kumaranayake2006). Household wealth index was categorized into five groups: poorest, poorer, middle, richer and richest.
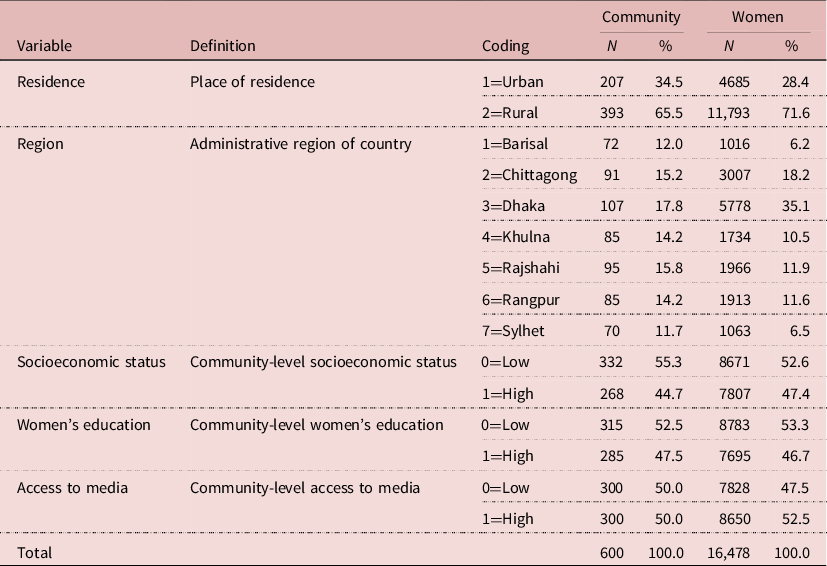
The community-level factors included in the analysis were: living environment (place of residence), region (administrative region), socioeconomic status, women’s education and access to media. As established in the reviewed literature (Ahmed et al., Reference Ahmed, Rwabilimbo, Abrha, Page, Arora and Tadese2020; Yeshaw et al., Reference Yeshaw, Kebede, Liyew, Tesema, Agegnehu, Teshale and Alem2020), respondent’s place of residence and region were used directly as given in the data set. The other community-level variables, i.e. socioeconomic status, women’s education and access to media, were computed for each cluster separately from aggregate-level data. To construct the community-level variable ‘socioeconomic status’ a composite score was calculated for each cluster following the method of estimation of ‘individual household wealth score’. Then the median national-level score was calculated. Clusters with a higher median asset score than the national-level score were labelled as ‘higher’ socioeconomic status, and those with a lower or equal asset score than the national level were labelled as ‘lower’ socioeconomic status’. In addition, community-level women’s education and access to media were computed from individual respondent of each cluster separately. In the 2014 BDHS, women’s education was given in continuous form. A median score of women’s education was calculated for each cluster, as well as a national-level score.
Community-level access to media was calculated from three items; ‘frequency of watching TV’, ‘frequency of listening to the radio’ and ‘frequency of reading newspapers or magazines’. Responses to these items were recorded as either ‘not at all’, ‘less than once a week’, ‘at least once a week’ or ‘almost every day’. The response ‘not at all’ was assigned a value ‘0’, and other responses were assigned a value ‘1’. The reliability of the assigned values was tested by Cronbach’s alpha. The estimated value of Cronbach’s alpha was 0.79, indicating a higher reliability and consistency of the assigned values. From the composite score of ‘frequency of watching TV’, ‘frequency of listening to the radio’ and ‘frequency of reading newspapers or magazines’, median scores were calculated separately for each cluster and also for the national level. Clusters with higher scores than the national median scores for education and access to media were labelled as having ‘high’ access to media, and ‘low’ access to media otherwise (Ahmed et al., Reference Ahmed, Rwabilimbo, Abrha, Page, Arora and Tadese2020; Yeshaw et al., Reference Yeshaw, Kebede, Liyew, Tesema, Agegnehu, Teshale and Alem2020).
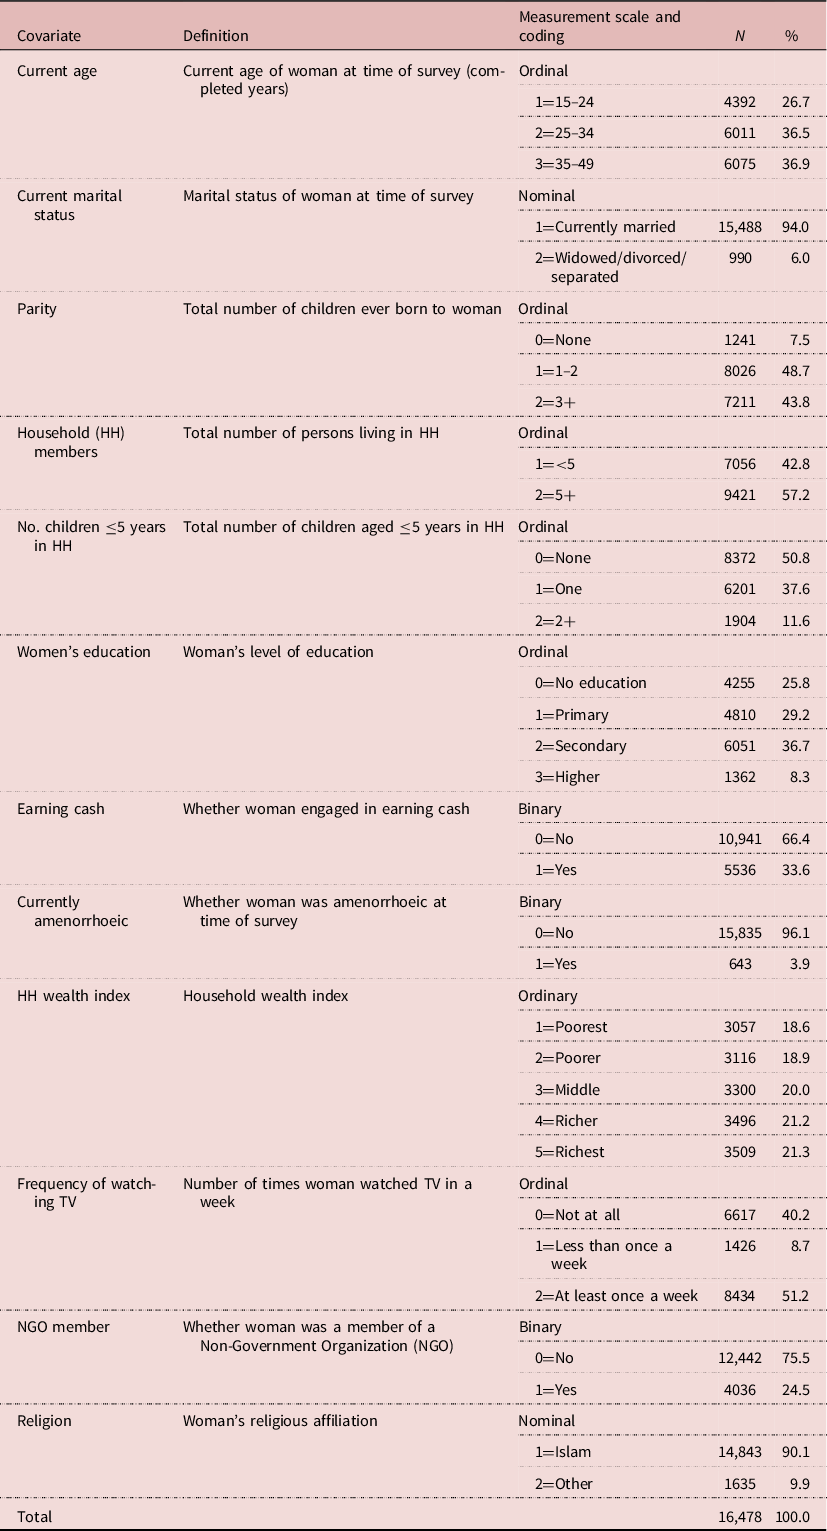
The measurements and definitions of the socioeconomic and individual-, household- and community-level explanatory variables are presented in Tables 1 and 2. Prior to conducting the multivariable analysis, multicollinearity was checked using the variance inflation factor (VIF). The highest value of the VIF was estimated to be 2.47, revealing the non-existence of multicollinearity.
Definitions of individual, household and socioeconomic factors and percentage distribution of ever-married non-pregnant women aged 15–49 years (N=16,649), BDHS 2014

Source: author’s calculation based on BDHS 2014 data.
Definition of community-level factors and percentage distribution of ever-married non-pregnant women aged 15–49 years (N=16,478), BDHS 2014

Source: author’s calculation based on BDHS 2014 data.
Statistical analysis
Univariate, bivariate and multivariate were employed in this study. In the univariate analysis, the percentage distribution of the respondents by their background characteristics was computed. The bivariate association between the explanatory variables and categories of BMI was examined through χ 2 tests. Women were nested within households and households were nested within clusters, making the data set multilevel. Due to the polychotomous nature of the outcome measures and the hierarchical structure of the data set, the effects of the individual- (including household and socioeconomic) and community-level factors were assessed by multilevel multinomial logistic regression (MLMLR) analysis. A prior checking of the MLMLR suggested that household-level factors captured negligible amount of variance. Hence a two-level MLMLR regression analysis was adopted. The MLMLR is a generalized linear mixed model with logit link-function and can be written as follows:
 $$\log \left[ {\Pr \left( {{y_{ij}} = s} \right)/\Pr \left( {{y_{ij}} = {\rm{normal}}} \right)} \right] = X{\beta ^{(s)}} + u_j^{(s)}$$
where s=underweight, overweight or obese; X indicates the matrix of explanatory variables at both the individual and cluster level, and
 ${\beta ^{(s)}}$
denotes the average effect captured by each explanatory variable on the probability of being underweight, overweight or obese relative to normal BMI. The term
 $u_j^{(s)}$
denotes the cluster-level random effect that is generally assumed to be uncorrelated with explanatory variables and is normally distributed with zero mean and variance to be estimated. An important reason for the use of the MLMLR is that women in households with similar characteristics can have different BMIs when residing in different communities with different characteristics.
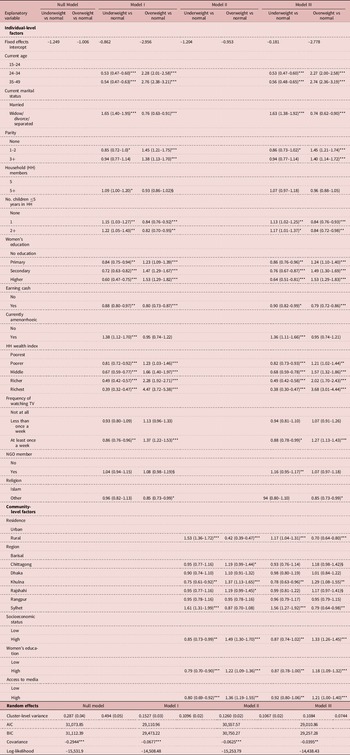
The MLMLR model-fitting process involved four stages of estimation. In the first stage, a null unconditional model was developed without keeping any explanatory variable (Null model). In the second stage, individual-level factors, including other selected household, socioeconomic and demographic factors, were included in the model (Model I). Model II was constructed including only community-level factors. In stage four –which was the contextual and final model of the study (Model III) – all selected individual, household, socioeconomic and community factors were included. The final model best explains the variation in the outcome variables. The results of the MLMLR analysis are presented in Table 5 with fixed and random effects and model fitness.
While other statistical models fail to capture the important statistical properties, such as heavy tails, skewness and possibly infinite variance, Quantile Regression (QR) is a better fitted model in those cases. The shortcoming of MLMLR is that the results of the model may suffer from a loss of information due to the arbitrary cut-off points (Hanandita & Tampubolon, Reference Hanandita and Tampubolon2015). To fill this gap, QR analysis was performed, which can be specified as follows:
 $${Q_q}\left( {{y_i}} \right) = X{\beta ^{(q)}} + \varepsilon _i^q; q = 0.05,0.10 \ldots ,0.95.$$
In the above specification,
 ${Q_q}\left( {{y_i}} \right)$
denotes the q th conditional quantile of BMI, X represents the matrix of explanatory variables,
 ${\beta ^{(q)}}$
indicates the vector of parameters which captures the effect of explanatory variables on the q th conditional quantile keeping other covariates constant, and
 $\varepsilon _i^q$
denotes the asymmetrically weighted absolute residual. As opposed to other truncated regression analysis, the QR model weights different portions of the sample to generate estimation of coefficients, thus increasing the power to identify differences in the upper and lower tails (Cook & Manning, Reference Cook and Manning2013). Furthermore, this statistical analysis makes it possible to avoid the assumption that variables operate the same at the upper tails of the distribution as at the mean and to identify the factors associated with nutritional status of women for different sub-groups of socioeconomic strata (Cook & Manning, Reference Cook and Manning2013). However, instead of fitting a multilevel QR model, the clustering of individuals was addressed by means of specifying a cluster-robust variance-covariance estimator using simple QR analysis.
The results of the MLMLR analyses are presented by odds ratios (ORs) with 95% confidence intervals (CIs) and those of the QR analysis are presented by estimated coefficients with 95% CI and are shown by Figure instead of Table. The level of significance was set at p<0.10. The individual weighting factor was used to make the estimates nationally representative. The data were analysed using Stata 15 (StataCorp).
Results
Characteristics of the sample women
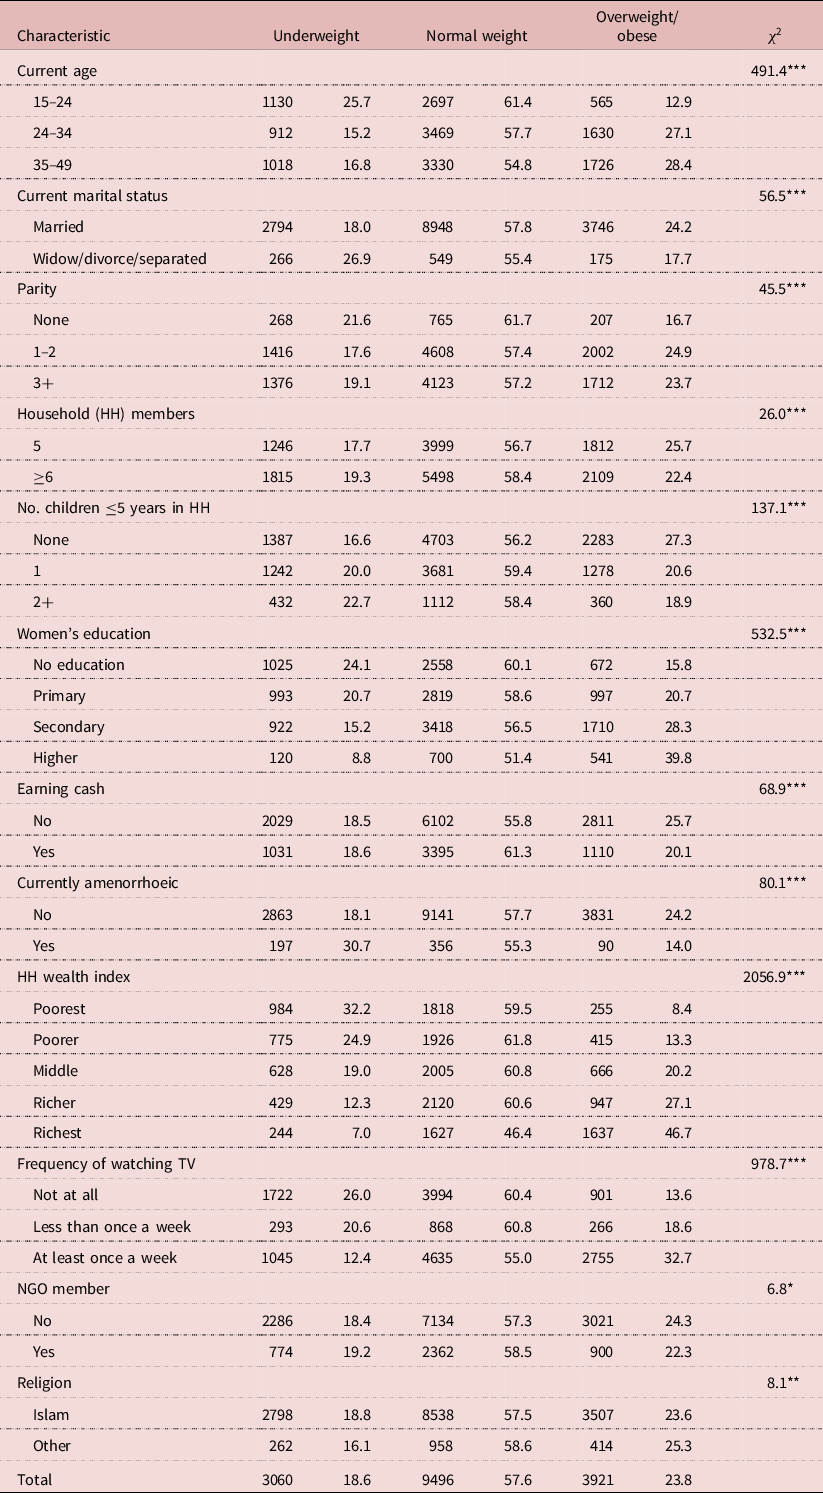
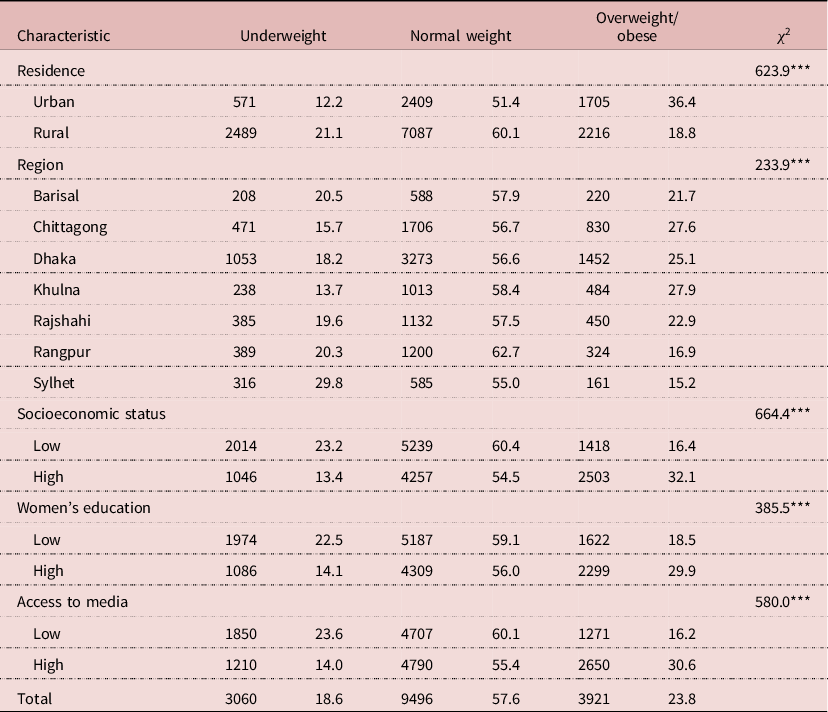
The mean±SD current age of the women was 31.5±9.1 years. The mean±SD number of children ever born to per woman was 2.5±1.7. The mean±SD household size and number of children aged ≤5 years in the household were 5.3±2.4 and 0.6±0.8, respectively (these statistics are not shown in Table 1). Table 1 shows that a quarter of the women had no formal education and one-third were engaged in earning cash. Almost 4% of the women were currently amenorrhoeic and two-fifths were from poor households. Over half watched TV at least once a week and about a quarter were NGO members. Table 2 shows that about 72% of the women were rural residents. A large proportion were from Dhaka division (35%). Less than half of the communities (clusters) had high socioeconomic status, more than half had low women’s education, whereas equal proportions had low and high access to media.
Trends in BMI
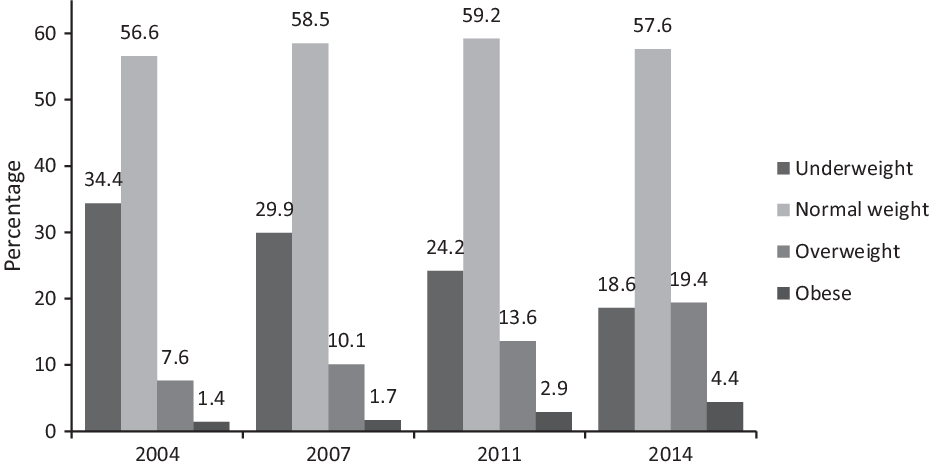
Figure 2 shows the BMI trends among ever-married non-pregnant women aged 15–49 years in Bangladesh. In 2014, 19% were undernourished, 58% were normal weight, 19% were overweight and 4% were obese. Close inspection reveals that, for the first time, the proportion of overweight women exceeded that of underweight women by approximately one percentage point in 2014, and when obesity was merged with overweight this proportion increased by more than 5 percentage points. The proportion of underweight women decreased sharply, by 15 percentage points, from 34% in 2004 to 19% in 2014. Although the prevalence of normal weight among women remained static at approximately 58% during 2004–2014, obesity status in the women tripled gradually over the decade.
Trends in BMI during the period 2004 to 2014.

Socio-demographic differentials in nutritional status
The socio-demographic and community-level differentials in the nutritional status of women in Bangladesh are presented in Tables 3 and 4, respectively. All variables were found to be statistically associated (p<0.05) with the different categories of BMI. Underweight status was significantly negatively, and overweight/obesity status was significantly positively associated with the current age of the respondents (Table 3). The prevalence of underweight and that of overweight/obesity were significantly associated with the current marital status of the women. Household size and number of children ≤5 years in the household were both positively associated with underweight and negatively associated with overweight or obesity in the women. The proportion of underweight status was significantly negatively associated, and that of overweight or obesity was positively associated, with women’s level of education. Household wealth index was inversely associated with undernutrition and positively associated with overweight or obesity status in the women. Underweight status was negatively associated, whereas overweight/obesity status was positively associated, with frequency of watching TV. Women’s NGO membership was also significantly associated with cut-off points of women’s BMI.
Percentage distribution of ever-married non-pregnant women aged 15–49 years by nutritional status and individual-level factors (N=16,478), BDHS 2014

Source: author’s calculation based on BDHS 2014 data.
***p<0.001; **p<0.01; *p<0.05.
Percentage distribution of ever-married non-pregnant women aged 15–49 years nutritional status and community-level factors (N=16,478), BDHS 2014

Source: author’s calculation based on BDHS 2014 data.
***p<0.001.
The prevalence of underweight women was higher in rural areas and that of overweight or obesity was higher in urban areas (Table 4). The regions showed a heterogeneous picture for underweight and overweight/obesity status. The proportion of underweight was significantly higher in women from low socioeconomic status communities, communities with a low level of women’s education and those with low access to media.
Results of multilevel analysis
The random effects of the multilevel analysis are shown at the bottom of the Table 5. The goodness-of-fit model was assessed using the estimated values of the Akaike Information Criterion (AIC), Bayesian Information Criterion (BIC) and log-likelihood. The lower values of AIC and BIC, and increased values of log-likelihood, suggest better fitting of the model. The covariance indicates the directional relationship between two random variables. A positive value of covariance means that two related variables move in the same direction; whereas a negative covariance means that the variables move in opposite directions. The estimated small negative values of the covariance in the four models depict the cluster-specific effects determining the probability of being either underweight or overweight. More explicitly, a negative value of covariance indicates that underweight status tends to be above normal weight and overweight status tends to be below its mean or vice versa. However, it follows that clusters with a higher proportion of underweight tend to have a lower proportion of overweight, but this may not be always be quite the same thing when the outcome of interest has three categories.
Multilevel multinomial logistic regression estimates of underweight and overweight/obese relative to normal BMI for individual- and community-level factors

Source: author’s calculation based on BDHS 2014 data.
***p<0.001; **p<0.01; *p<0.05; §p<10.
It is well established that bivariate analysis is not sufficient to identify the potential risk factors for outcomes of interest. Hence, to estimate the independent effect of each explanatory factor a series of MLMLR models were fitted after confounding with other covariates. The results of the multilevel analysis are presented in Table 5. The estimates substantially attenuated in the final model (Model III) when all individual- and community-level variables were included from the previous models. The estimated reduced values of AIC and BIC and increased values of log-likelihood revealed better fitting of Model III than the other study Models. Thus, the description of the results of the MLMLR analysis will be based on the estimates obtained in Model III.
Compared with women aged 15–24 years, those aged 25–49 were significantly less likely to be underweight and were more vulnerable to being overweight or obese relative to the reference category of normal BMI. Compared with their currently married counterparts, widowed, divorced and separated women were significantly more susceptible to being underweight (OR=1.63, 95% CI=1.38–1.92) and were less likely to be overweight (OR=0.74, 95% CI=0.62–0.90) than those of normal BMI. Women having higher parity, compared with those who had yet to give birth, were significantly more likely to be overweight relative to normal BMI. Compared with normal BMI, the risk of being underweight was significantly higher and that of being overweight or obese was significantly lower among those who had at least one child aged ≤5 years in their household than those who had no child aged ≤5 years in their household.
The findings reveal that, compared with normal BMI, the odds of being underweight decreased and those of being overweight or obese increased consistently with an increase in women’s level of education. Compared with women who were not engaged in earning cash, those who were engaged in earning cash were significantly less likely to be either underweight (OR=0.90, 95% CI=0.82–0.99) and overweight or obese (OR=0.79, 95% CI=0.72–0.86) relative to those having normal BMI. Currently amenorrhoeic women, compared with their counterparts who were not, were significantly more likely to be underweight (OR=1.36, 95% CI=1.11–1.67); however, amenorrhoeic status was not a significant predictor of being overweight or obese relative to normal BMI.
Household wealth index was inversely associated with underweight and positively associated with overweight or obesity relative to normal BMI. Frequency of watching TV appeared as a significant factor in the nutritional status of women. For instance, in contrast to women who did not watch TV, those who watched TV at least once a week were significantly less likely to be underweight (OR=0.88, 95% CI=0.78–0.99) and more likely to be overweight or obese (OR=1.27, 95% CI=1.13–1.43) relative to normal BMI. The NGO members, compared with their non-member counterparts, were more vulnerable to being underweight; however, NGO membership was not found to be significantly associated with being overweight or obese relative to having a normal BMI. When religious identity is considered, non-Muslim women were significantly less likely to be overweight (OR=0.85, 95% CI=0.73–0.99) relative to normal BMI. This variable was not found to have a significant associated with being underweight.
Compared with women from urban communities, those from rural communities were more likely to be underweight (OR=1.17, 95% CI=1.04–1.31) and less likely to be overweight or obese (OR=0.70, 95% CI=0.64–0.80) than women with normal BMI. Compared with women from the Barisal region, those residing in the Khulna division were at decreased risk, and those from Sylhet were at increased risk of being underweight relative to normal BMI. In contrast, women from Chittagong and Khulna divisions were at an increased risk, and those from Sylhet division at a decreased risk of being overweight relative to the reference category of BMI.
When other community-level variables were considered, women from high socioeconomic status communities were significantly less likely to be underweight (OR=0.87, 95% CI=0.74–1.02) and more likely to be overweight or obese (OR=1.33, 95% CI=1.26–1.45), and those from communities with a high level of women’s education were less likely to be underweight (OR=0.87, 95% CI=0.78–1.00) and more likely to be overweight or obese (OR=1.18, 95% CI=1.09–1.32). Moreover, women from communities having high access to media were at decreased risk of being underweight (OR=0.92, 95% CI=0.80–1.06) and at higher risk of being overweight (OR=1.21, 95% CI=1.00–1.40) relative to normal BMI.
Results of quantile regression (QR) analysis
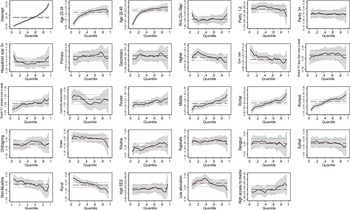
The results of the QR regression analysis are presented in Figure 3, with the conditional quantile of BMI on the x-axes and the estimated regression coefficients on the y-axes. The bold black lines show the independent effects of each explanatory variable on the respective conditional quantile. The associated 95% CI for each explanatory variable is shaded grey. The ultimate aim of this analysis was to examine for whom the effect of each explanatory variable was particularly relevant. A flat line depicts that the effect of the category of each covariate is equal for all women irrespective of their nutritional status. A monotonically increasing or decreasing line indicates that the effect becomes gradually more pronounced for individual’s extremity of nutritional status. Furthermore, a U-shaped or an inverted U-shaped pattern of line suggests that the effect is different between individuals with BMIs in the normal range and those at the two extremes of the nutritional spectrum. Finally, any line crossing the origin in y-axis indicates that there is a divergence in the direction of an effect.
Quantile regression analysis estimates; BMI quantiles on x-axes and β estimates on y-axes.

Watching TV at least once a week, being of a higher socioeconomic status and living in a community with high access to media had a positive impact on BMI, which was greater at higher levels of BMI (see Figure 3). On the other hand, earning cash and living in a rural area had a high impact at lower levels of BMI. The effect of region on women’s BMI was heterogeneous. A U-shaped association was observed for the effects of larger family size and among those who were not currently in a union, suggesting that a positive change in these categories of variables is associated with a higher BMI. The relatively straight intercept suggests that BMI was roughly normally distributed, which indeed confirms the results of the MLMLR analysis. However, with a few exceptions, the estimates obtained from the QR analysis largely reflect those of the MLMLR estimates.
Discussion
The aim of this study was to examine the prevalence and associations of individual- and community-level factors with underweight and overweight or obesity in women of reproductive age in Bangladesh using the nationally representative 2014 BDHS data set. The results of the study revealed that one-fifth of the women were underweight, one-fifth were overweight, and 4% were obese. A notable finding is that the proportion of overweight women exceeded that of undernourished women by approximately one percentage point in 2014, and this proportion increased to 5 percentage points when overweight and obesity statuses were merged. More interestingly, the proportion of women with overweight and obesity status has increased by 8 percentage points over a period of 3 years – from 16% in 2011 to 24% in 2014. These findings imply that the country is bearing the dual burden of malnutrition shared by under- and overnutrition in women, with overnutrition now exceeding undernutrition.
The estimated cluster-level variance which captured the unobserved effect of communities revealed significant cluster-level variability in the nutritional status of women. In particular, women’s current age and wealth index captured almost half of the intensity of the probability of being underweight and overweight over normal weight. Biosocial changes and dietary pattern may be plausible reasons for this. The variation in nutritional status between clusters observed in this study is consistent with that reported in previous studies in Bangladesh (Corsi et al., Reference Corsi, Kyu and Subramanian2011) and India (Ackerson et al., Reference Ackerson, Kawachi, Barbeau and Subramanian2008), which proposed physical, social and economic pathways between communities and nutritional outcomes. Like in India (Ackerson et al., Reference Ackerson, Kawachi, Barbeau and Subramanian2008), the observed urban–rural differences in the BMI of women in Bangladesh provide some insight into how neighbourhoods in Bangladesh may serve to pattern women’s nutritional status.
Consistent with the findings of previous studies conducted in other settings (Gouda & Prusty, Reference Gouda and Prusty2014; Hanandita & Tampubolon, Reference Hanandita and Tampubolon2015; Little et al., 2016; Atuahene et al., Reference Atuahene, Ganle, Adjuik, Atuahene and Kampiti2017; Shinsugi et al., Reference Shinsugi, Gunasekara, Gunawardena, Subasinghe, Miyoshi and Kaneko2019; Tanwi et al., Reference Tanwi, Chakrabarty and Hasanuzzaman2019; Biswas et al., Reference Biswas, Townsend, Magalhaes, Hasan and Mamun2020; Sunuwar et al., Reference Sunuwar, Singh and Pradhan2020), this study revealed that, along with socioeconomic status, current age, women’s education, women’s employment status, watching TV and religion are important determinants of being underweight and overweight or obese. Many studies have confirmed that less physical activity, and shifting towards a Western dietary pattern, are the main reasons for being overweight and obese (Wanner et al., Reference Wanner, Richard, Martin, Faeh and Rohrmann2017; Jackson & Steptoe, Reference Jackson and Steptoe2017; Samdal et al., Reference Samdal, Eide, Barth, Williams and Meland2017). Indeed, irrespective of sex, sedentary people have a greater fat mass and higher BMI and hence are at a greater risk of being overweight and obese (Tremblay et al., Reference Tremblay, LeBlanc, Kho, Saunders, Larouche and Colley2011; teVelde et al., Reference teVelde, van Nassau, Uijtdewilligen, van Stralen, Cardon and De Craemer2012; Laredo-Aguilera et al., Reference Laredo-Aguilera, Cobo-Cuenca, Santacruz-Salas, Martins, Rodríguez-Borrego, Lopez-Soto and Carmona-Torres2019; Zou et al., Reference Zou, Su, Du, Ouyang, Wang and Wang2020).
The higher risk of overweight and obese in older women compared with their younger counterparts has been explained in earlier studies by a variety of reasons in the context of South Asian countries, including Bangladesh (Khan & Kraemer, Reference Khan and Kraemer2009; Gouda & Prusty, Reference Gouda and Prusty2014), such as lower physical activity, poorer care and diet. Changes in metabolic function, less-stressful lifestyles, as well as psychological changes, may also shape the BMI of older women. The double vulnerability of nutritional status seems to be consistent with explanations of the biosocial and cultural aspects of malnutrition among women (Delisle, Reference Delisle2008). Even when unemployed, younger women remain active doing household chores and other physical activities, which helps them to maintain a normal body weight.
A study in the Maldives found no significant association between current marital status and parity and being overweight or obese (Hashan et al., Reference Hashan, Rabbi, Haider and Gupta2020b). However, the present study has demonstrated that women with higher parity are significantly more likely to be overweight. This can partly be attributed to the fact that women with a higher parity are older and have declining physical activity. Additionally, women with more household members and those with a larger household size were significantly less likely to be overweight. This may be the result of sharing limited food, which leads to women being undernourished. The low likelihood of overweight and obesity in widowed, divorced or separated women may be the effect of their poor wealth status compared with their currently married counterparts.
In contrast to a study in the Maldives, which showed that women’s education was not associated with overweight and obesity status (Hashan et al., Reference Hashan, Rabbi, Haider and Gupta2020b), this study found a positive association. Higher education acts as a vehicle for obtaining better and more prestigious jobs in the formal and informal sectors, helping women be independent and allowing them to improve their socioeconomic status. Plausibly, this helps women to lead a life with less physical activity, which may be an imperative cause of being overweight or obese. Another plausible explanation for the higher risk of being overweight or obese in higher educated women compared with their low educated counterparts could be that women with better income are more likely to expose themselves to a Westernized way of life (Kain & Albala, Reference Kain, Vio and Albala2003; Okoh, Reference Okoh2013; Gouda & Prusty, Reference Gouda and Prusty2014; Rai et al., Reference Rai, Gurung, Thapa and Saville2019; Kassie et al., Reference Kassie, Abate and Kassaw2020).
Many working women in Bangladesh also carry out household chores and other domestic activities. Women who are NGO members are generally from less-affluent families, and have to do more physical work than those who are not NGO members and not working. The study found that women engaged in earning cash were more likely to be underweight and also overweight or obese. These negative associations may be explained by three main pathways. Firstly, employed or working women may be more empowered in the household decision-making process, including making decisions about their own health. Secondly, these women are more conscious of their own health status and that of other family members. Third, women engaged in earning cash are possibly more aware of the need to have a balanced diet to keep fit and healthy. These findings are consistent with many studies conducted elsewhere.
The mass media, in general, acts as an influential tool that educates people about important issues such as well-being and healthy lifestyles. However, people who have frequent access to media are more likely to gain weight compared with those with limited access. It is plausible that people tend to eat more, particularly the non-poor, and are more likely to use energy-saving devices and consume more energy-dense or junk food items while watching TV or listening to the radio. Also, they are able to afford expensive energy-dense food and drink. In addition, watching TV or listening to the radio for long periods of time substantially reduces all physical activity, and these factors together lead to weight gain (Amoah, Reference Amoah2003; Gouda & Prusty, Reference Gouda and Prusty2014; Kassie et al., Reference Kassie, Abate and Kassaw2020).
The study also showed that women residing in the Khulna division were significantly less likely to be underweight and more likely to be overweight or obese, and those from Sylhet division were more likely to be underweight and less likely to be overweight or obese compared with those residing in the Barisal division. Khulna division is a more affluent region of the country in terms of urbanization and industrialization. Additionally, Sylhet division is relatively poor in terms of industrialization and is mainly agrarian. Moreover, the educational attainment of women is higher in Khulna division, resulting in a better socioeconomic status compared with other administrative regions. Also, employment status was lowest among women from the Sylhet division (NIPORT et al., 2016). Hence, women residing in regions with better socioeconomic settings apparently enjoy a sedentary lifestyle, which may cause them to be overweight or obese.
It is notable that the community-level variables included in the analysis did not fully explain the community-level variations in women’s BMI that are observed from the little change in the random intercept variance after inclusion of the explanatory variables in the models. Hence, there might be other factors at the community-level that were not included in the analysis, and these could play a vital role in shaping inter-community disparity in women’s nutritional status. Prior studies in different countries have also found residual community-level variation in explaining underweight, overweight and obesity (Ackerson et al., Reference Ackerson, Kawachi, Barbeau and Subramanian2008; Shrestha et al., Reference Shrestha, Mishra, Ghimire, Gyawali, Pradhan and Schwarz2020; Yeshaw et al., Reference Yeshaw, Kebede, Liyew, Tesema, Agegnehu, Teshale and Alem2020).
This study has several limitations and strengths. First, the cross-sectional data used in the study prevented the determination of exact cause and effect relationships. Second, there was a chance of recall bias. Due to a paucity of information, various factors that could influence weight gain or loss could not be included in the analysis, including dietary intake, smoking, physical activity and visceral adiposity. Third, BMI is a crude index because it does not reflect fat distribution, and BMI can vary in individuals and populations (Naser et al., Reference Naser, Grubr and Thomson2006; Khan & Kraemer, Reference Khan and Kraemer2009). The main strength of the study is that it used a large nationally representative data set to examine the prevalence and socioeconomic determinants of the extremes of BMI of women in Bangladesh. An important strength of this study is the application of sophisticated and unique statistical techniques which have not been previously applied in 2014 BDHS data set.
In conclusion, this study demonstrates the burden of extreme BMI values of ever-married non-pregnant women in Bangladesh. Overall, nearly a quarter of these women were overweight or obese in 2014, and for the first time, the proportion of overweight exceeded the prevalence of undernourished women. Extreme BMI values were more prevalent in the rich compared with the poor, and in urban residents compared with their rural counterparts. More importantly, the incidence of undernourishment is decreasing sharply and that of overweight and obesity is increasing gradually. The findings further reveal that, along with individual factors, community-level factors play a vital role in shaping the nutritional status of women in Bangladesh. The observed extreme BMI values underscore the need for health promotion interventions among this population. The findings suggest that the nutritional status of women in Bangladesh is related to socioeconomic and individual-, household- and community-level factors. The issue of dual burden of nutritional status among women in Bangladesh calls for immediate policy adoption for its mitigation; otherwise, the burden of extremes in BMI will result in a pandemic of life-threatening NCDs in the country. When developing intervention programmes to combat the double burden of nutritional status of women in Bangladesh, urban–rural place of residence, education and employment status should be taken into consideration.
Funding
This research received no specific grant from any funding agency, commercial entity or not-for-profit organization.
Conflicts of Interest
The authors have no conflicts of interest to declare.
Ethical Approval
The study used data from an anonymous data set with no identifiable information on survey participants. Moreover, the BDHS survey followed all WHO protocols. The survey was conducted and implemented by NIPORT under the Ministry of Health and Family Welfare, Government of Bangladesh. Therefore, no further ethical approval was required from any other institution for this study.