Introduction
Mars exploration sites and required instrumentation
Studies in the Arctic permafrost (Gilichinsky et al. Reference Gilichinsky, Vorobyova, Erokhina, Fyordorov-Dayvdov and Chaikovskaya1992) and the dry valleys of Antarctica (Friedmann & Ocampo Reference Friedmann and Ocampo1976; Friedmann Reference Friedmann1982; Friedmann Reference Friedmann1986; Priscu et al. Reference Priscu1998) have documented the robust persistence and adaptation of microbial life in Earth's polar cryosphere across geological time scales. Recent simulations predict that microbial life may be able to survive the cosmic-ray ionizing radiation penetrating into subsurface habitats on Mars at depths accessible to drilling missions currently under development (Dartnell et al. Reference Dartnell, Desorgher, Ward and Coates2007a,Reference Dartnell, Desorgher, Ward and Coatesb).
The most probable locations for the discovery of extant life or trace fossils on Mars are the polar permafrost zones (Horneck Reference Horneck2000). However, because of fuel costs to obtain a polar insertion orbit, and difficulty in designing, heating and powering instrumentation, the in situ exploration of the Mars polar regions will be the most costly and environmentally demanding series of missions yet deployed to that planet. Surveying for abiotic, prebiotic or biotic organic material in the permafrost subsurface zones will require a drilling system similar to that currently under development for the European Space Agency's ExoMars mission (Vago et al. Reference Vago, Gardini, Kminek, Baglioni, Gianfiglio, Santovincenzo, Bayon and van Winnendael2006).
Astrobiological instrumentation currently under development for extended in situ exploration of the Mars regolith generally falls into one of two end-member categories: devices designed to survey rapidly for possible signatures of extant or fossil life, and devices designed to carefully identify the chemical and structural characteristics of the putative artefacts selected by the survey instruments. Survey science packages for cryosphere subsurface exploration will require triage instrumentation to rapidly scan cores as soon as they are brought to the surface, where they will be fully exposed to solar ultraviolet (UV) and cosmic particle radiation. Ideally, survey instrumentation should require no sample contact, preparation or destruction, and it should not consume irreplaceable resources. Such a tool used in previous Mars missions would be the series of panoramic cameras deployed by Viking, Pathfinder and the Mars Exploration Rovers. Using only reflected light, these multi-band imaging systems have provided both structural and co-registered chemical information. Analysis of the camera findings in almost real time has made it possible to selectively deploy a variety of more complicated, time-consuming, destructive and resource-hungry techniques, including metabolic experiments, ultraviolet-visible-near infrared (UV-Vis-NIR) spectroscopy, and mass spectroscopy.
While the acquisition of passive, reflected solar light is the most energy efficient and least complicated technique available, broadband solar illumination of multiple prebiotic or biotic molecules produces a complex absorption/reflection signature that is difficult to deconvolve unless the geological and biological history of the target and its habitat are well understood. The current lack of information on any putative prebiotic or biotic chemistry in the Mars regolith makes it difficult to evaluate the signal information content in a reflection image or spectrum. On the other end of the scale, active photonic probes that use narrow-band laser excitation can be employed to probe only molecules whose absorption bands encompass the excitation wavelength. Such selectivity narrows the chemical species possibilities and provides much-needed constraints on interpretation of any putative biosignature. Raman spectroscopy and imaging have been proposed as search tools for work on the Mars regolith (Wynn-Williams & Edwards Reference Wynn-Williams and Edwards2000; Storrie-Lombardi et al. Reference Storrie-Lombardi, Hug, McDonald, Tsapin and Nealson2001; Edwards Reference Edwards2007). These systems provide high information content about molecular species, and can be implemented in non-contact, non-destructive format. However, Raman phenomena are notoriously ‘photon-poor’ events. Data acquisition can be prolonged if implemented in the IR wavelengths, targets can be damaged in the deep UV wavelengths and biological material emits obscuring fluorescence following excitation in visible wavelengths. The systems are also fairly power intensive.
For rapid probing of specific biological molecules, autofluorescence is the active photonic technique offering rapid data acquisition, ease of implementation and instrumentation simplicity. The technique can be conducted without sample preparation and data can be obtained quickly enough to avoid permanent sample damage. Laser-induced fluorescence emission (L.I.F.E.) from specific biomolecular intracellular and extracellular targets is arguably the single most sensitive active photonic probe that does not require sample preparation, sample destruction or the consumption of irreplaceable resources (Asher Reference Asher1993). Indeed, the technique will continue to function as long as the mission has power. Autofluorescence biosignatures extracted from spectra and/or images have become a fundamental part of forensic crime scene analysis (Brettell & Saferstein Reference Brettell and Saferstein1991) and biowarfare defence (Kim et al. Reference Kim, Estes, Duncan, Wade, Cleary, Lloyd, Ellis and Powers2004).
Epifluorescence
Epifluorescence microscopy using broadband excitation wavelengths at 254 and 375 nm, and laser excitation of 532 and 660 nm, are employed routinely in microbiology in laboratories around the world. Laser wavelengths between 220 and 250 nm excite nucleic acids and aromatic amino acids, producing fluorescence response maxima between 300 and 350 nm. The responses can be easily detected by UV-sensitive cameras (Nealson et al. Reference Nealson, Tsapin and Storrie-Lombardi2002) and spectrometers (Bhartia et al. Reference Bhartia2008). Fluorescence images acquired following excitation at these wavelengths have been proposed as a preliminary screening method prior to using deep UV Raman spectroscopy as a strategy to search for prebiotic and biotic molecules on Mars (Storrie-Lombardi et al. Reference Storrie-Lombardi, Hug, McDonald, Tsapin and Nealson2001). Similar UV autofluorescence protocols have been employed to find microbial life in 1.3 km deep basalt in the Mauna Kea volcano (Fisk et al. Reference Fisk, Storrie-Lombardi, Douglas, Popa, McDonald and Di Meo-Savoie2003), find microbial colonies in glacial ice (Price Reference Price2007) and estimate biomass in Greenland ice cores (Rohde et al. Reference Rohde, Price, Bramall and Bay2007).
Broadband or laser excitation in the near UV (UV-A) wavelength (365–375 nm) of metabolites, such as flavin adenine dinucleotide (FAD) and nicotinamide adenine dinucleotide (NAD), produces fluorescence in the blue and green portion of the visible spectrum. Since these molecules are central to the metabolic activity of all terrestrial organisms, their fluorescence activity could be used as a probe to distinguish extant life from prebiotic organics and/or fossil accumulations of diagenetic organic material (Storrie-Lombardi Reference Storrie-Lombardi, Hoover, Levin and Rozanov2005). Autofluorescence following near-UV excitation has been proposed as a technique applicable to the search for infall polycyclic aromatic hydrocarbons sequestered within the Martian regolith during the European Space Agency's planned ExoMars mission (Griffiths et al. Reference Griffiths, Coates, Muller, Storrie-Lombardi, Jaumann, Josset, Paar and Barnes2008; Storrie-Lombardi et al. Reference Storrie-Lombardi, Muller, Fisk, Griffiths and Coates2008; Muller et al. Reference Muller, Storrie-Lombardi and Fisk2009; Storrie-Lombardi et al. Reference Storrie-Lombardi, Muller, Fisk, Cousins, Sattler, Griffiths and Coates2009).
In microbial photoautotrophs, excitation between 450 and 650 nm produces a fluorescence response between 500 and 800 nm originating in pigments critical for photosynthesis (Blinks Reference Blinks1954). Microbial photopigments of significance to the current study include the carotenoids, phycobiliproteins, bacteriochlorophyll and chlorophylls a and b. Phycobiliproteins are found primarily in red algae, cyanobacteria and cryptomonads, including extremophiles found in ice-covered Antarctic lakes and acidic high-temperature hydrothermal vents. Red algae and cyanobacteria may have all three types of biliprotein: phycoerythrin, phycocyanin and allophycocyanin (Samsonoff & MacColl Reference Samsonoff and MacColl2001). Red algae and cyanobacteria contain chlorophyll a, and cryptomonads contain both chlorophyll a and c. In underwater habitats, the spectral distribution of solar irradiation is shifted towards blue-green energies. These wavelengths are more efficiently absorbed by the biliproteins than by chlorophyll a. Photonic energy absorbed and transformed into electronic energy by the biliproteins passes to chlorophyll and then to the photosynthetic reaction centres for conversion into chemical energy. The most commonly encountered cyanobacteria phycobionts of cryptoendolithic lichens in the high-polar regions of Antarctica all exhibit autofluorescence activity following excitation between 436 (Sorest band for chlorophyll) and 550 nm (maximum absorption region for phycobiliproteins) (Erokhina et al. Reference Erokhina, Shatilovich, Kaminskaya and Gilichinskii2002). Fluorescence emission spectral signatures of phytoplankton have been obtained from NASA's Airborne Oceanographic Light Detection and Ranging (LIDAR) since 1979 using 532 nm laser excitation (Hoge & Swift Reference Hoge and Swift1981).
Laboratory mapping of fluorescence
Given the wide variety of possible molecular targets, and the understanding that large molecular species possess long-wavelength absorption bands capable of quenching the fluorescence emitted by smaller intracellular targets, choosing the appropriate excitation and emission wavelengths to characterize a microorganism is not a trivial task. Fortunately, in the laboratory complete characterization of the autofluorescence response of a complex microbial cell can be accomplished by recording the set of emission spectra produced by incrementing the excitation wavelength across a range of UV and visible wavelengths. The stack of emission spectra produced by a range of excitation wavelengths constitutes a three-dimensional datacube: an excitation–emission matrix (EEM). EEMs are commonly produced by any of several standard laboratory fluorometers, usually comprised of a xenon arc lamp, double excitation and emission scanning monochromators, a sample compartment, and a high-voltage photomultiplier tube (PMT). A meaningful way of visually representing this information-rich EEM datacube is as a contoured landscape of emission intensity, where peaks of fluorescence are seen located at specific coordinates in the excitation–emission parameter space. A clearer visualization is to flatten this landscape into a two-dimensional plane, with the height of peaks illustrated through the colour coding of emission intensity and the plotting of contour lines of equi-intensity. This method for presenting the complete EEM has the advantage that peaks are not obscured behind one another from the plotting perspective, and represents a clear map of a sample's fluorescent response, as seen in the figures in this paper.
Use of this EEM technology has provided insights into the development and progression of human malignancy (Palmer et al. Reference Palmer, Keely, Breslin and Ramanujam2003; Diagaradjane et al. Reference Diagaradjane, Yaseen, Yu, Wong and Anvari2005), made possible the rapid detection of bacterial pathogens (Sohn et al. Reference Sohn, Himmelsbach, Barton and Fedorka-Cray2009), provided a means of monitoring critical cellular metabolites such as NAD(P)H in vivo (Georgakoudi et al. Reference Georgakoudi2002) and successfully characterized marine and freshwater plankton, including those responsible for toxic algal blooms (Oldbam et al. Reference Oldbam, Zillioux and Warner1985; Campbell & Iturriaga Reference Campbell and Iturriaga1988; Elliott et al. Reference Elliott, Lead and Baker2006; Zhang et al. Reference Zhang, Lei, Wang, Wang and Zhu2006; Ziegmann et al. Reference Ziegmann, Abert, Müller and Frimmel2010). EEM signatures have also been shown to discriminate between proteins and refractory diagenetic organic matter in deeply buried ocean sediments, showing the worth of fluorescence as an organics surveying tool for extraterrestrial missions (Twardowski et al. Reference Twardowski, Mouw, Dombroski and Smith2007).
Experimental microorganisms
Five representative microorganisms were selected for this total fluorescence study: Deinococcus radiodurans, Escherichia coli, Brevundimonas sp. MV.7, Rhodococcus sp. MV.10 and Synechocystis sp. PCC 6803.
D. radiodurans is a polyextremophilic organism, capable of surviving multiple environmental hazards including desiccation, hydrogen peroxide, UV light and high doses of ionizing radiation (Richmond et al. Reference Richmond, Sridhar and Daly1999). In particular, D. radiodurans is the most radiation-resistant organism known, and can recover from extensive ionization-induced genomic fragmentation (Cox & Battista Reference Cox and Battista2005). D. radiodurans is thus often taken as a model terrestrial organism that could survive many of the environmental hazards of the Martian surface, including the unshielded flux of cosmic rays.
E. coli is not an extremophilic organism but was isolated from the human gut fauna, and is commonly used as a model experimental microbe in cellular biology or genetic research. E. coli is selected here as a representative bacterium that is not environmental and produces no pigmentation or UV-screening compounds that might mask the fluorescence of its cellular components. As one of the premier models for molecular biology and genomics across the past four decades, its metabolism and intracellular composition are well documented, providing a rich data set to help predict the origin of its EEM signatures.
Two novel strains of psychrotolerant bacteria were also used. These were isolated from mineral grain soils of the Miers Valley (MV) in the Dry Valleys region of Antarctica, and identified by 16S rRNA gene cloning and sequencing as members of the Brevundimonas and Rhodococcus genera. The Antarctic Dry Valleys are often taken as an analogue site to the Martian surface, as they replicate many of the harsh environmental conditions, namely desiccation, low temperatures, solar UV radiation and very low organic carbon content in the mineral soils. These two microorganisms are thus used in this study as models of desiccation- and cold-resistant organisms adapted to Martian-like conditions. The isolation and radiation-resistance determination of strains Brevundimonas sp. MV.7 and Rhodococcus sp. MV.10 is reported in Dartnell et al. (Reference Dartnell, Hunter, Lovell, Coates and Ward2010).
Synechocystis sp. PCC 6803 is a cyanobacterium commonly used in research into bacterial photosynthesis and energy transduction. It is not considered extremophilic (for example, it has not been identified in the Dry Valleys of Antarctica (Pointing et al. Reference Pointing, Chan, Lacap, Lau, Jurgens and Farrell2009) or biodiversity surveys of the Antarctic permafrost (Gilichensky Reference Gilichinsky2007)), but is simple to grow in the laboratory either on agar plates or in liquid culture, and contains the same cellular fluorophores as hardier cyanobacteria strains that are often the dominant primary producer in Antarctica (see the Discussion). Furthermore, Synechocystis sp. PCC 6803 grows as individual cells rather than mats, and so consistency of test samples is easier to achieve. Synechocystis has served as one of the central model organisms for understanding the response of microbial life to reactive oxygen species (Latifi et al. Reference Latifi, Ruiz and Zhang2009), a topic of central concern when exploring high-radiation environments such as the surface of Mars. Cyanobacteria are of particular interest to the astrobiology community because they appear to be a prominent member of an ancient prokaryote clade, tentatively designated Terrabacteria, whose members exhibit significant evolutionary adaptations to terrestrial stressors, including desiccation and radiation (Battistuzzi & Hedges Reference Battistuzzi and Hedges2009). One of the primary adaptive mechanisms for cyanobacteria resistance to both desiccation and radiation damage, DNA repair proteins, varies significantly in efficiency across species (Billi et al. Reference Billi, Friedmann, Hofer, Caiola and Ocampo-Friedmann2000). Shielding against UV radiation is provided by protective pigments, such as scytonemin (Garcia-Pichel & Castenholz Reference Garcia-Pichel and Castenholz1991; Garcia-Pichel et al. Reference Garcia-Pichel, Sherry and Castenholz1992), that may be resistant to diagenetic degradation and be useful as an in situ biomarker (Wynn-Williams & Edwards Reference Wynn-Williams and Edwards2000).
The work reported here represents a broad study into the total fluorescence exhibited by a wide selection of model, extremophilic and photosynthetic bacterial strains, over a great range of excitation and emission wavelengths from UV through visible to NIR. The aim is to identify distinctive fluorescent features that may serve as detectable biosignatures of remnant microbial life on the Martian surface. We also study how these biological fluorophore molecules may be degraded, and thus the potential biosignatures erased, by the high flux of far ultraviolet (UV-C) light on Mars.
Materials and methods
Bacterial culturing conditions
All cells were cultured in conical flasks of liquid medium with constant agitation to late log-phase of growth for high cell densities. D. radiodurans was cultured in Tryptone digest, Glucose, Yeast extract (TGY) medium, composed as described in Anderson et al. (Reference Anderson, Nordan, Cain, Parrish and Duggan1956) and incubated at 30°C for 53 hours. E. coli was cultured in NB2 (Oxoid, Basingstoke, UK) growth medium at 37°C for 14 hours. Brevundimonas sp. MV.7 and Rhodococcus sp. MV.10 were isolated from an oligotrophic environment (Dartnell et al. Reference Dartnell, Hunter, Lovell, Coates and Ward2010) and so were cultured in Nutrient Broth CM0001 (Oxoid), made to one-quarter strength of the manufacturer's instructions (3.25 g l−1 of de-ionized water), ¼NB, incubated at 25°C for 92 hours. Synechocystis cells were grown in BG11 medium (Castenholz Reference Castenholz1988) incubated at 25°C for seven days within a cyanobacterial culture light cabinet.
Sample preparation
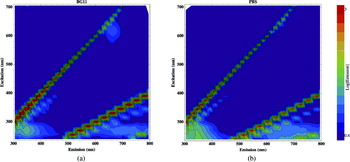
Due to the high concentration of organic molecules in the TGY, NB2, and ¼NB growth media, the heterotrophic bacteria needed to be washed of their culture media in order to measure the fluorescence of the cells themselves. Thus, prior to analysis, all experimental organisms, except Synechocystis, were washed by centrifuging a sub-sample of the liquid culture at 9000 g for 10 minutes and resuspending the bacterial pellet in an equal volume of Phosphate Buffer Solution (PBS). PBS contains negligible levels of organic carbon and so does not interfere with the measured fluorescence of the cell suspension (see Fig. 1). Synechocystis is grown in BG11 medium, which as a photoautotroph culture contains negligible organic carbon, and so the cyanobacteria cultures did not require washing prior to analysis (see Fig. 1).
EEMs recorded for: (a) BG11 cyanobacterium growth medium; (b) PBS.

The fluorescent emission measured from a sample increases with the concentration of fluorophores and thus is dependent on the density of cells within the liquid sample. Beyond a certain cell density, however, optical scattering and reabsorption of emitted light becomes increasingly dominant and the measured fluorescence response begins to decrease with higher cell density. In order to determine the cell density that yields the maximal fluorescent response, a dilution series of Synechocystis cells was prepared. Synechocystis was chosen as this organism contains a greater range of fluorophores than the other organisms considered here, exhibiting both small metabolite and high Stoke-shift pigment fluorescence. A liquid sample of an actively-growing Synechocystis culture was spun-down and the bacterial pellet resuspended in BG11 one tenth of the original sample volume to produce a 10× concentrated sample. This master concentrated volume was serially diluted with BG11 to produce a two-fold dilution series. For each serial sample, the optical density at 600 nm (OD600) was measured (with sample dilutions performed as necessary to ensure the measured value was below 1 and thus accurate), and the fluorescent spectrum measured for excitation at 375 nm (UV-A), 405 nm (blue), 532 nm (green) and 660 nm (red).
Once the optimum cell density had been determined, the fluorescent response of all microbial test strains was measured from samples diluted with PBS or BG11, as appropriate, to approach this target optical density. It should be noted that OD600 measurements are only an approximate method of normalizing to cell density between different organisms due to the variability in cell size and thus light-scattering properties, particularly considering that D. radiodurans grows as clusters of two cells (diplococci) in the early stages of culture and tetrads of four cells later (Thornley et al. Reference Thornley, Horne and Glauert1965; Daly et al. Reference Daly2004). It is a sufficient approach for the analysis described here.
Excitation–emission matrices
The fluorescent emission of samples was measured with a Perkin Elmer LS55 Fluorescence Spectrometer (Perkin Elmer, Cambridge, UK). This instrument consists of a pulsed xenon arc lamp light source, excitation and emission scanning monochromators, a sample compartment with a cuvette holder, and a PMT detector. Three millilitre liquid samples were pipetted into a 1 cm UV-C quartz cuvette (Fisher, Loughborough, UK) and placed in the sample holder. Emission spectra were recorded between 300 and 800 nm, with data points logged every 0.5 nm. The excitation wavelength was incremented in 15 nm steps between 240 and 705 nm, producing a total of 32 emission spectra for each sample. An excitation slit width of 8 nm and emission slit width of 5 nm was used, with an emission scan speed of 1000 nm min−1. With these settings, the data required around 25 minutes to acquire per sample.
The complete fluorescence data set collected for each sample is thus a three-dimensional data cube, composed of emission intensity measurements at each of 32 000 excitation–emission wavelength permutations. To smooth the recorded emission spectra, and reduce the computational demands required for subsequent processing and plotting of the complete EEM, emission spectra were averaged into bins 10 nm wide.
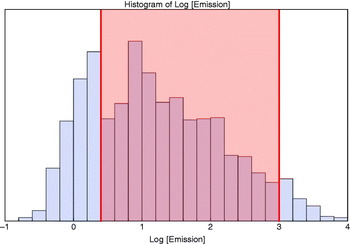
EEMs were generated from the acquired data cube by data transformation and analysis code written by the author in Mathematica 7.0 (Wolfram Research, Champaign, USA). The emission profile is presented on a log10 scale and displayed with rainbow colour coding and 15 contour lines. The appropriate range for colour coding of the log-scale emission intensity was determined by reference to the emission histogram displayed in Fig. 2, as described further in the Discussion.
Histogram of emission intensities recorded across the EEM of Synechocystis sp. PCC 6803 cells, clearly showing three distinct peaked populations of emission. The central population is the biological fluorescence so the colour coding of emission in all EEMs is scaled between 0.4 and 3, as indicated by the range tinted red.

EEMs were also generated for both the BG11 cyanobacterium growth medium and the PBS dilutant used, to confirm that neither exhibits significant fluorescence that may interfere with the interpretation of the organism fluorescence.
Ultraviolet irradiation
The sensitivity of this analytical technique to cellular fluorescence changes induced by UV light was tested. A culture of Synechocystis sp. PCC 6803 was grown to late-log phase, as described above, and an 80 ml sample pipetted into a 13.5 cm Petri dish, to a total depth of 5 mm. This shallow sample was kept agitated with a magnetic stirrer, and irradiated beneath a 6 W 254 nm UV-C light source. A sample was collected after four hours of exposure, and this and an unexposed control were analysed for total fluorescence by EEM plotting as described above. The response of the cyanobacterium was evaluated by subtracting the EEM measured from the unexposed control from that recorded for the irradiated sample, and plotting the result as a difference EEM, using a linear emission scale.
Results and discussion
Optimal experimental parameters
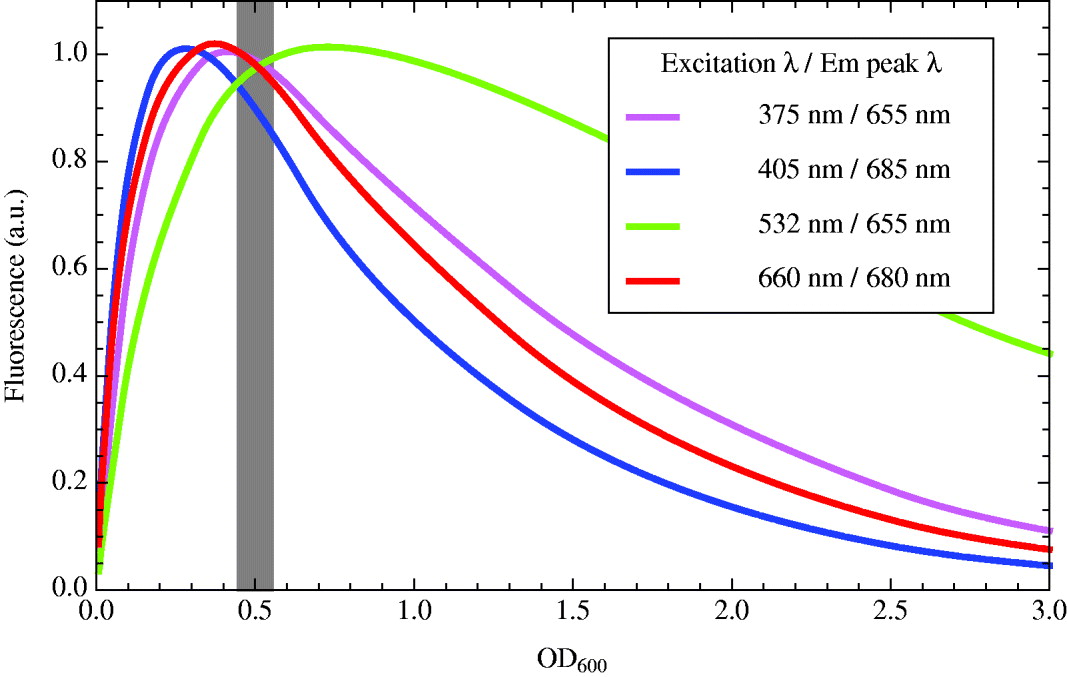
The first objective of this experimental procedure was to determine the optimum cell density that yields the greatest measurable emission from the different cellular fluorophores within Synechocystis. For each sample in the two-fold dilution series, four excitation wavelengths were used: 375, 405, 532 and 660 nm, and the emission spectrum recorded for each (data not shown here). These excitation wavelengths were selected as they represent the emission wavelengths provided by commonly available laser diodes suitable for a fluorescence instrument in the field, as explained later. The wavelength of the peak in each emission spectrum was noted, and the emission intensity at these peak wavelengths, for each of the four excitation light sources, is plotted against cell density in Fig. 3. The legend in Fig. 3 lists these peak excitation–emission pairs.
Intensity of the peak fluorescent emission of the cyanobacterium Synechocystis sp. PCC 6803 from excitation at 375 nm (UV; purple), 405 nm (blue), 532 nm (green), and 660 nm (red), as a function of optical cell density at 600 nm, OD600. The grey line indicates the optimum target cell density for measurable fluorescent emission thus selected here for experimental microbial samples. The graph legend lists the wavelength of the peak emission at each excitation wavelength.
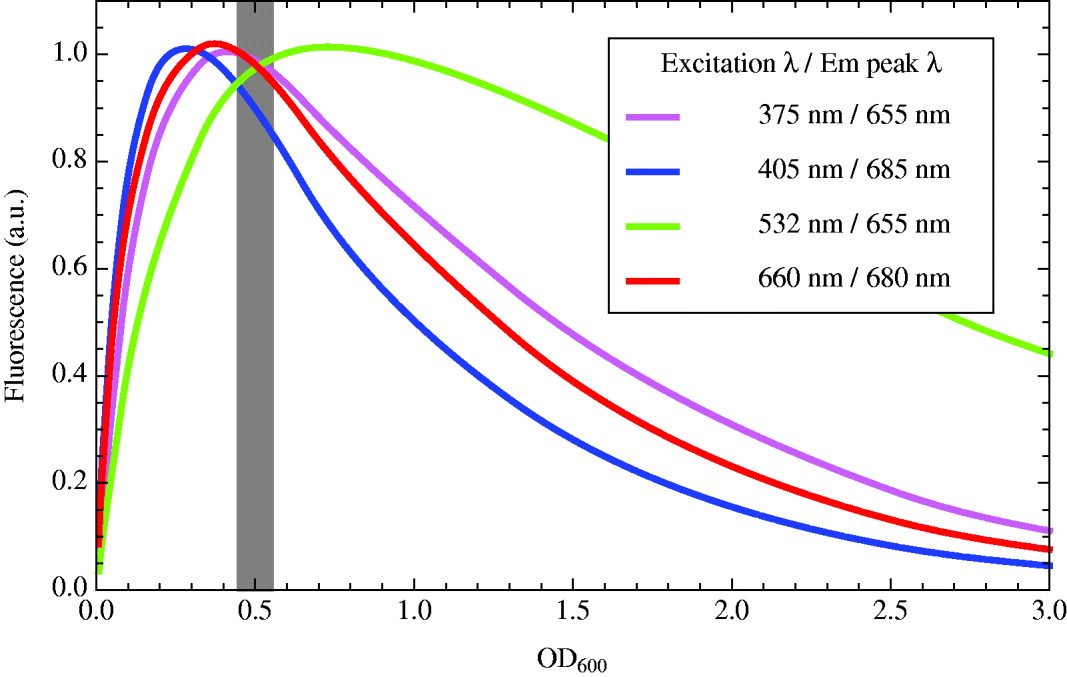
Figure 3 shows that, for the four excitation wavelengths tested here, the optimum population of Synechocystis cells for maximal measurable fluorescence intensity is between an OD600 of 0.25 and 0.75. A target OD for the experimental samples is thus selected as 0.5, as indicated with the grey line on Fig. 3.
To verify that the PBS dilution medium used for the heterotrophic test microorganisms and the BG11 autotrophic growth medium for Synechocystis do not exhibit disruptive fluorescence themselves, the excitation–emission response of these two media was tested. Figure 1 presents the EEMs produced for PBS and BG11. The rationale behind the range selected for the colour-coded emission intensity scale is given in the next section.
The EEMs recorded for these two blank controls exhibit several features that are important to appreciate before interpretation of the microorganism EEMs. The steepest diagonal band of intense emission is due to Raleigh scatter of the excitation wavelength from the liquid sample; it has a gradient on the EEM of 1. The second diagonal intense emission stripe is a second-order artefact of the spectrometer instrument. The diffraction-grating monochromator used to select the desired wavelength from the white light xenon source also permits the passage of multiples of the selected wavelength, producing the harmonic artefact with gradient of one half on the excitation–emission plot. A third-order effect is also visible in the very bottom-right-hand corner of the EEMs in Fig. 1.
The most important conclusion from these results, however, is that neither PBS nor BG11 exhibit any significant fluorescence of their own that may interfere with the recorded EEMs of the test organisms.
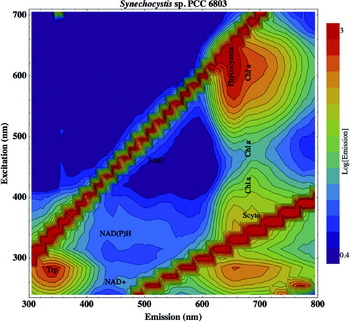
A final detail that requires determination before analysis of the test organism fluorescence is the numerical range for colour coding of the log-scale emission intensity in the EEMs. Figure 2 shows the histogram of emission intensities recorded across the complete grid of excitation–emission pairs for the Synechocystis sample (i.e., the EEM displayed in Fig. 4).
EEM generated for the cyanobacterium Synechocystis sp. PCC 6803. In addition to the small metabolite fluorophores, such photosynthetic organisms contain a variety of pigments that fluoresce at much longer wavelengths, seen as the column of emission peaks on the right hand side of the EEM. Abbreviations: Scyto, scytonemin; Chl a, chlorophyll a.

The histogram can be seen to possess three emission populations, each with a peaked distribution. The lowest population of emissions, peaking below 100.4 (2.5; arbitrary units) emission intensity, is due to noise in the readings. The most intense population, peaking at emission intensities greater than 103 (1000), is from the scattered excitation light and harmonic artefacts described above. In between, the central population shows a peak emission at around 100.9 (8) with a long tail towards brighter emission, and is due to the fluorescent response from the sample cyanobacteria. This is the biological signal of interest and so all EEMs displayed here are thus rainbow colour scaled between a log emission of 0.4 and 3.
Cellular fluorescence
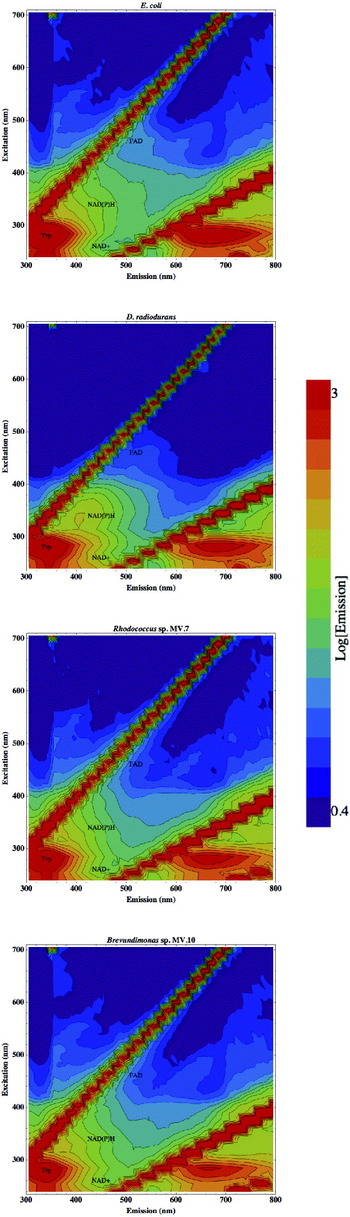
Figure 5 displays the EEMs generated by the four heterotrophic bacteria examined here, E. coli, D. radiodurans and the two Antarctic Dry Valley isolates Brevundimonas sp. MV.7 and Rhodococcus sp. MV.10.
EEMs of the four heterotrophic test bacteria, from top to bottom: E. coli, D. radiodurans, Brevundimonas sp. MV.7 and Rhodococcus sp. MV.10.

The brightest emission feature in all strains is seen in the bottom-left-hand region of the EEM. This is the emission from the amino acid tryptophan, which fluoresces brightly when bound within proteins. The intense tryptophan emission peak is centred on an excitation–emission wavelength pair (EEWP) of 280–340 nm, also written as 280/340 nm (Palmer et al. Reference Palmer, Keely, Breslin and Ramanujam2003). The wide emission peak centred on 680 nm, apparently resulting from UV excitation at around 280 nm, is artefactual. This feature in the bottom-right-hand corner of the EEMs lies within the excitation–emission triangle bounded by the harmonic of the primary excitation light, and is created by tryptophan emission being permitted through the detection monochromator at double the selected wavelength. For this reason, emission features beyond the excitation harmonic are ignored.
The EEMs displayed in Fig. 5 are also labelled at the EEWP of other cellular components known to fluoresce. The FAD is a metabolic coenzyme with a fluorescent peak around the EEWP coordinates 460/520 nm (Palmer et al. Reference Palmer, Keely, Breslin and Ramanujam2003). The NAD is another crucial small metabolite in terrestrial biochemistry, an electron-carrier that cycles between reduced (NADH) and oxidized (NAD+) states, with excitation–emission peaks of 340/450 and 260/450 nm, respectively. The closely related electron-carrier NAD phosphate only shows significant fluorescence in its reduced stated, NADPH, with very similar characteristics as NADH, at EEWP 340/450 nm.
All four bacteria in Fig. 5 can also be seen to exhibit fluorescence throughout a broad region of excitation–emission space, across a diagonal area from around 300/400 to around 450/550 nm, due to a diverse repertoire of other aromatic moieties within the cell. Such broad-wavelength biological fluorescence seen in river, lake or sea water samples is often termed humic fluorescence (e.g., Senesi et al. Reference Senesi, Miano, Provenzano and Brunetti1989; Klapper et al. Reference Klapper, McKnight, Fulton, Blunt-Harris, Nevin, Lovley and Hatcher2002; Alberts & Takács Reference Alberts and Takács2004; Ziegmann et al. Reference Ziegmann, Abert, Müller and Frimmel2010).
Of these four organisms, the one to apparently exhibit the most intense fluorescent response from proteinaceous tryptophan is E. coli. A possible explanation for this is that the E. coli cell genuinely contains more tryptophan than the other microorganisms studied, at least perhaps synthesizing more under the growth conditions used here. However, it is suggested that the more probable cause is that E. coli is not an environmental organism and contains no cellular pigmentation or UV-screening compounds, such as D. radiodurans and the Antarctic isolates Brevundimonas sp. MV.7 and Rhodococcus sp. MV.10. Consequently, UV light passes unabsorbed into the E. coli cell to excite a more intense intracellular fluorescence from tryptophan.
The organism studied here that shows most fluorescence detail in the generated EEM is the cyanobacterium Synechocystis sp. PCC 6803, as shown in Fig. 4.
Synechocystis is a photosynthetic organism, and as such possesses a number of pigments that fluoresce in addition to the small metabolite fluorophores within all terrestrial cells, as exemplified by the heterotrophs shown in Fig. 5. These additional fluorophores emit at longer wavelengths, mostly between 640 and 740 nm, and so appear as the column of emission humps along the right-hand side of the EEM in Fig. 4.
Scytonemin is apparent in the Synechocystis EEM as a fluorescent peak centred on EEWP 370/685 nm (Storrie-Lombardi Reference Storrie-Lombardi, Hoover, Levin and Rozanov2005). Scytonemin is a yellow–brown, lipid-soluble dimeric pigment based on indolic and phenolic subunits (Proteau et al. Reference Proteau, Gerwick, Garcia-Pichel and Castenholz1993), with strong absorption bands in UV-A (315–340 nm), ultraviolet biological (UV-B) (280–320 nm) and UV-C (190–280 nm), which is excreted by the cyanobacterium into extracellular sheaths to absorb UV wavelengths of light before they enter the cell. UV-A, while less energetic than UV-C and UV-B, is more abundant in the solar spectrum, and, if unattenuated, will penetrate more deeply into the cell to generate destructive reactive oxygen species (Garcia-Pichel Reference Garcia-Pichel1998). Scytonemin therefore provides cellular shielding against direct UV damage to DNA and proteins, photo-oxidation of the photosynthetic machinery, and production of intracellular reactive oxygen species (Latifi et al. Reference Latifi, Ruiz and Zhang2009).
Chlorophyll is the primary light-absorbing pigment for photosynthesis, and is located within photosystem protein complexes embedded in the thylakoid membrane of the cyanobacterial cell. Chlorophyll exhibits fluorescent emission at a wavelength peak of around 685 nm, but with excitation maxima at several wavelengths, and so appears on the EEM in Fig. 4 at EEWPs of 420/680 nm (Storrie-Lombardi Reference Storrie-Lombardi, Hoover, Levin and Rozanov2005), 480/680 nm and 605/680 nm (Ziegmann et al. Reference Ziegmann, Abert, Müller and Frimmel2010).
The phycobilisomes are involved in improving the efficiency of photosynthesis in cyanobacteria by acting as light-collecting antenna and passing the gathered excitation energy onto chlorophyll and thence to the photosynthetic reaction centres. Phycobilisomes are large protein complexes that diffuse around the cytosolic surface of the thylakoid membrane, but are often associated with the photosystem complexes (Glazer Reference Glazer1985; Packer & Glazer Reference Packer and Glazer1988; MacColl Reference MacColl1998). The core of the phycobilisome is composed of allophycocyanin, surrounded by a radiating fan of six rods of phycocyanin (in Synechocystis; Ajlani et al. Reference Ajlani, Vernotte, DiMagno and Haselkorn1995), which exhibit fluorescence on the EEM with an emission peak of slightly shorter wavelength than chlorophyll, at 615/650 nm (Storrie-Lombardi Reference Storrie-Lombardi, Hoover, Levin and Rozanov2005, and references therein).
In summary, photosynthetic microorganisms, such as the cyanobacterium Synechocystis analysed here, exhibit the same emission features from small metabolite fluorophores as any other cell, but also a broad range of intense fluorescent signals from pigments at much longer wavelengths. They provide a greater variety of detectable fluorescent biosignatures, and respond to a broader range of excitation wavelengths.
Mars mission light sources and imaging filters
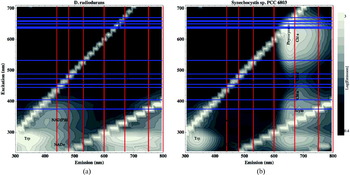
A particular consideration for the use of epifluorescence in a life-detection instrument in environments such as the Martian surface is the most appropriate selection of excitation wavelength or wavelengths to employ. Figure 6 replots the EEM of both heterotrophic and photosynthetic model organisms, Deinococcus and Synechocystis genera, overlaid with pertinent excitation and emission wavelengths.
The EEM of the heterotrophic D. radiodurans (a) and photoautotrophic Synechocystis sp. PCC 6803 (b) replotted in greyscale with pertinent excitation and emission wavelengths shown. Horizontal blue lines indicate wavelengths available from laser diode light sources (see main text); vertical red lines indicate centre wavelength of filters on the PanCam imaging system of ExoMars (440, 480, 530, 600, 670, 750 and 800 nm; Griffiths et al. Reference Griffiths, Coates, Jaumann, Michaelis, Paar, Barnes, Josset and the PanCam2006).

The vertical red lines indicate the peak transmission wavelengths of the optical filters proposed for the ExoMars stereo PanCam filter wheel. This imaging system incorporates a pair of wide-angle cameras (based on Beagle 2 heritage; Griffiths et al. Reference Griffiths, Coates, Josset, Paar, Hofmann, Pullan, Rüffer, Sims and Pillinger2005), each composed of a charge-coupled detector (CCD) sensitive over the spectral range 400–1000 nm, 65° field-of-view lens and a filter wheel module containing 12 narrow bandwidth interference coated filters. These filters are centred on wavelengths: 440, 480, 530, 600, 670, 750 and 800 nm, and have pass bands of between 17 and 28 nm (Griffiths et al. Reference Griffiths, Coates, Jaumann, Michaelis, Paar, Barnes, Josset and the PanCam2006). These imaging filter wheel wavelengths are not idiosyncratic to Beagle 2/ExoMars PanCam, but are very similar to those selected for Pathfinder (Smith et al. Reference Smith1997), the twin Mars Exploration Rovers (Bell et al. Reference Bell2003) and the Mars Science Laboratory (Malin et al. Reference Malin2005) missions.
It can be seen in Fig. 6 that several of the PanCam filters, selected primarily for geological spectroscopy, also have appropriate wavelengths for detecting biological fluorescence. The 440 and 480 nm filters are well-placed for picking up the broad humic-like emission, and the 440 nm filter in particular will allow imaging of fluorescence from NAD+ and NAD(P)H cellular metabolites. The right-hand image of Fig. 6 displays the fluorescence signature of cyanobacteria, and shows that the 680 nm filter is well-tuned for imaging emission from the photosynthetic machinery. Scytonemin, chlorophyll a and phycocyanin all exhibit fluorescence peaks close to this wavelength.
The horizontal blue lines on Fig. 6 indicate the emission wavelength available laser diodes that can be utilized in portable epifluorescence detection instrumentation. These are available at 375, 405, 445, 455, 473, 488, 532, 635, 638, 640, 650, 658, 660 and 670 nm (Nichia; Sanyo). The 660 and 532 nm laser diodes are common within red and green laser pointers, respectively, and the 405 nm laser diode is used in Blu-Ray DVD players. It can be seen in Fig. 6 that there is not an even distribution of excitation wavelengths, and those wavelengths available are not ideal for maximal excitation of a fluorescent response from the cellular components of a heterotrophy-like Deinococcus or the pigments of photosynthetic cyanobacteria. Although an excitation light source of around 340 nm would be ideally placed for driving humic-like fluorescence, these EEMs show that a 375 nm laser diode may also excite a detectable response. At 375 nm scytonemin fluorescence is also excited, and 405 nm reveals chlorophyll, so either of these laser diode wavelengths would be desirable for fluorescent biosignature instrumentation. Both the 532 and 635 nm laser diodes miss the peak excitation of phycocyanin and chlorophyll fluorescence around 660 nm, and a light source exciting nearer 600–620 nm would be preferable.
It would be of great utility if a rover-based system could excite tryptophan and nucleic acid fluorescence. Considerable effort is currently underway to produce both laser diodes and broadband light-emitting diodes (LEDs) that emit at wavelengths below 300 nm. While the task remains difficult for laser diodes, recent advances in LED manufacturing have resulted in the appearance of 230–270 nm LEDs (Hirayama et al. Reference Hirayama, Yatabe, Noguchi and Kamata2010) that are now appearing in microbe containment roles (Chatterly & Linden Reference Chatterley and Linden2010), an application of considerable interest for forward and backward planetary protection efforts.
There also exists the possibility of utilizing the solar spectrum on Mars as a fluorescence excitation light source. UV-A (315–400 nm) and UV-B (280–320 nm) wavelengths reach the Martian surface at high flux (Cockell Reference Cockell2000) and would cause autofluorescence of sunlit biomolecules. This high UV flux would be expected to rapidly photobleach any fluorescence, so measurements would be needed of freshly exposed substrate. This could constitute mineral surface newly revealed by a rock abrasion tool, and so potentially uncovering endolithic microbial communities, or material brought to the surface by a drill, such as that aboard the ExoMars rover (Vago et al. Reference Vago, Gardini, Kminek, Baglioni, Gianfiglio, Santovincenzo, Bayon and van Winnendael2006). Multispectral imaging of the same fresh target in direct sunlight, and then shadowed, would allow image comparison and identification of fluorescent emission. The body of the rover itself could be repositioned slightly to cast its shadow over the target area to perform the dark follow-up imaging. In this way, the solar spectrum could be used to excite both the humic-like fluorescence between about 400 and 500 nm and larger photosynthetic pigments. Images can also be acquired across time to detect both fluorescence enhancement and diminution as a result of photodegradation (see below) of organisms newly exposed to the full surface radiation. The peak tryptophan emission at 340 nm (see Fig. 6) would not be detectable by the PanCam system, as it falls beneath the shortest wavelength of sensitivity of the CCDs (Griffiths et al. Reference Griffiths, Coates, Jaumann, Michaelis, Paar, Barnes, Josset and the PanCam2006). However, it should be noted that the emitted tryptophan fluorescence will act as a UV-A excitation source capable of inducing a fluorescence response in larger cellular metabolites, such as the FAD and NADH, whose emissions do appear in the blue portion of the spectrum accessible to the current generation of PanCam CCDs.
Cellular degradation by UV-C
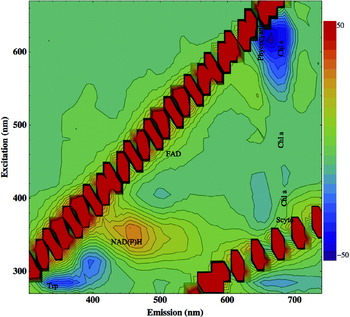
The sensitivity of this analysis technique to changes in organism fluorescence induced by UV exposure was also studied. Figure 7 displays the difference in emission measured between a sample of Synechocystis exposed to 254 nm UV-C for four hours and the unirradiated control. Such illumination was selected as it emulates the short-wavelength UV region of the solar spectrum penetrating to the present-day Martian surface (Patel et al. Reference Patel, Zarnecki and Catling2002; Ronto et al. Reference Ronto, Berces, Lammer, Cockell, Molina-Cuberos, Patel and Selsis2003). However, as this constitutes a preliminary study into the effects of short-wavelength UV light and the consequent relative degradation of different cyanobacterial fluorophores, no attempt was made to more precisely recreate the solar spectrum on the Martian surface or correlate the total fluence received to exposure times on the Martian surface under different atmospheric scenarios (such as variable dust loading) or diurnal or seasonal variability.
EEM showing the change in fluorescence exhibited by Synechocystis sp. PCC 6803 cyanobacteria after four hours exposure to 254 nm UV-C radiation. Emission change is plotted on a linear scale from a decrease of −50 (arbitrary units; blue) to an increase in fluorescence of +50 (red); green colour coding signifies no change.

The scale used in Fig. 7 is linear, and ranges from blue, indicating a large decrease in fluorescence after UV irradiation, to red, indicating a large increase in fluorescence, and green, signifying no change. The greatest change in the fluorescence response of the cyanobacterial cells can be seen to be exhibited by the phycocyanin and chlorophyll a emission peak at excitation–emission coordinates on the EEM of 620/660 nm. A decrease in measured emission of around 30 (arbitrary units) equates to a fluorescence reduction of 10% of this photosynthetic biosignature. A smaller reduction in emission is seen in protein-bound tryptophan, with an absolute decrease of 15 arbitrary units equating to a 6% drop in fluorescence.
The UV irradiation also results in a note-worthy increase in fluorescence. The EEM plotted in Fig. 7 shows enhancement of fluorescence over a broad hump centred at 350/460 nm, within the region commonly attributed to humic fluorescence. This region of the EEM exhibits an emission increase of around 30 (arbitrary units), equating to a percentage increase from the unexposed control of almost 150%. This is not believed to be due to an increase in NAD(P)H within the cyanobacteria, but an accumulation of intracellular degradation products with aromatic moieties produced by the UV radiation.
The discovery of such a marked proportional increase in humic-like fluorescent emission after UV irradiation has important implications for the use of fluorescence surveying as a means of biosignature detection on Mars. The Martian surface environment is characterized by a high flux of UV radiation, as the planet is generally unshielded by an ozone layer or photochemical haze, and exposed surface microorganisms could be expected to have experienced a degree of UV photodegradation. Thus, the enhancement of the emission feature centred at 350/460 nm presents a particularly interesting fluorescence signal to target for future fluorescence-based biosignature detection. Such a fluorescent feature could be targeted by excitation from a laser diode at 375 nm, and detected using either the 440 or 480 nm PanCam filters. Alternatively, successive sunlit and shadowed multispectral images of a freshly exposed sample, as discussed above, could be used to detect this increasing fluorescent signal from accumulating degradation products.
Conclusions
It has been demonstrated that excitation–emission matrices (EEMs) provide a sensitive and detailed assessment of the fluorescence response from a diverse selection of environmental and extremophilic microorganisms, revealing emission from both small molecule metabolites present in all terrestrial cells and the UV-screening and photosynthetic pigments of cyanobacteria. E. coli was found to exhibit the most intense fluorescence response from protein-bound tryptophan, presumably due to the absence of UV-screening pigmentation. Cyanobacteria contain a number of pigments fluorescing at longer wavelengths that are responsive to a broad range of excitation wavelengths.
Furthermore, fluorescence spectroscopy is sensitive to intracellular changes in the organism, such as physiological adaptation revealed by NAD+ and NADH cycling, and biomolecule photodegradation by UV-C radiation. Fluorescence analysis over broad ranges of excitation and emission wavelengths can identify the most promising fluorescence peaks in excitation–emission space to target for biosignature detection by field instrumentation, using mono-wavelength laser or laser-diode excitation light sources and narrow-band filters on optical detectors. Detecting fluorescence excited by solar UV radiation in freshly exposed surface samples, imaging when both sunlit and shadowed, perhaps by the body of the rover itself, is also an important possibility to consider.
The best combination of available laser diodes and PanCam filters proposed aboard the ExoMars probe are a 375 nm source exciting humic-like cellular emission and scytonemin fluorescence, detected by the 440/480 and 670 nm PanCam filters respectively, or a 405 or 635 nm wavelength exciting chlorophyll fluorescence detectable through the 670 nm filter.
Such understanding is crucial for ensuring the best chances of detecting evidence of surface life on Mars with the rapid surveying or triaging capabilities of an epifluorescence imaging instrument. A particular consideration is the manner in which the fluorescence signature of microorganisms may be degraded or modified by the Martian surface environment of unfiltered solar UV spectrum, cosmic ray ionizing radiation flux and oxidizing surface conditions.
Acknowledgements
LRD is supported by the UCL Institute for Origins post-doctoral research associateship funding. MCSL is supported by the Kinohi Institute, Inc., Pasadena, California.