Introduction
In the recent decades, the rate of sow culling has increased to levels close to 50% per year. Reproductive problems, such as not cycling or conceiving, poor numeric productivity and leg conformation in young sows, are the major reasons for this increase in the culling rate (Dial and Koketsu, Reference Dial and Koketsu1996; Friendship et al., Reference Friendship, Wilson, Almond, McMillan, Hacker, Pieper and Swaminathan1996). This reduction in sow longevity impairs animal welfare (Barnett et al., Reference Barnett, Hemsworth, Cronin, Jomgman and Hutson2001; Engblom et al., Reference Engblom, Lundeheim, Dalin and Andersson2007) and results in a high turnover of sows, with substantial economic and sanitary implications.
Proportional hazard models (Cox, Reference Cox1972) were adapted to animal breeding by Ducrocq et al. (Reference Ducrocq, Quaas, Pollak and Casella1988). These models treat survival traits as continuous variables and are the preferred statistical method for analyzing failure time data, as they allow the inclusion of both censored and uncensored records (Allison, Reference Allison1995). This methodology has already been used to investigate sow survival with promising results (Yazdi et al., Reference Yazdi, Lundeheim, Rydhmer, Ringmar-Cederberg and Johansson2000b; Tarrés et al., Reference Tarrés, Tibau, Piedrafita, Fabrega and Reixach2006b), although survivability has often been defined in quite a broad sense. It should also be added that relatively little is known about peculiarities of specific causes of sow failure. The cause-specific influence of different covariates on sow longevity can be easily analyzed with a proportional hazards model using a competing risk approach (Kalbfleisch and Prentice, Reference Kalbfleisch and Prentice1980; Iversen et al., Reference Iversen, Parmigiano, Berry and Schildkraut2000). When a specific cause of death or culling is analyzed and null correlations between culling reasons can be assumed, longevity records for sows failing under alternative causes must be treated as censored, assuming no correlations between culling reasons.
Our studies were based on longevity records of 587 Duroc sows, with specific emphasis on the influence of leg and teat conformation defects. The objective of this research was to separately analyze different causes of sow failure under standard farm management: (a) death during productive life, (b) voluntary culling due to low productivity (LP) and (c) voluntary culling due to low fertility (LF), and to assess the influence of different covariates on sow longevity by competing risks analyses.
Material and methods
Animal Care and Use Committee approval was not mandatory for this study because the data were recorded under standard farm management without additional requirements. Leg and teat conformations were evaluated without any contact with the sows (visual evaluation) and without moving them out of the growing pen (gilts) or farrowing crate (farrowing sows).
Field data and leg and teat conformation scores
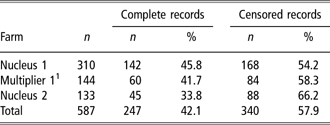
Longevity records from 587 purebred Duroc sows monitored from December 2004 through January 2007 were used in this study. Sow longevity was defined as the time interval between the first fertile mating until culling or death (complete record), whereas records for sows still alive at the end of the data collection period were treated as censored (Cox, Reference Cox1972). Data were obtained from two different nucleuses, one of which had a multiplier stage (Table 1), registered in the Associación Nacional de Criadores de Porcino Selecto (ANCPS; http://www.anps.es) and located in the north-east region of Spain. These sows were housed in commercial installations and managed under standard farm conditions. More specifically, sows were mated by AI and penned in gestation crates up to 10 days before farrowing. After that, they were moved to standard farrowing crates in climate-controlled rooms (24°C) with heating plates for piglets (38°C). Suckling period extended 21 days on average. Feeding of sows was restricted during the gestation period and ad libitum during lactation. For all sows, backfat thickness was measured at the end of the growing period (6 months of age) as the average of two ultrasonic measurements (Piglog 105; SFK®Technology, Herlev, Denmark) taken on each side of the spinal column, 5 cm from the mid-dorsal line at the position of the last rib (Noguera et al., Reference Noguera, Varona, Babot and Estany2002). All productive records were registered from December 2004 to January 2007 (e.g. dates of mating, farrowing and weaning, number of piglets born and weaned).
Number of sows (n) from each nucleus that took part in the project and complete and censored records
1The animals from Multiplier 1 farm grew in Nucleus 1 farm.
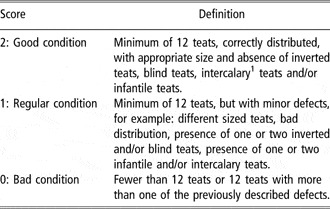
Leg and teat conformation of sows was assessed following Fernàndez de Sevilla et al. (Reference Fernàndez de Sevilla, Fabrega, Tibau and Casellas2008) at three different stages: end of the growing period, first farrowing and second farrowing. Overall leg conformation was scored as 0 (bad conformation), 1 (regular conformation) and 2 (good conformation), depending on the presence or absence of specific morphological defects (see below) and their severity. This evaluation followed the standard procedure defined by ANCPS and, although suffered from a certain degree of subjectivity, it allowed for a direct characterization of leg conformation in a broad sense. Additionally, sows were evaluated for the presence or absence of six different leg morphological defects: excessive or abnormal hoof growth (overgrowth or curved, cracked or unequal growth of hoof wall), splayed feet (leg curves outwards at the carpal or tarsal articulations), plantigradism (sow walking or standing with pastern completely or partially touching the ground), straight pastern (hoof and pastern describing a close to 180° angle), sickle-hooked leg (excessively angled hock moving rear feet forward) and the presence of bumps or injuries in legs (presence of bumps, open injuries or inflammatory processes in legs). Note that all these specific defects were scored on a dichotomous scale (presence or absence) and that a given gilt/sow could be affected by more than one of these defects at the same time. Morphologic assessment of teat condition score is shown in Table 2. All these morphological evaluations were performed by the same trained technician.
Assessment of teat condition score

1Little-sized teat (functional or not) placed between two regular teats.
Death and culling causes
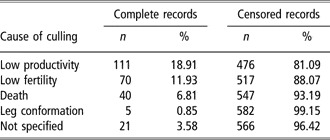
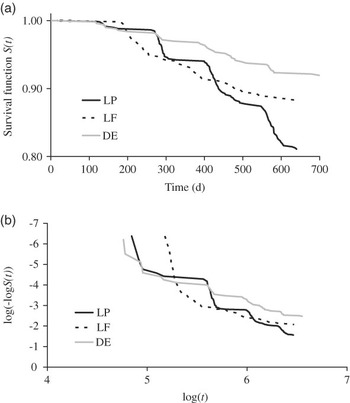
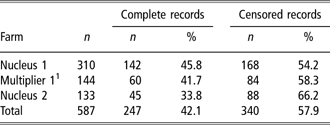
The culling criteria were the same throughout the experiment and were grouped as: (a) LP (18.91%; fewer than four weaned piglets in first and second farrowings or fewer than an average of 7.5 piglets in the third and subsequent parturitions), (b) LF (11.93%; unpregnant sows after two successive heats), (c) death during productive life (DE; 6.81%), (d) bad leg conformation (0.85%) and (e) not specified (3.58%). After editing, our database included 247 complete records (42.08%) and 340 censored records (57.92%). Given the low incidence of sows culled due to bad leg conformation and unspecified causes (Table 3), competing risk analyses were only performed for the LP, LF and DE causes of sow failure. Survival functions are shown in Figure 1a. Note that data sets for competing risk analyses showed a high censoring percentage, similar to the values reported in other analyses (Casellas et al., Reference Casellas, Noguera, Varona, Sánchez, Arqué and Piedrafita2004 and Reference Casellas, Casas, Piedrafita and Manteca2005; Tarrés et al., Reference Tarrés, Casellas and Piedrafita2005). Although this phenomenon implies a partial loss of information and reduced analytical power, the obtained estimates must be bias free if null correlation holds between culling causes (Allison, Reference Allison1995).
Number and percentage of complete and censored data relating to the different causes of culling

Kaplan–Meier survival functions (S(t) (a) and logarithms test (b) for low productivity (LP), low fertility (LF) and death during productive life (DE) causes of sow failure.

Competing risk analyses
We performed competing risk analyses by fitting the proportional hazard model with appropriate censoring criteria (Dürr et al., 2002). For a given cause of failure, longevity records for sows that were culled or died due to other causes were treated as censored, following the latent variable approach (Iversen et al., Reference Iversen, Parmigiano, Berry and Schildkraut2000). Sow survival was analyzed under the following semi-parametric proportional hazards model:

where h(t|xw) was the hazard function of the wth individual at time t conditioned to the appropriate incidence of systematic effects (xw), h 0(t) was the baseline hazard function, and exp (xwβ) was a stress-dependent including regression coefficients (β). The standard Weibull assumption for h 0(t) was discarded by the logarithms test (Ducrocq et al., Reference Ducrocq, Quaas, Pollak and Casella1988) on the Kaplan–Meier (Kaplan and Meier, Reference Kaplan and Meier1958) estimate of the survival function (see Figure 1b). If the Weibull process holds in longevity data, a straight line is expected when plotting log(−log(S KM(t))) against log(t).
For each cause-specific analysis, four time-independent effects were included in the preliminary model: year at the first farrowing (2005 or 2006), farm of origin, backfat thickness at 6 months of age (categorized with cut-off points at 16 and 19 mm, following in part (Tarrés et al., Reference Tarrés, Bidanel, Hofer, Rosendo and Ducrocq2006a)) and the linear and quadratic effects of age at first farrowing. Preliminary models also included three time-dependent effects: the number of piglets born alive, and teat and leg-conformation scores modeled as time-dependent covariates that could change at the first two parities. Two different models were defined for leg conformation in order to avoid redundancies and linear combinations between leg-conformation-related effects. The first model only considered overall leg conformation (general model), while the second model tested all the specific leg defects (specific model) without including overall leg conformation. Following Fernàndez de Sevilla et al. (Reference Fernàndez de Sevilla, Fabrega, Tibau and Casellas2008), a stepwise-like approach was adopted to determine the significant covariates influencing sow longevity for each cause-specific analysis. Levels of significance equal to or lower than P ⩽ 0.1 were assumed, in order to account for the loss of statistical power due to the high percentage of censored records. At each round, all remaining covariates were independently tested using likelihood ratio tests, and only the most significant was added to the operational model. After this preliminary process, significant effects included in the specific model were hoof growth, plantigradism, presence of bumps or injuries, year at first farrowing, farm of origin, backfat thickness, piglets born alive and teat condition in LP analysis, hoof growth, sickle-hooked leg, presence of bumps or injuries, year at first farrowing, farm of origin, age at first farrowing and piglets born alive in LF analysis, and year at first farrowing in DE analysis. As shown in Table 4, General models included the same significant effects except for leg-conformation-related effects, which were substituted by the overall leg-conformation effect. These models were expanded to sire frailty models following Ducrocq and Casella (Reference Ducrocq and Casella1996). For these 587 purebred Duroc sows, pedigree was extended up to four previous generations, including 31 sires with daughters with longevity data. Heritabilities for each specific cause of sow failure were calculated by formulas developed by Ducrocq (2001), Yazdi et al. (Reference Yazdi, Visscher, Ducrocq and Thompson2002) and Tarrés et al. (Reference Tarrés, Casellas and Piedrafita2005). All computations were performed using the Survival Kit package (Ducrocq and Sölkner, Reference Ducrocq and Sölkner1998).
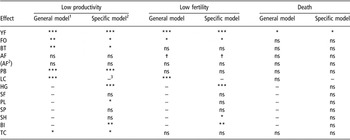
Significance levels for each effect, specific reason for culling and model

†P < 0.10; *P < 0.05; **P < 0.01; ***P < 0.001; ns = not significant; – = not tested.
YF = year of first farrowing; FO = farm of origin; BT = effect of backfat thickness at 6 months of age; AF and (AF2) = linear and quadratic effect of the age at first farrowing; PB = piglets born alive; LC = leg condition score; HG = over or abnormal hoof growth; SF = splayed feet; PL = plantigradism; SP = straight pastern; SH = sickle-hooked leg; BI = presence of bumps or injuries to legs; TC = teat condition score.
1Model testing LC and excluding the six specific leg conformation defects.
2Model testing HG, SF, PL, SP, SH and BI and excluding LC.
3This effect was not considered in the model.
Results
Phenotypic description of survival data
During the first reproductive cycle, the culling percentages due to LP, LF and DE causes were 1.19%, 5.62% and 2.39%, respectively, whereas these percentages changed to 4.31%, 3.43% and 1.57% in the second reproductive cycle. During the following reproductive cycles, these percentages were 14.23% (LP), 3.36% (LF) and 3.01% (DE). Note that LP culling increased in the third and following reproductive cycles because the culling criteria became more stringent (see above). Kaplan–Meier non-parametrical survival functions for each cause of sow failure are shown in Figure 1a. The survival curve for the LP data set started to decline 127 days after the first fertile mating. The descent followed a cyclic pattern with reductions every 130 to 160 days. The survival curve for LF analysis showed a progressive decline starting 180 days after the first fertile mating, whereas the DE survival curve showed a pattern similar to that of the LP-specific plot, although the first descent in survival probability appeared 120 days after the first fertile mating and subsequent descents in survival probability were smaller. Survival curves were plotted until day 700, because data were collected over a 2-year period.
Competing risks analyses
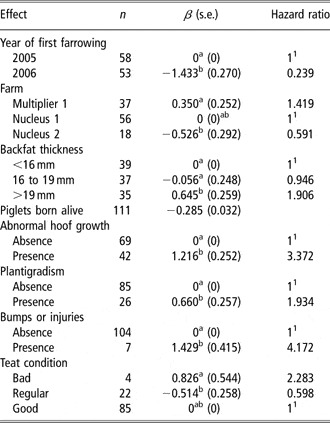
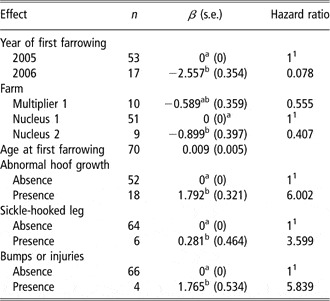
The statistical significances of all the systematic effects for each cause-specific competing risk analysis are summarized in Table 4. Year at first farrowing can be viewed as a batch effect and affected sow survival in all three competing risk analyses (P < 0.001 for LP and LF and P < 0.05 for DE), whereas farm of origin only influenced sow longevity for LP (P < 0.01) and LF (P < 0.05) culling causes. For the LP-specific analysis (see Table 5), survival increased with the number of piglets born alive (P < 0.001), and with backfat thickness values of less than 19 mm (P < 0.05). It was observed that a bad teat condition increased the risk of elimination with a hazard ratio (HR) of 2.283 (P < 0.05), while there were no significant differences (P > 0.1) between regular and good teat condition. For the LF-specific analysis (see Table 6), age at first farrowing tended to increase culling risk (P < 0.1).
Number of sows culled (n), regression coefficient (β) and hazard ratio for significant effects included in the specific model for the low productivity-specific analysis

Estimates with the same letter in the superscript did not differ significantly.
1Reference level.
Number of sows culled (n), regression coefficient (β) and hazard ratio for significant effects included in the specific model for the low fertility-specific analyses

Estimates with the same letter in the superscript did not differ significantly.
1Reference level.
Leg conformation did not influence sow survival for DE competing risk analysis (P > 0.1). The overall leg-conformation score had a major influence on sow survivability in LP and LF-specific analyses (P < 0.001). The minimum HR was associated with a score of 2 (0.342 and 0.246, respectively; well-conformed sows) and the maximum HR was related to a leg-conformation score of 0 (1.013 and 4.366, respectively; poorly conformed sows). When specific models were considered (Tables 5 and 6), sow survival decreased with abnormal hoof growth (HR = 3.372 and 6.002, respectively, P < 0.001), and bumps or injuries in legs (HR = 4.172 and 5.839, respectively, P < 0.01). Plantigradism only reduced survival in the LP-specific analysis (HR = 1.934, P < 0.05), while sickle-hooked leg (HR = 3.599, P < 0.05) impaired sow survival in the LF-specific analysis.
Genetic source of variation
The genetic variances between sires (σ 2) were, respectively, 0.010 and 0.035 for LP and LF competing risk analyses. Depending on the definition applied, these estimates provided respective heritabilities of 0.024 and 0.083 (Ducrocq, 2001), 0.008 and 0.017 (Yazdi et al., Reference Yazdi, Visscher, Ducrocq and Thompson2002), and 0.008 at 640 days and 0.017 at 645 days on the binary scale, respectively (Tarrés et al., Reference Tarrés, Casellas and Piedrafita2005).
Discussion
Kaplan–Meier survival function and censoring percentage
The competing risk approach is of particular interest in the study of causes of disposal in swine, where a cause-specific differential survival pattern could be anticipated. As expected, survival probability decreased beyond 130 days after the first mating for the LP data set and showed a cyclic pattern with 130 to 160 days of periodicity due to the fact that culling decisions were taken at the weaning date. On the other hand, the survival curve for the LF data set showed a smoother trend, probably because culling was decided after two successive unpregnancies and, therefore, those sows were desynchronized with the remaining individuals. As suggested in Figure 1a, culling percentage due to LF seemed more relevant for the second and third farrowings, whereas LP became more important after the third farrowing, approximately 400 days after the first effective mating. With the exception of extreme cases, farmers only cull sows because of LP after the third farrowing, which was in line with other research findings (Yazdi et al., Reference Yazdi, Rydhmer, Ringmar-Cederberg, Lundeheim and Johansson2000a) that described an increase in the effect of litter size on sow survival with the parturition number. This evolution over time for the effect of different factors influencing sow survival has also been reported by Dijkhuizen et al. (Reference Dijkhuizen, Krabbenborg and Huirne1989) and Tarrés et al. (Reference Tarrés, Tibau, Piedrafita, Fabrega and Reixach2006b). Reproductive problems and pathologies related to farrowing (data not shown) were the main cause of failures in the DE data set, corroborating the cyclic pattern shown by the survival curve at 130- to 160-day intervals.
Given the relatively short time-period analyzed (2 years), 57.9% of the sows were still alive at the end of the data collection (Table 1). This peculiarity led to high censoring percentages when competing risk analyses were performed. More specifically, censoring percentage ranged between 81.09% (LP) and 93.19% (DE), these values being clearly higher than the censoring percentages reported in other studies that focused on sow longevity (Tarrés et al., Reference Tarrés, Bidanel, Hofer, Rosendo and Ducrocq2006a and Reference Tarrés, Tibau, Piedrafita, Fabrega and Reixach2006b) although similar (Casellas et al., Reference Casellas, Noguera, Varona, Sánchez, Arqué and Piedrafita2004, Reference Casellas, Casas, Piedrafita and Manteca2005 and Reference Casellas, Caja, Such and Piedrafita2007) or smaller (Tarrés et al., Reference Tarrés, Casellas and Piedrafita2005) than the ones obtained in young pigs or other species. Note that the analytical power of survival analysis substantially depends on censoring percentage (Vukasinovic et al., Reference Vukasinovic, Moll and Künzi1999; Yazdi et al., Reference Yazdi, Visscher, Ducrocq and Thompson2002). Under random and non-informative censoring, biases are not expected (Allison, Reference Allison1995).
Performance traits
Analyses were performed on data collected from two nucleuses and one multiplier farm (see above). Given the peculiarities of this kind of farms, our results could not be completely extrapolated to commercial farms, although they must be viewed as estimates close to the right effect under commercial conditions. Moreover, the farm-of-origin effect was accounted for by the model and therefore the estimates obtained on leg-conformation effects or other systematic or random sources of variation must be free from biases due to the management policies and environment of each farm. The short time-period analyzed (2 years) also allowed attenuating the potential effect of more strict culling criterions of selection farms. As was expected, sow survival increased with the number of piglets born alive in the LP competing risk analysis, given its close relation to the number of weaned piglets. Note that litter size-related factors were revealed as one of the most important sources of variation influencing sow longevity in previous studies (Friendship et al., Reference Friendship, Wilson, Almond, McMillan, Hacker, Pieper and Swaminathan1996; Yazdi et al., Reference Yazdi, Rydhmer, Ringmar-Cederberg, Lundeheim and Johansson2000a; Tarrés et al., Reference Tarrés, Bidanel, Hofer, Rosendo and Ducrocq2006a). Sows with backfat thickness of more than 19 mm at the end of the growing period showed a higher risk of culling due to LP. The optimal interval in this Duroc population was 16–19 mm although non-significant differences were observed for values below 16 mm (Table 5). This interval fits with the results reported by Tarrés et al. (Reference Tarrés, Tibau, Piedrafita, Fabrega and Reixach2006b), although they registered backfat thickness at first farrowing (Fernàndez de Sevilla et al., Reference Fernàndez de Sevilla, Fabrega, Tibau and Casellas2008). These results suggest a positive association between backfat thickness and sow survival (Tholen et al., Reference Tholen, Bunter, Hermesch and Graser1996; Lopez-Serrano et al., Reference Lopez-Serrano, Reinsch, Looft and Kalm2000; Tarrés et al., Reference Tarrés, Tibau, Piedrafita, Fabrega and Reixach2006b), although excessive backfat thickness could impair reproductive performance in Duroc sows (Hetzer and Miller, Reference Hetzer and Miller1973) and therefore increase the culling rate due to LP. In order to optimize sow longevity, backfat thickness in Duroc sows must therefore be monitored at the end of the growing period, avoiding values not only of less than 16 mm, as previously suggested by Tarrés et al. (Reference Tarrés, Tibau, Piedrafita, Fabrega and Reixach2006b), but also those greater than 19 mm. Although backfat thickness was only measured at the end of the growing period in this study, additional measurements during sow reproductive life could be very useful to supervise fat reserves and optimize them in terms of sow survival.
Sow survival increased with lower age at first farrowing in the LF-specific analyses. Schukken et al. (Reference Schukken, Burman, Huirne, Willemse, Vernooy, van den Broek and Verheijden1994) hypothesized that gilts with an inherent problem of fertility became pregnant at older ages and therefore suffered a greater risk of culling. Sterning (1996) also demonstrated that gilts that reached puberty at a later age had longer intervals from weaning to estrus and a greater risk of not coming on heat than those reaching puberty at a younger age. On the other hand, Yazdi et al. (Reference Yazdi, Rydhmer, Ringmar-Cederberg, Lundeheim and Johansson2000a) reported an increase of death risk with heavier gilts at first insemination, which may be related to older gilts at first insemination and therefore longer ages at first farrowing. According to our results, it would therefore be recommendable to select gilts that reach puberty earlier in order to increase overall longevity.
Leg and teat conformation
Under the general model, overall leg-conformation score influenced sow longevity in LP and LF-specific analyses, as described by Lopez-Serrano et al. (Reference Lopez-Serrano, Reinsch, Looft and Kalm2000), Serenius and Stalder (Reference Serenius and Stalder2004), Tarrés et al. (Reference Tarrés, Bidanel, Hofer, Rosendo and Ducrocq2006a) and Fernàndez de Sevilla et al. (Reference Fernàndez de Sevilla, Fabrega, Tibau and Casellas2008) for overall sow survival. Note that longevity records from sows culled due to severe leg-conformation problems were treated as censored in these analyses (less than 20% of sows showed a bad leg conformation after the first and second farrowings), and even so, leg conformation had a relevant influence on LP and LF culling. Some effects showed large standard errors due to the small number of complete records contributing to each level. Although biases related to a high censoring percentage cannot be anticipated (Allison, Reference Allison1995), these estimates must be taken with caution given that they suffer from a reduced reliability. Within this context, the significant effect of leg conformation in LP and LF analyses could be viewed as an indirect mechanism that impaired sow performance through two ways: (a) influence of stress, anxiety and pain originated by abnormal conformations and injuries in legs (Gregory, Reference Gregory2004) and (b) limited access to resources (food and water) due to mobility problems (Fernàndez de Sevilla et al., Reference Fernàndez de Sevilla, Fabrega, Tibau and Casellas2008). These perturbations would tend to reduce sow fertility and its capacity to rear piglets. This overall leg-conformation score suffered from a certain degree of subjectivity (Fernàndez de Sevilla et al., Reference Fernàndez de Sevilla, Fabrega, Tibau and Casellas2008), although it allowed for a straightforward characterization of sow conformation without invasive handling and easily carried out by the farmer. This leg-conformation scale must be viewed as a rough and quick way to evaluate sow legs, with a relevant impact on further sow longevity. More detailed scorings could be assessed by Van Steenbergen’s (Reference Van Steenbergen1989) approach among others, although they cannot be easily applied under commercial conditions given the high time demands.
When specific leg defects were analyzed, abnormal hoof growth and the presence of bumps or injuries in legs increased culling risk in LP and LF competing risk analyses. These results highlighted that both abnormalities had a relevant effect on sow reproductive performance, probably through the two putative mechanisms suggested above. Note that bumps or injuries in legs can be very painful for the sow (Gregory, Reference Gregory2004), causing anxiety and stress. This stress may depress the immune system and impairs sow productivity (Whittemore, Reference Whittemore1998), affecting its ability to rear piglets (LP culling) and to become pregnant (LF culling). Moreover, abnormal hoof growth and the presence of bumps or injuries in legs are easily detected by farmers and therefore those sows tend to be culled preferentially in case of doubt. Plantigradism and sickle-hooked legs only increased the culling risk in one cause-specific analysis (LP and LF, respectively). Probably, their presence was less evident and perhaps less painful, although sow mobility was also impaired. These results highlighted the underlying link between leg conformation and both sow productivity and fertility and their influence on sow survivability. It is important to note that leg-conformation scores and specific leg defects did not influence sow survival under the DE-specific competing risk analysis, although the overall influence of leg conformation on sow longevity is well established in the literature (Lopez-Serrano et al., Reference Lopez-Serrano, Reinsch, Looft and Kalm2000; Serenius and Stalder, Reference Serenius and Stalder2004; Tarrés et al., Reference Tarrés, Bidanel, Hofer, Rosendo and Ducrocq2006a; Fernàndez de Sevilla et al., Reference Fernàndez de Sevilla, Fabrega, Tibau and Casellas2008). It should also be considered that mobility problems would make it more difficult for sows to access resources as well as show a sow’s normal behavior under the European Union directive 2001/88/EC (mandatory on European farms from January 1, 2013), which requires farmers to keep sows in group housing, from the 4th week of pregnancy until 1 week before farrowing.
We detected a significant influence of teat conformation score on sow longevity in the LP-specific analysis (P < 0.05), agreeing with Tarrés et al. (Reference Tarrés, Bidanel, Hofer, Rosendo and Ducrocq2006a). Sows with bad teat condition had the highest HR, whereas there were no significant differences between those with regular and good teat condition. It should be noted that teat condition has a substantial impact during lactation; a low number of functional teats (bad teat condition) should reduce the number of weaned piglets (Enfield and Rempel, Reference Enfield and Rempel1961). As expected, teat condition score had no influence on sow survival related to LF and DE. Teat irregularities do not affect the reproductive cycle and sow survivability, except for in severe cases of mastitis.
Heritability for sow Longevity in productivity and fertility-specific analyses
The estimated heritabilities in both LP and LF competing risk analyses were lower than those reported by Fernàndez de Sevilla et al. (Reference Fernàndez de Sevilla, Fabrega, Tibau and Casellas2008) for the same data set although under standard survival analysis. The heritabilities in the LF analysis were higher than in the LP analysis, although differences were minimal. These values could reflect the fact that some fertility-related traits, such as age at puberty or ovulation rates, have greater heritabilities (0.32 and 0.39, respectively; Lamberson, Reference Lamberson1990) than the number of piglets born alive or weaned piglets (0.07 and 0.06, respectively; Lamberson, Reference Lamberson1990). Our heritabilities for sow longevity were quite low with respect to those reported by Tholen et al. (Reference Tholen, Bunter, Hermesch and Graser1996; 0.08), Lopez-Serrano et al. (Reference Lopez-Serrano, Reinsch, Looft and Kalm2000; 0.10), Krieter (1995; 0.12) and Yazdi et al. (Reference Yazdi, Rydhmer, Ringmar-Cederberg, Lundeheim and Johansson2000a and Reference Yazdi, Lundeheim, Rydhmer, Ringmar-Cederberg and Johansson2000b; 0.11 to 0.31). Although direct genetic improvement for sow longevity seemed feasible, only a small genetic trend should be expected. Nevertheless, indirect selection programs could be useful given the medium–high heritabilities reported for some specific leg defects (Jørgensen and Andersen, Reference Jørgensen and Andersen2000; Quintanilla et al., Reference Quintanilla, Varona and Noguera2006). Further studies are necessary to accurately determine the genetic background of the leg-conformation defects evaluated in this study and to ascertain whether these leg defects could be eradicated by a genetic program.
Conclusions
The factors influencing voluntary culling (LP and LF) are different from those that produce death during the productive life of sows. Longevity was influenced by the year of the first farrowing and farm of origin in both analyses of voluntary culling. LP culling increased with backfat thickness over 19 mm at the end of the growth period, bad teat condition and reduced litter size at weaning. LF culling increased with age at first farrowing. Overall leg conformation, abnormal hoof growth and bumps or injuries to legs increased the risk of culling in both analyses of voluntary culling. Leg conformation did not influence sow longevity because individuals died during their productive life. Estimated heritabilities were small and suggested that direct genetic improvement would have a limited impact on sow longevity. Alternatively, it must be important to evaluate the possibility of genetically improved sow longevity by selecting against specific leg-conformation defects in sows. Special attention must be paid to leg-conformation traits to increase reproductive lifespan in sows and reduce involuntary culling due to LP and LF.
Acknowledgements
The authors would like to thank Selección Batallé S.A. (Riudarenes, Spain) for their cooperation. Thanks are also due to Dr J. Piedrafita (Universitat Autònoma de Barcelona, Bellaterra, Spain) for collaboration and to the technicians of the IRTA-Pig Testing Centre (Monells, Spain) for their assistance. We are also indebted to two anonymous referees for their helpful comments on the manuscript. The present study is part of the Welfare Quality® research project (FOOD-CT-2004-506508), which has been co-financed by the European Commission within the Sixth Framework Program. The text represents our views and does not necessarily represent a position of the Commission, who will not be liable for the use made of such information.