INTRODUCTION
As resources decrease and competition increases amongst a guild, differences between species in their use of available habitats may alter. The resultant alteration in levels of impact across the range of habitats is likely to influence biodiversity. However studies from the guild perspective are rare – whether assessing the impacts of entire guilds on their habitats (Makhabu Reference MAKHABU2005, Olofsson et al. Reference OLOFSSON, HULME, OKSANEN and SUOMINEN2004), or the consequences of altering the density of part of a guild (Flecker Reference FLECKER1997, Madhusudan Reference MADHUSUDAN2004). Yet there is a considerable theoretical literature on the relationship between interspecific competition and niche use. Here we summarize these theories, which produce hypotheses and testable predictions. We then test these predictions using the savanna browser guild as a topical case study. Elephant (Loxodonta africana (Blumenbach)) densities are increasing, except where there is heavy poaching, in all areas (Scholes & Mennell Reference SCHOLES and MENNELL2008). It is uncertain how this will affect differences in use of habitat between elephant and other members of the guild.
Niche overlap has been demonstrated for omnivores, carnivores and herbivores in a wide range of systems including tropical (Bagchi et al. Reference BAGCHI, GOYAL and SANKAR2003), temperate (Bonesi et al. Reference BONESI, CHANIN and MACDONALD2004), arctic (Elmhagen et al. Reference ELMHAGEN, TANNERFELDT and ANGERBJOERN2002), desert (Jones & Barmuta Reference JONES and BARMUTA2000) and, perhaps most extensively, in African savannas (Ferrar & Walker Reference FERRAR and WALKER1974, Fritz et al. Reference FRITZ, DE GARINE-WICHATITSKY and LETESSIER1996, Lamprey Reference LAMPREY1963, Loveridge & Macdonald Reference LOVERIDGE and MACDONALD2003). However niche overlap leads to competition only when resources are sparse, and maximum tolerable overlap would be expected to be lower if there is intense competition (Pianka Reference PIANKA1972, Reference PIANKA and May1976). Ideal free distribution theory (Fretwell & Lucas Reference FRETWELL and LUCAS1970) and centrifugal community organization theory (Rosenzweig Reference ROSENZWEIG1981), suggest that interspecific niche overlap is reduced by competing individuals increasing their niche breadth, by being less selective and utilizing a wider range of resources. Conversely, the niche compression hypothesis (MacArthur & Pianka Reference MACARTHUR and PIANKA1966) suggests that niche overlap is reduced by reducing niche breadth, with competitors increasing selection and utilizing a narrower range of resources.
The Jarman–Bell Principle (Bell Reference BELL1971, Belovsky Reference BELOVSKY1997, see also Demment & Van Soest Reference DEMMENT and VAN SOEST1985, Jarman Reference JARMAN1974) predicts that larger animals can survive on relatively lower-quality foods, because of the interrelationships between body size, energy (Hungate et al. Reference HUNGATE, PHILLIPS, MCGREGOR, HUNGATE and BUECHNER1959) and protein turnover (Brody et al. Reference BRODY, PROCTOR and ASHWORTH1934) and gut capacity (Illius & Gordon Reference ILLIUS and GORDON1992). As a result of this wider food-quality tolerance, larger herbivores would be expected to utilize a higher proportion of habitat types than smaller herbivores (Cromsigt et al. Reference CROMSIGT, PRINS and OLFF2009). The elephant is a non-ruminant, with most digestion occurring in the hind-gut (Van Hoven et al. Reference VAN HOVEN, PRINS and LANKHORST1981), and as such is adapted, compared with ruminants such as giraffe, kudu, nyala and impala, to process coarser forage at a rapid rate (Napier Bax & Sheldrick Reference NAPIER BAX and SHELDRICK1963).
These theories lead to the following hypotheses as to how resource limitation may influence habitat usage by the savanna browser guild: (1) with increasing resource limitation (a) interspecific habitat usage overlap will decrease (niche overlap hypothesis) and (b) selectivity for habitat types may either decrease (ideal free distribution theory and centrifugal community organization theory) or increase (niche compression hypothesis); (2) larger herbivores will be less selective of habitat type than smaller herbivores (Jarman–Bell principle); and (3) the elephant, as the largest member of the guild and its only non-ruminant, will be less selective of habitat type than other guild members (Jarman–Bell principle and digestive strategy).
METHODS
Community or vegetation type has been widely shown to be the principal influence on the habitat choice of large mammalian herbivores (Dekker et al. Reference DEKKER, VAN ROOYEN and BOTHMA1996, Ferrar & Walker Reference FERRAR and WALKER1974, Field & Laws Reference FIELD and LAWS1970, Lamprey Reference LAMPREY1963). We assessed habitat usage, in terms of vegetation type usage, of elephant, giraffe (Giraffa camelopardalis (Linnaeus)), kudu (Tragelaphus strepsiceros (Pallas)), impala (Aepyceros melampus (Lichtenstein)) and nyala (Tragelaphus angasii (Gray)). We used observed differences in seasonal use to evaluate the described predictions from niche theory.
Study site
We conducted the study from September 2006 to October 2008 in Hluhluwe–iMfolozi Park (HiP), KwaZulu–Natal, South Africa (28°00′–28°26′S, 31°43′–32°09′E). HiP is a 900 km2 completely fenced nature reserve, situated in the foothills of the first escarpment on the west side of the Zululand coastal plain (Whateley & Porter Reference WHATELEY and PORTER1983). Mean annual rainfall and altitude decrease from Hluhluwe in the north (990 mm and 450 m asl), to iMfolozi in the south (635 mm and 60 m asl), with April to September being the dry season. During the study the second dry season was noticeably drier than the first, with the height of the second dry season (July–September) particularly dry (first year: wet season 569 mm, dry season 253 mm, July–September 51 mm; second year: wet season 577 mm, dry season 167 mm, July–September 19 mm). Terrain varies between valleys, hills and plains. The soils are mainly derived from sandstone, shale and dolerite intrusions and are generally eutrophic. In Hluhluwe during June and July (coldest months) the mean daily minimum temperature recorded over the study period was 12 °C, and during January and February (hottest months) 31 °C (Zululand Grass Project Weather Data, unpubl. data).
The national vegetation map of South Africa (Mucina & Rutherford Reference MUCINA and RUTHERFORD2006) recognizes three major vegetation types within HiP. These are Northern Zululand Sourveld (SVI22), Zululand Lowveld (SVI23) and Scarp Forest (FOz5). The vegetation is characterized by fine-leaved Acacia savanna with a continuous grass layer and a fairly open tree canopy. Hluhluwe is typified by Acacia nilotica woodlands, Acacia karoo–Dichrostachys cinerea thicket, Euclea divinorum woodlands and, at higher altitudes, Celtis africana forest communities. In the Corridor A. nilotica woodlands and A. karroo–D. cinerea thicket predominate; in iMfolozi Acacia nigrescens woodlands, Acacia tortilis woodlands and Spirostachys africanus woodlands (Whateley & Porter Reference WHATELEY and PORTER1983). The A. nilotica woodlands and A. karroo–D. cinerea communities that dominate Hluhluwe and the Corridor are allied with dense, tall grass swards, consisting primarily of species of the tribe Andropogoneae such as Themeda triandra and Cymbopogon excavatus (Pooley Reference POOLEY2003). HiP supports a large and diverse herbivore population. The principal browsers, and their current estimated average densities (K.Z.N.Wildlife 2008), are elephant 0.52 km−2 (increasing at 9% p.a.), giraffe 0.89 km−2, black rhino (Diceros bicornis (Lichtenstein)) 0.35 km−2, kudu 1.3 km−2, nyala 7.3 km−2 and impala 26.1 km−2.
Data collection
Management required a cheaper alternative to annual aerial censuses for monitoring population sizes amongst the browser guild. Previous use of distance sampling (Buckland et al. Reference BUCKLAND, ANDERSON, BURNHAM, LAAKE, BORCHERS and THOMAS2001) to analyse ground census data had produced unrealistic population estimates. This was probably due to the assumptions inherent in distance sampling being violated. Distance sampling assumes that sighting visibility falls off gradually as distance from the observer increases. The varied topography of HiP frequently results in visibility being abruptly cut off, leading to areas of dead ground where animals cannot be seen, between the observer and the limit of his vision. We therefore developed our own method, based on a GIS, for determining herbivore densities by habitat type, from which management could extrapolate to monitor reserve-wide population sizes.
We drove at 20 km h−1 on the same fixed route through a representative sample of the different vegetation types, using the reserve's road network, for 5 d mo−1 for 2 y (September 2006–September 2008). When study animals were seen the vehicle was stopped, and the species and number of animals recorded. At each sighting location we recorded the longitude/latitude of the vehicle using a GPS (Garmin 12XL), the distance from the vehicle to the (approximate) centre of the herd using a laser rangefinder (Yardage Pro 1000) and the compass bearing from the vehicle to the herd, using the GPS that was recording the direction of travel. The position of the individual animal or herd was then determined trigonometrically and imported into a GIS (ArcGIS 9). Although the elephant forms an estimated one-third of the reserve's browser biomass, its small numbers, comparative to the other browsers studied, result in comparatively few elephant sightings. Repeated transects relying on frequent sightings was therefore not an appropriate technique, and consequently an alternative approach was needed to determine elephant habitat usage. Over the study period six cow elephants, one in each of the reserve's six breeding herds, were fitted with GPS/mobile-phone collars set to record and download the wearer's position every 30 min. These records were then also imported into the GIS.
Data analyses
Data were analysed across the whole study period, by year and by separate seasons (Schooley Reference SCHOOLEY1994).
Ecological densities by vegetation type
The most recent vegetation community study and resultant GIS map of HiP is nearly 30 y old (Whateley & Porter Reference WHATELEY and PORTER1983); it is also very detailed, consisting of 30 categories. To determine its current validity, three approaches were used. Ground (unpubl. data) used a series of fixed-point photographs taken over time (from 1975 onwards) at specific sites throughout HIP to develop a structural vegetation model. The outputs showed that although an overall thickening of the park had taken place over the past 33 y, changes were occurring at community rather than structural level (80% of predicted changes versus 10% respectively), with the majority of these shifts following successional pathways e.g. Acacia caffra wooded grassland to A. nilotica/A. karroo wooded grassland. Secondly, Google Earth satellite images were digitized and overlaid over the Whateley and Porter map in the form of polygons to verify habitat boundaries and, thirdly, all transects were re-driven and the nature and boundaries of communities directly compared with the Whateley and Porter map. Both these approaches also showed minimal structural changes in the park's vegetation communities. With the Whateley and Porter map thus structurally validated, a simplified GIS vegetation layer was constructed consisting of nine structural categories based on the original 30 categories. These were (with dominant woody species): broad-leaved thicket (Euclea divinorum), closed woodland (Spirostachus africana, Euclea racemosa, Acacia grandicornuta), dry forest (Olea europa, Commiphora harveyi), fine-leaved thicket (Acacia spp., Dichrostachys cineria), grassland, open woodland (A. nigrescens/A. tortilis, A. nilotica, A. burkei, Commiphora apiculatum), riparian (A. robusta, Ficus spp.), scarp forest (Celtis spp., Harpephyllum spp., E. racemosa) and wooded grassland (A. karoo, A. caffra, D. cinerea).
To determine the area sampled by the road transects, all transects were slowly re-driven with the observers recording, manually on large-scale maps, maximum sighting distances for the various herbivores, either side of the vehicle. In the GIS these results, together with the 3108 sighting records displayed in the GIS, were then used to construct polygons which were merged to produce one polygon of the area sampled. Using ‘Intersect’ from the ‘Analysis Tools’, the vegetation layer and the sampled area polygon as the ‘input features’, the resultant ‘output’ demarcated the area sampled by vegetation type. The ‘XTools’ routine was then used to calculate the area sampled by vegetation type. The number of animals sighted in each vegetation type was determined from the database and with the number of animals per vegetation type and the area of that vegetation type sampled known, ecological densities per vegetation type were obtained. To validate these ecological densities, total population estimates for each of the study herbivores were calculated and compared with available management population estimates (obtained by a mixture of aerial censuses and walked transects). Total population estimates were calculated here using the ecological densities and the total area of each vegetation type in the reserve (the latter obtained by applying the ‘XTools’ routine to the entire vegetation layer).
Densities for elephant were determined from their collar data. A concurrent study on the social behaviour of the six breeding herds in HiP showed that, over the period of this study, each collared cow remained with her herd and that membership of each herd varied little (Bodasing Reference BODASING2011). During the height of the dry season, breeding herds coalesced, typically into two large herds, with, again, the collared cows remaining with their core breeding herd within the larger dry-season herd. Thus movements of each collared cow can be taken as representative of their respective breeding herd. Overlaying the GPS downloads (n = 187 254) onto the GIS vegetation layer enabled the proportion of time spent in each vegetation type by each collared elephant to be calculated. Average numbers of elephants in each of the six herds for each of the four seasons were then used to weight these proportions. Knowing the total number of elephants in the reserve and total area of each vegetation type, these weighted proportions were used to produce densities for elephant by vegetation type across the reserve. The different methods used to determine densities per vegetation type for elephant versus other browsers, means one cannot directly compare the actual densities across these two groups. However, comparison of the proportional usage of different vegetation types by elephant versus other browsers is valid.
Vegetation types: preferences and overlaps
Krebs (Reference KREBS1999) recommends Manly's α preference index (Manly et al. Reference MANLY, MILLER and COOK1972) as a simple measure of preference derived from probability theory, that includes all the biological factors that may affect capture and encounter rates of prey, including availability. Manly's α (constant prey populations) may be adapted for habitat usage to:
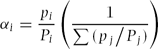 \begin{linenomath}\begin{equation*}
\alpha _i = \frac{{p_i }}{{P_i }}\left( {\frac{1}{{\sum {({{p_j } \mathord{\left/
{ {P_j )}}} \right.
\kern-\nulldelimiterspace} {P_j )}}} }}} \right)\end{equation*}\end{linenomath}
Seasonal differences in vegetation type preferences by the guild were assessed by calculating, and comparing, the sum of absolute values away from the neutral value for Manly's alpha (here 0.111) for the entire guild, and for each herbivore species, in each season. As obligate browsers (kudu and giraffe) experience different resource limitation between seasons compared with mixed feeders (impala, nyala and elephant), herbivores were grouped into obligate browsers or mixed feeders to assess the predictions of the Jarman–Bell principle. Weights of herbivores are the average of adult male and female, taken from Estes (Reference ESTES1991).
As an additional measure of preference Ivlev's electivity index (Reference IVLEV1961), recommended by Lechowitz (Reference LECHOWICZ1982), was calculated as:
 \begin{linenomath}\begin{equation*}
E_i = {{\left( {p_i - P_i } \right)} \mathord{\left/
{ \right)} {\left( {p_i + P_i } \right)}}} \right.
\kern-\nulldelimiterspace} {\left( {p_i + P_i } \right)}}\end{equation*}\end{linenomath}
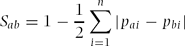
Overlap of vegetation-type usage between all pairwise combinations of herbivores in the guild was assessed using Schoener's index (Schoener Reference SCHOENER1974), recommended by Abrams (Reference ABRAMS1980) as a measure meeting the required criteria of an overlap measure. Where there is no use of the same resources this index is zero, and where completely identical resources are used to the same extent it is one; overlap is generally considered significant where the index ≥ 0.6 (Wallace Reference WALLACE1981). Schoener's index for overlap of habitat usage was:
 \begin{linenomath}\begin{equation*}
S_{ab} = 1 - \frac{1}{2}\sum\limits_{i = 1}^n {\left| {p_{ai} - p_{bi} } \right|}\end{equation*}\end{linenomath}
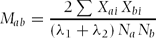
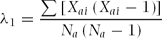
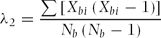
As an additional measure of overlap Morisita's index of similarity (Reference MORISITA1959), recommended by Wolda (Reference WOLDA1981) as ‘the best overall measure of similarity for ecological use’ but one affected by very small sample size (Krebs Reference KREBS1999), was calculated as:
 \begin{linenomath}\begin{equation*}
M_{ab} = \frac{{2\sum {X_{ai} X_{bi} } }}{{\left( {\lambda _1 + \lambda _2 } \right)N_a N_b }}\end{equation*}\end{linenomath}
 \begin{linenomath}\begin{equation*}
\lambda _1 = \frac{{\sum {\left[ {X_{ai} \left( {X_{ai} - 1} \right)} \right]} }}{{N_a \left( {N_a - 1} \right)}}\end{equation*}\end{linenomath}
 \begin{linenomath}\begin{equation*}
\lambda _2 = \frac{{\sum {\left[ {X_{bi} \left( {X_{bi} - 1} \right)} \right]} }}{{N_b \left( {N_b - 1} \right)}}\end{equation*}\end{linenomath}
The Morisita index of similarity varies from 0 (no similarity) to 1.0 (complete similarity). All statistical procedures were carried out in S-PLUS 2000.
RESULTS
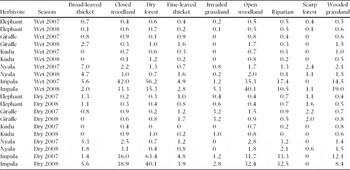
Over the study period we obtained 3108 sighting records (totalling 27 947 animals). Data obtained on black rhino were too limited to form part of the analyses. Population estimates derived from aerial and walked censuses were available for impala (23 500) and for giraffe (800). Estimates derived from our GIS approach (impala: 23 600; giraffe: 900) compared favourably with these. In the wet season the guild members utilized a wide range of woodland vegetation types, with grassland, scarp forest and riparian communities generally avoided (Table 1). However, in the dry season there was a noticeable shift to these latter three vegetation types, with elephant and giraffe particularly preferring scarp forest and impala and nyala (and, to a lesser extent, kudu) riparian communities. The guild's reduced usage in the dry season of closed, open and grassed woodland was striking. Impala heavily preferred dry forest and nyala broad-leaved thicket in both seasons.
Occupancy of different vegetation types by members of the browser guild in Hluhluwe-iMfolozi Park, South Africa. Densities (number of animals km−2) are shown for each member of the guild, in different wet and dry seasons.

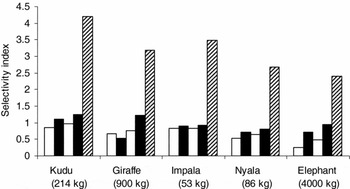
The sum of absolute values away from the neutral value for Manly's alpha for the entire guild was higher in both dry seasons (3.97, 5.16) compared with the preceding wet seasons (3.12, 3.68), indicating greater selection (whether avoidance or preference) of vegetation types occurred in the dry season. The higher value in the second dry season and the noticeably larger difference between the wet and dry season of the second year (1.48) compared with the first year (0.85), indicated greater selection was occurring in the more severe, drier, second dry season. Larger herbivores, within the category of obligate browser or mixed feeder, were generally less selective of habitat type than smaller herbivores (Figure 1). However over the first, less severe, dry season elephant showed a comparable degree of selectivity to the much smaller nyala, whilst over the second, severe dry season the elephant was the most selective mixed feeder. Similarly, amongst the obligate browsers, giraffe showed a comparable degree of selectivity to the smaller kudu over the second, severe dry season. Manly's alpha results were supported by Ivlev's electivity index results. The two indices closely agreed with each other, with 6% of results differing (marginally) in terms of showing a preference or avoidance.
Selectivity for vegetation types amongst members of the browser guild in Hluhluwe-iMfolozi Park, South Africa. The sum of the absolute values away from the neutral value for Manly's alpha (here 0.111) are shown. The higher the value, the greater the degree of selectivity. Herbivore species are grouped into obligate browsers (kudu and giraffe) and mixed feeders (impala, nyala and elephant), and then ordered by mass (masses shown are the average of adult male and female, taken from Estes Reference ESTES1991). The first pair of columns for each herbivore species show values for the wet (open) and dry (black) seasons during the first year of the study, the second pair for the second year. The final columns (diagonal) show values for all four seasons combined.

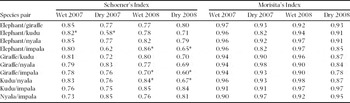
Overlap was significant (Schoener's index ≥ 0.6) for all herbivore pairs in both wet seasons and for 95% of herbivore pairs in both dry seasons (Table 2). In the dry season 80% of overlap values were lower compared with the preceding wet season in both years. Significant seasonal reduction in overlap (Wilcoxon rank-sum statistic W = 61, n 1 = n 2 = 9, P < 0.05 two-tailed) was shown by only one herbivore pair in the first year, but by three herbivore pairs (Wilcoxon W = 61, 60, 58, n 1 = n 2 = 9, P < 0.05 two-tailed) in the second year with its more severe dry season. Similarly, across the guild as a whole significant seasonal reduction in overlap (Wilcoxon rank-sum normal statistic with correction Z = −1.98, P < 0.05 two-tailed) occurred between the wet and dry season in the second year, but not in the first. Schoener's index results were supported by Morisita's index of similarity results. The relative values of the two indices amongst the guild were similar and showed similar seasonal shifts (Table 2).
Overlap in vegetation type occupancy amongst members of the browser guild in Hluhluwe-iMfolozi Park, South Africa. Schoener's Index and Morisita's Index are shown for each herbivore species pair in each of the four seasons. For Schoener's Index, values ≥ 0.6 are considered significant. * Schoener's Indices which showed a significant change (P < 0.05, Wilcoxon rank sum test) from the wet to the corresponding dry season.

DISCUSSION
The similarity of our population estimates to those derived from aerial censuses, suggests our novel GIS approach to determining herbivore densities by vegetation type gives consistent values. Additionally, the finding of extensive utilization of woodland vegetation types by the guild's different members is in agreement with previous work on the habitat usage of elephant (Laws Reference LAWS1970), giraffe (Dagg & Foster Reference DAGG and FOSTER1976), impala (Jarman Reference JARMAN1972), kudu (Grunow Reference GRUNOW1980), nyala (Anderson Reference ANDERSON1978) and black rhino (Tatman et al. Reference TATMAN, STEVENS-WOOD and SMITH2000). This widely reported preference is probably because woodlands have both a physiognomy that maximizes the availability of food to browsers and mixed feeders of different sizes, and are likely to have a high nutritional status because of rapidly growing early-successional species, resulting from browsing, fire and wind disturbance. Increased usage of riparian habitats during the dry season has been specifically demonstrated by others for elephant (Mosugelo et al. Reference MOSUGELO, MOE, RINGROSE and NELLEMAN2002), giraffe (Pellew Reference PELLEW1984), impala (Jarman Reference JARMAN1972), kudu (Simpson & Cowrie Reference SIMPSON and COWRIE1967) and black rhino (Oloo et al. Reference OLOO, BRETT and YOUNG1994); it corresponds to the dry-season movement down the catena that has been demonstrated for grazing ungulates (Bell Reference BELL and Watson1970) and elephant (de Knegt et al. Reference DE KNEGT, GROEN, VAN DE VIJVER, PRINS and VAN LANGEVELDE2008). Whilst impala, nyala and, to a lesser extent, kudu showed this shift here, elephant and giraffe did not but, rather, showed a dry-season shift to scarp forests. This vegetation type only occurs in the considerably wetter north of the reserve and presumably retains, similar to riparian habitats, more nutritious plants through the dry season compared to other vegetation types.
The extensive overlap in vegetation type usage found amongst the guild implies that different guild members will broadly impact the same vegetation types. Pianka's niche overlap hypothesis was supported – in both dry seasons most guild members showed a decrease in interspecific overlap, whilst significant reductions in overlap were more numerous in the second, severer dry season, during which, uniquely, overlap across the guild as a whole also significantly declined. Thus interspecific habitat-usage overlap decreased with increasing resource limitation. The niche compression hypothesis was also supported – selectivity for vegetation types increased in both dry seasons, with this effect also more pronounced in the more severe of the two dry seasons, again implying a direct relationship with increasing resource limitation and, thus, competition. Conversely, the predictions of the ideal free distribution theory and centrifugal community organization theory, that selectivity decreases with increasing resource depletion, were not supported. Thus from the perspective of management, the greater the resource depletion (e.g. following increases in elephant density), the more relevant interspecific differences in habitat usage become in relation to the differential impact of guild members.
The Jarman–Bell principle was generally supported, with smaller herbivores showing decreased diversity of habitat use (i.e. increased selectivity) compared with larger herbivores. These findings directly support Cromsigt et al. (Reference CROMSIGT, PRINS and OLFF2009) who, working on the savanna grazing guild in HiP, found that larger ruminant grazers were more evenly distributed than smaller ruminants and had a more diverse use of habitats. However the dry-season selectivity of elephant, and to a lesser extent giraffe, did not support the Jarman–Bell principle, as these largest members of the guild showed comparable or, under marked resource-limitation conditions, greater selectivity than smaller guild members. The explanation for both species may be their greater mobility. Home ranges for both giraffe and elephant are markedly greater than those for smaller herbivores (du Toit Reference DU TOIT1990). By virtue of their size they are also less susceptible to predation (Owen-Smith Reference OWEN-SMITH1988), and consequently less restricted by dense undergrowth which may conceal predators (Grand Reference GRAND2002). Dense undergrowth also supports higher densities of ticks; it has been suggested that larger ungulates may be better able to tolerate the metabolic cost of tick infestation than smaller ungulates (Gallivan & Horak Reference GALLIVAN and HORAK1997). Giraffes are also heavily attended by the tick-removing oxpecker (Hart et al. Reference HART, HART and MOORING1990). Elephant and giraffe might therefore be expected to alleviate resource depletion more successfully than smaller herbivores, by concentrating their foraging in whatever part of their larger range provides the best forage, relatively independent of predators or ticks. This appeared to be the case, with the relevant dry-season range of both elephant and giraffe being concentrated in the north-eastern part of the study area, which is characterized by thicker undergrowth and stands of Acacia karoo – a woody species heavily favoured by both herbivores (O'Kane et al. Reference O'KANE, DUFFY, PAGE and MACDONALD2011). Elephants are also known to communicate over long distances (Poole et al. Reference POOLE, PAYNE, LANGBAUER and MOSS1988), and thus the disparate but related herds that combine in the dry season (Bodasing Reference BODASING2008, Wittemyer et al. Reference WITTEMYER, GETZ, VOLLRATH and DOUGLAS-HAMILTON2007) might inform one another where the best forage is to be found. The manner in which the smaller members of the guild were apparently unable to capitalize on these superior resources, emphasizes that factors other than efficiency in acquiring food sources of high nutritional value, as suggested by optimal foraging theory (Stephens & Krebs Reference STEPHENS and KREBS1986), may also influence habitat and food selection (e.g. the giving-up-density theories (Brown Reference BROWN1988) suggest that both niche breadth and niche overlap may be influenced by factors such as predation). Additionally it is noteworthy that although the Jarman–Bell principle is widely accepted, some recent empirical evidence (Clauss & Hummel Reference CLAUSS and HUMMEL2005, Franz et al. Reference FRANZ, HUMMEL, MULLER, BAUERT, HATT and CLAUSS2011, Weckerly Reference WECKERLY2009) questions this theoretically derived concept.
Conclusions
Amongst the savanna browser guild we found that with increasing resource depletion interspecific overlap in habitat usage decreased, whilst selectivity for habitat types increased. Smaller members of the guild generally showed greater selectivity for habitat types, but exceptions, noticeably elephant under marked resource depletion, were found. These principles may apply to other guilds and in other systems. However, the savanna browser guild has an unusually diverse range of browsers, and is thus likely to have a high degree of redundancy in the system, translating into heightened competitive effects amongst the guild. Guilds lacking these characteristics are likely to respond to resource limitation, in terms of the shifts in habitat usage overlap and selectivity discussed here, in a more muted manner.
ACKNOWLEDGEMENTS
We thank the management of Hluhluwe-iMfolozi Park, South Africa. We also thank two anonymous reviewers for valuable comments on an earlier draft of this paper. Dr O'Kane holds the Kadas Research Fellowship at WildCRU, Department of Zoology, University of Oxford and is deeply grateful to Gyongyver and Peter Kadas for their support. A grant was received from the National Research Foundation, South Africa.