

INTRODUCTION
Despite recent significant and rapid gains in rights for gays and lesbians in Europe, Latin America, and North America (Asal, Sommer, and Harwood Reference Asal, Sommer and Harwood2013; Ayoub and Garretson Reference Ayoub and Garretson2016; Kollman Reference Kollman2007), political protections for and social integration of sexual minorities throughout Africa appear to be growing increasingly perilous.Footnote 1 At first glance, this is perhaps unsurprising since religious and political leaders in Africa routinely invoke anti-gay rhetoric, legislation curtailing sexual minorities' rights is common, and the continent has witnessed increased violence against gays and lesbians. At the same time, gay rights have only emerged as a politically important issue in Africa within the last few years (Awondo, Geschiere, and Reid Reference Awondo, Geschiere and Reid2012). Previously, queer identities were largely not addressed, and, if discussed at all, attitudes were nuanced and largely shaped by individuals' personal experiences rather than public debate (Epprecht Reference Epprecht2013). Moreover, a civil society backlash against recent anti-gay policies has obtained important, if isolated, legal victories in some African countries. Therefore, although public opinion data suggest that considerable majorities of African citizens disapprove of homosexuality today (Dionne, Dulani, and Chunga Reference Dionne, Dulani and Chunga2014), these beliefs could be less entrenched than they first appear. Because rights and social acceptance are critical for gay citizens’ well-being, and because queer issues are only very recent to political dialogues, now is a critical moment for understanding Africans' attitudes toward homosexuality. What factors shape citizens' opinions regarding gays and lesbians, and under what conditions might mass attitudes shift toward greater acceptance?
Prior approaches to understanding Africans' views on homosexuality underscore the religious and political dynamics that influence public opinion, mostly veering toward intolerance. Africans are among the most religiously devout adherents in the world (Economist 2015), with 85–90% identifying as Christian or Muslim. African Christian and Muslim leaders routinely adopt literal interpretations of religious texts to label homosexual practices as “un-Godly” and “un-African.” Such religious teachings play an important role in politicizing homosexuality (van Klinken and Chitando Reference van Klinken and Chitando2016) and may solidify individuals' rejection of homosexuality, especially since messages from trusted religious leaders play a powerful role in stimulating adherents' political attitudes in Africa (McClendon and Riedl Reference McClendon and Beatty Riedl2015). For example, the recent growth of evangelical Pentecostalism,Footnote 2 which has actively preached against homosexuality, likely contributes to the increased political salience of queer identities in Africa (Grossman Reference Grossman2015). African politicians often adopt religious and cultural justifications for opposing homosexuality when they promote laws that curtail sexual minorities' rights.Footnote 3 To the extent that citizens develop opinions consistent with the positions modeled by their religious and political leaders, hostile beliefs regarding homosexuality are likely to prevail. Absent an extreme (and unexpected) decrease in religiosity, a reduction in the social influence of religious leaders or ideas, a change in religious interpretation, or formidable shifts in the political terrain of gay rights, these perspectives suggest that public attitudes are unlikely to become more tolerant toward Africa's gay citizens.
We build on these insights but employ a contrasting logic of how religious and political dynamics in Africa influence public opinion regarding gays and lesbians to investigate the conditions under which individuals' tolerance toward queer citizens may increase. Specifically, we identify a path by which religion may moderate, rather than inflame, anti-gay attitudes. Because a person's religious beliefs may variously increase or decrease that person's tolerance for social groups in general (Burge Reference Burge2013; Spierings Reference Spierings2014) and sexual minorities specifically (Djupe, Lewis, and Jelen Reference Djupe, Lewis and Jelen2016), we contend that a person's views on socially proscribed behavior are also the result of their exposure, or lack thereof, to the belief systems of others. Gay identities can challenge a community's perceptions of standard behavior and force it to confront different approaches to gender and sexuality as defined by religious teaching. We posit an association between a community's level of religious diversity and a resident of that community's ex/inclusionary attitudes toward sexual minorities. In religiously homogeneous communities, individuals' pre-conceived notions are likely reinforced because they are less likely to encounter people or practices that question their beliefs; in communities with increasing religious diversity, people's beliefs on a range of topics dictated by social and cultural teachings and practice may change. On the one hand, social diversity (particularly ethnic, religious, or cultural) has been shown to solidify group attitudes and actions within a community and yield exclusionary perceptions toward other groups and those deemed as outsiders or abnormal (Adida, Laitin, and Valfort Reference Adida, Laitin and Valfort2016). On the other hand, under certain conditions, social diversity may work to advance inclusionary perspectives (Forbes Reference Forbes1997) and moderate attitudes toward people perceived as different (Broockman and Kallah Reference Broockman and Kallah2016; Pettigrew and Tropp Reference Pettigrew and Tropp2006). Diversity could therefore either have an ossifying or moderating effect on people's tolerance: if individuals' exposure to diversity strengthens intolerance, living in a more religiously diverse community could drive extreme views on socio-religious issues (like sexuality); if encountering and accommodating alternative religious practices within a shared community makes people more accustomed to cultivating difference, living among other religious adherents could make a person more accepting.
We adopt this second perspective and argue that in Africa, local religious diversity may dislodge, instead of reinforce, homophobic attitudes. This assertion may sound surprising in a context where religious teachings admonish homosexuality. However, we contend that the general effect of social diversity on tolerance might be particularly meaningful with regard to religious diversity and views regarding homosexuality. Living in religiously pluralistic areas may affect individuals' adherence to dogmatic religious doctrine because religious diversity—and the numerous daily interactions with individuals from different faiths it facilitates—increases the likelihood that a person confronts, questions, or modifies the certainty of their own convictions. Such diversity may disrupt adherents' beliefs and accustom them to living more comfortably with those who abide by alternative doctrines (Taylor Reference Taylor2007). If so, individuals' religious beliefs, or their attachment of those beliefs to social issues like homosexuality, may weaken when they live in pluralistic communities. Religious diversity can therefore produce changes in social attitudes even as the underpinning religious beliefs do not fundamentally change. We hypothesize that as communities become more religiously diverse, residents are increasingly likely to express positive social attitudes toward homosexuality; conversely, persons in communities with lower levels of religious diversity are likely to express higher levels of anti-homosexual attitudes.
We test whether religious diversity shapes individuals' attitudes in the direction of greater tolerance toward homosexuality by analyzing the Afrobarometer Round 6 cross-national survey of almost 54,000 respondents from 36 African countries, 33 of which were surveyed about attitudes toward homosexuality (Afrobarometer 2016). Since its inception two decades ago, the Afrobarometer has served as a groundbreaking tool to measure Africans' views on political, economic, and social issues across levels of democratic consolidation (Bratton, Mattes, and Gyimah-Boadi Reference Bratton, Mattes and Gyimah-Boadi2005). Round 6 (2014–15) was the first wave to poll attitudes about homosexuality across the majority of African countries, and was fielded directly after a period of dramatic increases in the political relevancy of gay rights.
To preview findings, 78% of respondents expressed opposition to having a homosexual neighbor, while 22% indicated more open attitudes. Exploring variation in these responses, we find that local religious diversity meaningfully affects individuals' reported tolerance toward gays and lesbians. A uniquely generated inverse Herfindahl-Hirschman Index (HHI) of district-level religious concentration shows that respondents living in religiously pluralistic communities register a four-to-five point shift (a roughly 50% increase) in their likelihood of expressing acceptance of homosexual neighbors compared to those living in religiously homogeneous communities. The probability of strongly opposing gay neighbors reduces by more than four percentage points among respondents living in communities approaching perfect religious diversity as compared to those in religiously homogeneous communities. Our main findings account for a variety of observable and latent factors likely to drive variation in the outcome at the country, sub-national, district, and individual-level, and they maintain under alternative modeling specifications. Sensitivity analyses show that the main effect of religious diversity is not likely driven by outlier countries, the existence of specific religious affiliations within diverse communities (including evangelical Protestants or Muslims, two sects often stereotyped as anti-gay), the expressed religiosity of respondents, or the self-selection of more tolerant individuals into religiously pluralistic districts. Moreover, other forms of social diversity (including ethnic diversity) do not yield statistically meaningful results on attitudes toward homosexuality, and our religious diversity measure does not consistently affect individuals' tolerance of potential “outsider” groups that are not proscribed by religious teaching. Our analysis therefore suggests that religious diversity uniquely affects citizens' attitudes toward sexual minorities in Africa.
Our findings make contributions to existing research and public debates. First, we consider the critical ways in which religion drives mass attitude formation in Africa. We focus specifically on the conditions under which religious pluralism in a person's community may influence beliefs regarding sexual minorities. Previous scholarship asserts overwhelming and solidified anti-gay attitudes in Africa. But by focusing on anti-gay sentiments evident in religious and political institutions, prior studies have lacked a meaningful basis for explaining why social attitudes could change in the direction of tolerance even where religiosity thrives, anti-gay religious doctrine remains unchanged, and political leaders espouse anti-gay agendas. Our study identifies the potentially important role that religious diversity plays in explaining variation in what otherwise appears to be unyielding opposition to sexual minorities. Following Areshidze's (Reference Areshidze2017) call for social scientists to take religion seriously by considering dynamics that counter mainstream secular presuppositions, we join an emerging literature that challenges many assumptions about the relationship between religion and beliefs regarding homosexuality (Ayoub Reference Ayoub2014; Reference Ayoub2016).
Second, we contribute to research that examines whether and how social diversity impacts social tolerance, political behavior, and collective action. In some contexts, increasing levels of diversity introduce collective-action barriers (Habyarimana et al. Reference Habyarimana, Posner, Weinstein and Humphreys2009; Miguel and Gugerty Reference Miguel and Kay Gugerty2005), out-group hostility (Huckfeldt and Kohfeld Reference Huckfeldt and Weitzel Kohfeld1989; Kinder and Sears Reference Kinder and Sears1981), and competition over resources between social groups within communities (Alesina, Glaeser, and Sacerdote Reference Alesina, Glaeser and Sacerdote2001; Horowitz Reference Horowitz1985; Wilkinson Reference Wilkinson2005). Further, studies document a strong association between diversity (primarily ethnic) and political outcomes in Africa in particular (Arriola Reference Arriola2012; Posner Reference Posner2004). Our results build upon critical insights about the unique ways in which religion (Grossman Reference Grossman2015; McClendon and Riedl Reference McClendon and Beatty Riedl2015)—including local-level religious dynamics (Riedl Reference Riedl2017)—shapes behavior and tolerance by showing that a community's religious diversity may dislodge otherwise-intolerant views toward homosexuality. Echoing findings from Braun's (Reference Braun2016) study of the protection of Jews by Christian religious minorities during the Holocaust, we similarly cohere with established and emergent studies that show that exposure to social diversity can engender inclusion under certain conditions (Forbes Reference Forbes1997; Jackman and Crane Reference Jackman and Crane1986) and moderate individuals' attitudes, particularly toward people who are perceived as different (Broockman and Kallah Reference Broockman and Kallah2016; Pettigrew and Tropp Reference Pettigrew and Tropp2006). While the presence of particular religious affiliations in communities is not responsible for variation in pro-gay attitudes across locales in Africa, the type of a community's diversity (here, religious) appears to matter.
The remainder of this article proceeds as follows. First, we provide background on the religious and political trends that shape the status of sexual minorities in Africa, including the recent growth of gay identities in public debate. Next, we outline our conceptual framework for the relationship between social diversity and tolerance to theorize why religious diversity specifically may contribute to gay-inclusive attitudes. Third, we outline our research design, data, measurement, and estimation strategy. We then present our main results and summarize our robustness checks (expanded in the Appendix). Last, we conclude by proposing further research frontiers and discussing policy implications of our study for the growing debates around gay rights in Africa.
SOCIAL AND POLITICAL BARRIERS TO PUBLIC SUPPORT OF GAYS AND LESBIANS IN AFRICA
Comparative research on political behavior in contemporary Africa has given little attention to issues around gay rights. We therefore provide a brief overview of the broad socio-historical influences that cultivate anti-gay attitudes, and cover recent evidence of the increased salience of queer politics on the continent.
Religion no doubt plays an important role in shaping attitudes regarding homosexuality as Africa's religious landscape thrives. About 85–90% of the continent identifies as either Christian or Muslim. Africans register among the most devout adherents in the world (Economist 2015), and religion is central to social and political life (Ellis and Ter Haar Reference Ellis and Ter Haar2004). Religious officials are highly trusted public leaders and are often critical in shaping social attitudes and political behavior (Haynes Reference Haynes2004; Jones and Lauterbach Reference Jones and Lauterbach2005; Riedl Reference Riedl2012).Footnote 4 Recently, clergy—who often wield considerable social and political influence (Guth et al. Reference Guth, Green, Smidt, Kellstedt and Poloma1997)—have been influential voices preaching against homosexuality throughout Africa (Dreier Reference Dreier2018): mainline Christians, Pentecostal Renewalists, and Muslim clerics alike explicitly condemn homosexual behavior as “un-African” and “un-scriptural” (Sperber Reference Sperber2014; van Klinken and Chitando Reference van Klinken and Chitando2016). Given religion's prominence throughout the continent and religious leaders' strong anti-homosexuality stances, it is not surprising that religious adherents would adopt public pronouncements made by faith leaders.
Yet the narrative that homosexuality is “un-African” and the political debate that it has now inspired have emerged relatively recently. Extensive evidence documents diverse same-sex practices across Africa before colonial intervention (Epprecht Reference Epprecht2013; Tamale Reference Tamale2011). Some pre-colonial communities accommodated same-sex practices (Tamale Reference Tamale2014), and it was not until European colonization that homosexuality was codified as illegal. Christian missionaries and colonial administrations presented homosexuality as a distinct identity proscribed both by colonial penal codes (Tamale Reference Tamale2011; Reference Tamale2014) and Victorian Christian attitudes. Several countries with large Muslim populations have penal codes that similarly codify Islamic-based norms against homosexuality, despite more tolerant attitudes among some majority-Muslim regions (e.g. East Africa's coast (Amory Reference Amory, Murray and Roscoe1998)). Although many European churches that formerly missionized Africa now embrace queer rights or temper their attitudes against homosexuality (Dreier Reference Dreier2018), their now-independent African counterparts still reject it (Jenkins Reference Jenkins2011). Legal strictures and religious mores continue to govern homosexuality-related laws today across Africa (Han and O'Mahoney Reference Han and O'Mahoney2014). As of 2017, 33 countries criminalize male same-sex practices, 29 of which also criminalize homosexuality among women.Footnote 5
Despite a history of anti-gay religious teachings and laws restricting homosexuality, gay rights have only become the subject of widespread public discussion within the last few years in Africa. In an analysis of the highest-circulating newspapers across 28 sub-Saharan African countries, Grossman (Reference Grossman2015) finds that the average number of articles mentioning gays and lesbians was only seven in 2004, but that number more than quadrupled by 2012. Many politicians have recently proposed harsher sentencing policies for same-sex activity, while states enforce existing criminal codes at increasingly high rates. Uganda received international attention between 2009–14 for its Anti-Homosexuality Act, the original text of which would have permitted the death penalty for some same-sex activities. Similar anti-gay policies have been proposed or implemented over the last few years in Cameroon, Gambia, Nigeria, and Tanzania (Chonghaile Reference Chonghaile2015; Ng'wanakilala Reference Ng'wanakilala2017; Sneed and Welsh Reference Sneed and Welsh2014). Homosexuality has become a popular topic to drum up domestic political support. Governments and politicians often use hate speech against gay communities, censor LGBTQ media content (Winkler Reference Winkler2019), discuss gay rights in derogatory ways,Footnote 6 and target sexual minorities for state-led anti-gay crackdowns (Ghoshal and Tabengwa Reference Ghoshal and Tabengwa2015). Between 2013 and 2016, eighteen African governments carried out arrests for alleged violations of existing anti-gay laws (Carroll and Mendos Reference Carroll and Mendos2017). It is likely that international rights-based institutionsFootnote 7 and contentious transnational politics have helped galvanize homosexuality as a salient topic, further spurring a narrative that presents gay rights as “neocolonial” (Ayoub Reference Ayoub2014; Kaoma Reference Kaoma2009). At the same time, politically conservative international groups increasingly offer financial incentives to political or religious institutions in Africa in exchange for promoting anti-LGBTQ policies.
Concurrently, pro-LGBTQ groups are growing increasingly active and allied with other democratic agendas (Anyangwe Reference Anyangwe2016), including women's movements (Tripp Reference Tripp2015), to protest homophobic policies. Africa's “third wave” democratic transitions in the 1990s expanded citizen representation and increased political rights for many disfranchised groups (Lindberg Reference Lindberg2006). South Africa's constitutional reforms in the 1990s included protections for sexual minorities and laid the foundation for full legalization of same-sex marriage in 2006. Today, queer advocates and civil society partners often channel these democratic political-rights ideologies to challenge anti-gay policies and critique governments' failures to protect gays from violence. In some cases, domestic gay rights organizations have won important legal battles. The Ugandan Constitutional Court overturned its notorious Anti-Homosexuality Act and the Kenyan High Court ruled to allow gay-rights groups to form non-governmental organizations (Agoya Reference Agoya2015).
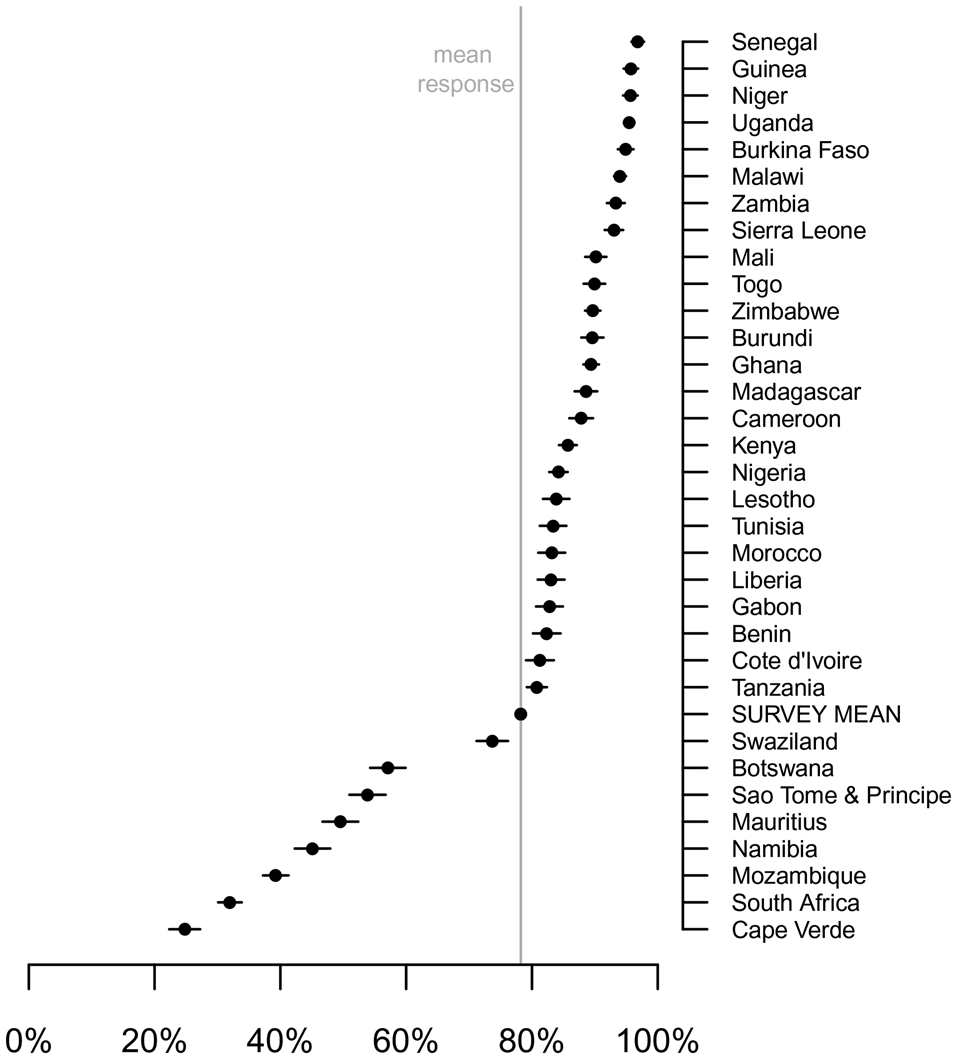
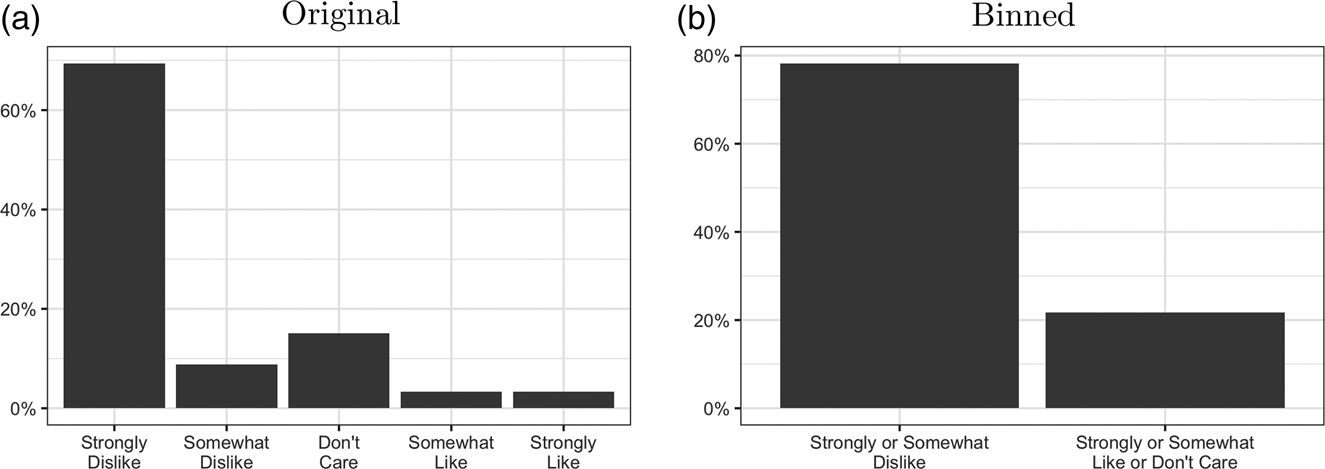
Overlaying these momentous developments on Africa's recent political and social in/exclusion of gays and lesbians, it remains unclear the degree to which public opinion supports trends against or in favor of gay rights. Little systematic research has sought to understand African mass attitudes on gay issues.Footnote 8 The Afrobarometer data we employ (from 33 countries) only somewhat confirms the oft-repeated assumption that Africans by and large reject homosexuality: 78% of citizens harbor hostility toward sexual minorities in their communities, while the remaining 22% exhibit tolerant attitudes (Figures 1 and 2). These baseline numbers show that homophobia is far from universal. At the same time, expressed religiosity also remains high: 83% of respondents reported that they practice their religion at least once a month or more, 51% practice at least a few times a week, and 24% practice more than once a day. Only 9% report that they never practice their religion. Given these attitudinal patterns and levels of religious membership alongside the fact that homosexuality has only recently become important politically, beliefs regarding homosexuality may be less entrenched than expected.
Percent who would dislike having a gay neighbor (by country).

Distribution of individual respondents' tolerance for homosexuality.

SOCIAL DIVERSITY AND TOLERANCE
We now present a conceptual framework for understanding the conditions under which a person might become more tolerant of gays and lesbians. Because social norms like those regarding homosexuality are governed by religious institutions, and because religion influences politics and public debate in Africa, we investigate whether religion serves as a vehicle for engendering more (or less) tolerant attitudes toward homosexuality. Even as elite religious leaders in Africa take strong anti-gay stances backed by political leaders and policies, a thriving religious environment may help counteract these sentiments. Attitudes and behaviors shift as different social identities encounter and contend with one another. We therefore expect religious diversity to be particularly determinative in the terrain of gay rights, and review two contrasting approaches regarding whether and how social diversity drives mass attitudes, which could lead to a relaxing of adherence to specific religious teaching. This literature provides different predictions for, and accounts of, the possible effects of increased religious diversity on attitudes toward sexual minorities. We then discuss why aspects of religion and religious diversity specifically could play a role in dislodging anti-gay sentiments.
A first body of scholarship warns of the harmful effects of social diversity on tolerance. While homogeneous social units appear more successful at cooperating and producing public goods (Habyarimana et al. Reference Habyarimana, Posner, Weinstein and Humphreys2009), increasing levels of pluralism in communities introduces competition over resources between groups, collective action barriers, and out-group hostility (Huckfeldt and Kohfeld Reference Huckfeldt and Weitzel Kohfeld1989). Social diversity can inspire outbidding, entrench social identities, and decrease tolerance toward other groups or “newcomers” (Enos Reference Enos2014).Footnote 9 Such competition between religious groups specifically can incentivize religious minorities to sharpen their distinct religious identity (Vermeer and Scheepers Reference Vermeer and Scheepers2017).Footnote 10 If attitudes toward homosexuality follow these patterns, religious or other forms of social diversity could inhibit Africans' pro-social behavior, entrench attitudes against “outsiders,” and undermine tolerance toward marginalized groups, including sexual minorities. Individuals from communities with higher levels of religious diversity would therefore be more likely to harbor anti-gay sentiments relative to counterparts living in homogeneous environments.
A contrasting literature argues that exposure to social diversity could promote inclusion and tolerance. People often update their attitudes when they interact directly with those who are perceived as different or marginalized. Researchers attribute inter-religious cooperation (Raymond Reference Raymond2016) and tolerance toward out-groups or marginalized identities to various forms of social diversity (Kasara Reference Kasara2013), including socio-economic heterogeneity (Branton and Jones Reference Branton and Jones2005), reductions in exclusionary social solidarity (Gibson and Gouws Reference Gibson and Gouws2000), or increases in social identity complexity (Brewer and Pierce Reference Brewer and Pierce2005). If following these patterns, religious diversity could help strengthen Africans' inclusionary attitudes toward their gay and lesbian neighbors.
We contend that the general effect of social diversity on tolerance might be particularly meaningful with regard to religious diversity and sexuality in Africa because religious institutions govern social attitudes about queer identity in Africa. We identify two mechanisms that likely connect religious diversity to social tolerance toward a community's “others” in uniquely meaningful ways.
First, religion is central to the daily lives of its many African adherents. As an institution, religion can be remarkably formative in everyday life and political behavior (Helmke and Levitsky Reference Helmke and Levitsky2004) in ways similar to, but distinct from, ethnicity (Cunningham, Gates, and Nordås Reference Cunningham, Gates and Nordås2011). People living in religiously diverse places are likely to grow accustomed to witnessing, experiencing, and living among practices separate from their own. Each group may need to accommodate different daily practices, which can introduce challenges in public life. For example, Christians may experience Muslim calls to prayer and Ramadan fasts, while Muslims may have to hear Sunday morning worship or adjust to fasting days. This diversity could then have either an ossifying or moderating effect on residents' tolerance toward those different from themselves:Footnote 11 if individuals' exposure to diversity strengthens their intolerance of those who are different (“social threat”), living in a more religiously diverse community could drive immoderate views on socio-religious issues, including homosexuality. However, if encountering and accommodating alternative religious practices within a shared community makes people more accustomed to cultivating difference, living among other religious adherents could make a person more tolerant of people, like sexual minorities (even if religious leaders reinforce public stances against homosexuality).
Second, a religion's comprehensive yet unfalsifiable claim to truth may render it fragile in the face of alternative doctrines. Every religion claims to be the exclusive holder of truth and dictates the permissible bounds of social and sexual behavior accordingly. But religious plurality can disrupt—or what Taylor (Reference Taylor2007) terms “fragilize”—adherents' convictions.Footnote 12 For example, Catholics who are in close contact with Pentecostals and Muslims must confront the possibility that tenets of Catholic teaching may be weak in whole or in part because their neighbors adhere to an alternative doctrine. Although this religious pluralism does not necessarily undermine religiosity (Stark and Finke Reference Stark and Finke2000),Footnote 13 it could disrupt adherents' dogmatic commitment to the social norms that religion dictates. Religious diversity may cause individuals to confront the possibility of alternative theological truths and therefore reconsider their unwavering commitments to their particular religious paradigm. As a result, individuals' religious beliefs—or the strength with which they attach those beliefs to the social world—may weaken when they live in more pluralistic communities.
Religious diversity may therefore accustom people first to living more comfortably with those who abide by alternative doctrines and behaviors, and then to consider the fallibility of their own doctrines. If so, we predict that increased religious diversity may help cultivate tolerance toward the same-sex practices and identities admonished by religious teachings, and hypothesize that as a person's community becomes more religiously diverse, that person is increasingly likely to express more moderate social attitudes—those that may not strictly conform to the teachings of that person's religion, like acceptance of homosexuality. Conversely, people living in areas with greater religious homogeneity will not experience this exposure and are therefore likely to maintain higher levels of homophobia.
RESEARCH DESIGN
We analyze data from the Afrobarometer Round 6 survey, which interviewed almost 54,000 individuals from 36 African countries, 33 of which were surveyed about attitudes toward homosexuality between 2014–15 (Table A.1).Footnote 14 Round 6 provides a unique lens to test our hypothesis because it was the first to survey respondents across a majority of countries about their support for homosexuality, and because it was conducted at a moment of potential change in mass attitudes toward gay citizens.Footnote 15
Tolerance of Homosexuality
Our dependent variable captures a person's attitude toward homosexuality, surveyed by the respondent's level of openness to having a “homosexual” as a neighbor. The question (89c) was included in a battery intended to measure social tolerance toward a variety of social groups. The question asks: “Please tell me whether you would like having people from this group as neighbors, dislike it, or not care: homosexuals.” The respondents could answer: “strongly dislike,” “somewhat dislike,” “would not care,” “somewhat like,” or “strongly like.” We bin responses to create the binary dependent variable, tolerance for homosexuality, coded as “1” for individuals responding that they would not care, somewhat like, or strongly like having a homosexual neighbor; or “0” for those who reported they would strongly dislike or somewhat dislike having a homosexual neighbor.Footnote 16 The resulting binary variable, divided between generally positive and negative tolerance, is substantively meaningful according to Ayoub (Reference Ayoub2016, 134), who argues that this particular question provides the opportunity to “uncover respondents’ willingness to practice intolerance by placing themselves in a scenario in which they single out gay and lesbian people for discrimination”. Figure 2 plots the distribution of the original and our binary dependent variable.Footnote 17
Afrobarometer's word choice (“homosexuals”) does not prompt respondents to think about any specific sexual identity, but it also technically excludes fluid sexualities or other identities beyond gay, lesbian, and arguably bisexual individuals. However, the generality of their wording also provides certain advantages. Afrobarometer surveys are conducted in more than 100 languages, many of which likely have internal idiosyncrasies related to the characterization and politics of same-sex relations. This creates potential for significant variation in what is considered descriptive versus derogatory reference to queer identities and would have introduced inconsistency in the measure, undermining the likelihood that the question measures a comparable concept across languages. “Homosexual” (and its local language translation) is the most appropriate term for assessing attitudes toward same-sex practices across the continent currently, and we believe respondents would have understood it to apply broadly to non-heterosexual sexual minorities. Further, while survey respondents often refuse to answer questions on topics that are socially taboo or with which they have no knowledge, only 1.5% of respondents refused to answer our main question of interest or replied that they “don't know.”Footnote 18 This gives us confidence that respondents understood the term “homosexual” and the concept it was intended to represent with respect to queer minorities.
Religious Diversity
Our main independent variable on local religious diversity is operationalized as district-level religious diversity constructed with an inverse Herfindahl-Hirschman Index (HHI) from respondents' reported religious affiliation. Districts, which vary in size, are the smallest spatial unit publicly available from Afrobarometer (which locates each respondent in three levels of geographic space: country, sub-national region, and district). Districts are plausible units for measuring the effects of religious homogeneity or cross-religious interaction given that individuals living in the same district would likely encounter each other at markets, schools, community events, transportation hubs, and administrative bodies. The HHI represents the probability that two randomly selected individuals from within a defined population (here, district) will belong to the same group (Simpson Reference Simpson1949). We calculate a district's HHI by summing the squares of the proportion p(x i) of identity x i (e.g. Anglican) in a district (equation 1). As a measure of demographic concentration, HHI increases as diversity decreases. The scaled HHI ranges from 1/n (where n = number of unique religious or ethnic identities present in a district) to 1. When 1/n approaches zero it represents perfect diversity among a wide range of identities; an HHI of 1 represents complete demographic homogeneity. We calculate the inverse HHI to transform our variable from a measure of concentrated homogeneity to one of diversity, where HHI approaches 1 as it represents an increasingly pluralistic community and 0 if it represents respondents from a single religious group. We perform this procedure for 2,095 distinct districts in the dataset.
 $$1 - \mathop {\mathop \sum \nolimits} \limits_n^{i = 1} \lpar {p\lpar {x_i} \rpar } \rpar ^2$$
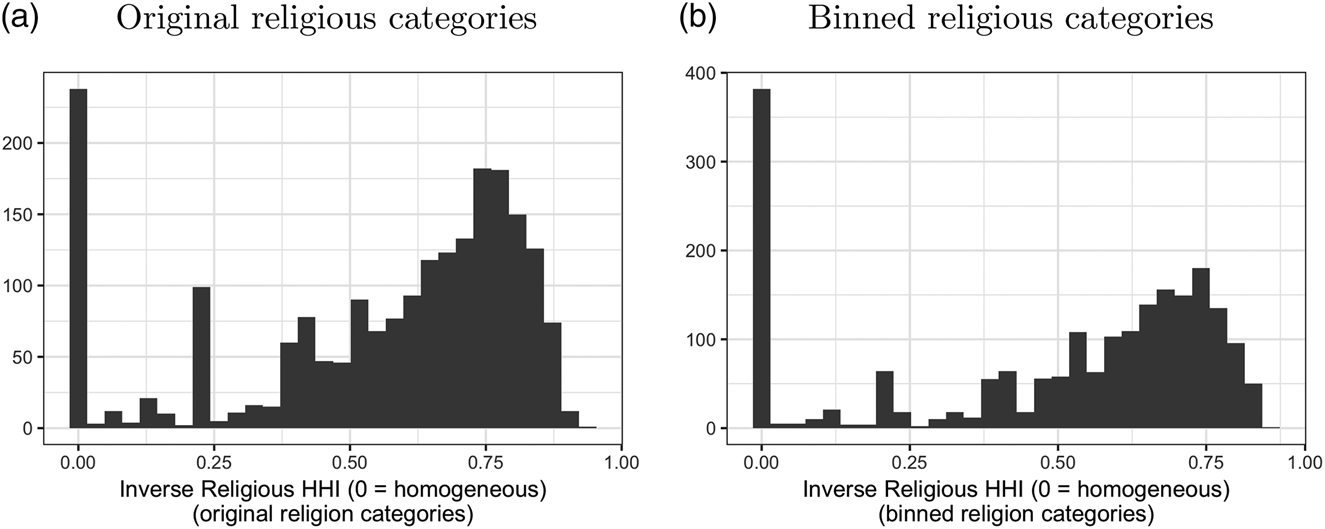
Figure 3a shows the distribution of the inverse HHI calculated using the survey's original granulated coding scheme; Figure 3b shows the HHI distribution when respondents are binned into meaningful religious categories: Catholic, Anglican, mainline (non-independent) Protestant, Pentecostal/Renewalist, Christian (unspecified), Muslim, Traditional/Ethnic, Hindu or Baha'i, Agnostic or Atheist, and Other.Footnote 19 As expected, the binned HHI calculation retains the shape of the original variable with a lower mean (indicating higher homogeneity when categories are binned).Footnote 20 To better illustrate the HHI measure and its application in a country and district, Tables A.4 and A.5 provide examples of how HHI values reflect the externally known religious and ethnic breakdowns among sample districts in Kenya.
Distribution of religious diversity by district

Estimation
Our primary model estimates the following linear probability equation:
 $$Y_i = \alpha + \beta _1 \lpar {ReligiousDiversity_d} \rpar + \delta \lpar {X_{i,d}} \rpar + \eta + \epsilon _d$$
where i indexes individuals and d districts. Y is respondent i’s attitude toward homosexuality, Religious Diversity is the inverse HHI measure assigned to every individual based on her/his district's degree of religious heterogeneity, and β is the coefficient of the explanatory variable. δ is a vector of coefficients for the control variables, X is a matrix of controls,Footnote 21 η is a country-fixed effect,Footnote 22 and ε is the standard errors clustered by district. Table A.3 provides descriptive statistics for all of the variables used in analyses.
RESULTS
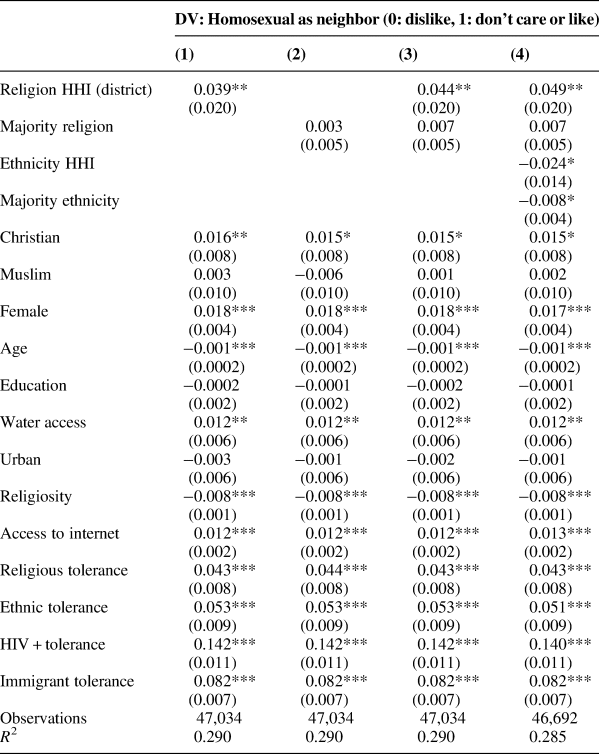
Table 1 presents results from four linear probability models estimating the effects of religious diversity on a respondent's likelihood of expressing tolerant attitudes toward homosexuals. Positive coefficients indicate increased pro-gay sentiment and standard errors are clustered by district. Because religious diversity might impact majority and minority religious members differently, we control for religious majority status in Models 2–4.Footnote 23
Effect of district-level religious diversity on attitudes toward homosexuals (linear probability models)

Notes: All models include country-fixed effects. Standard errors are clustered at the district level. *p < 0.1; **p < 0.05; ***p < 0.01
In Model 1, the inverse HHI measure of religious concentration is positive and significant: respondents from religiously diverse districts are about 3.9 percentage points more likely to report pro-homosexuality attitudes than those living in homogeneous districts. Model 2 replaces the inverse HHI measure with a binary variable for membership in the district's majority religion, which is positive but not significant. Model 3 combines the inverse HHI from Model 1 with the dummy for majority-religion membership from Model 2. The HHI remains positive and significant as respondents from diverse districts are about 4.4 percentage points more likely to report pro-gay beliefs than those in homogeneous districts. Model 4 includes a control for district-level ethnic diversity and whether the respondent identifies with their district's majority ethnic group; neither of these measures has a significant bearing on religious diversity's effect on pro-gay attitudes at the p<0.05 level. Table 1 also shows that support for homosexuality decreases as individuals get older or express higher degrees of religiosity. Christians are slightly more likely to support homosexuality compared to Muslims, but this result is substantively small and statistically weak. Female respondents and those with increased access to water (an income proxy) and internet are more tolerant.Footnote 24 Perhaps surprisingly, those who live in urban areas and who are more educated do not express higher (or lower) levels of support.Footnote 25 The stability of the inverse HHI across these model specifications, as well as alternative logit and ordinal probit models (Tables A.6 and A.7), supports our hypothesis that local religious diversity makes a meaningful contribution to predicting variation in pro-homosexuality attitudes throughout Africa.
The main models in Table 1, along with additional tests, account for observable and latent factors at the country, sub-national, and district levels. First, they include country-fixed effects to account for the variation in responses shaped by country-level factors, such as political institutions or government policies toward sexual minorities.Footnote 26 Our models also account for a district's religious and ethnic make-up, which could influence if, and how, religious diversity affects individuals' social tolerance. In Models 2–4, we calculate the majority ethnic and/or religious group of each district and control for whether the respondent is a member of these groups; in Model 4, we control for the degree of ethnic diversity within each district. In additional tests, we control for district-level averages of social tolerance from an aggregate measure of tolerance toward other religions, other ethnic groups, immigrants/foreigners, and individuals living with HIV/AIDS. These results show that our finding is not driven by a community's general tolerance; instead, religious diversity has an even stronger effect on support for homosexuality after controlling for a district's generalized social tolerance (Tables A.17 and A.18). We address additional possible sub-national confounders by re-estimating all of the main models with the inclusion of a region-fixed effect (Table A.19). Even after accounting for country, sub-national, and district attributes, religious diversity continues to have a meaningful positive effect on respondents' tolerance of homosexuality.
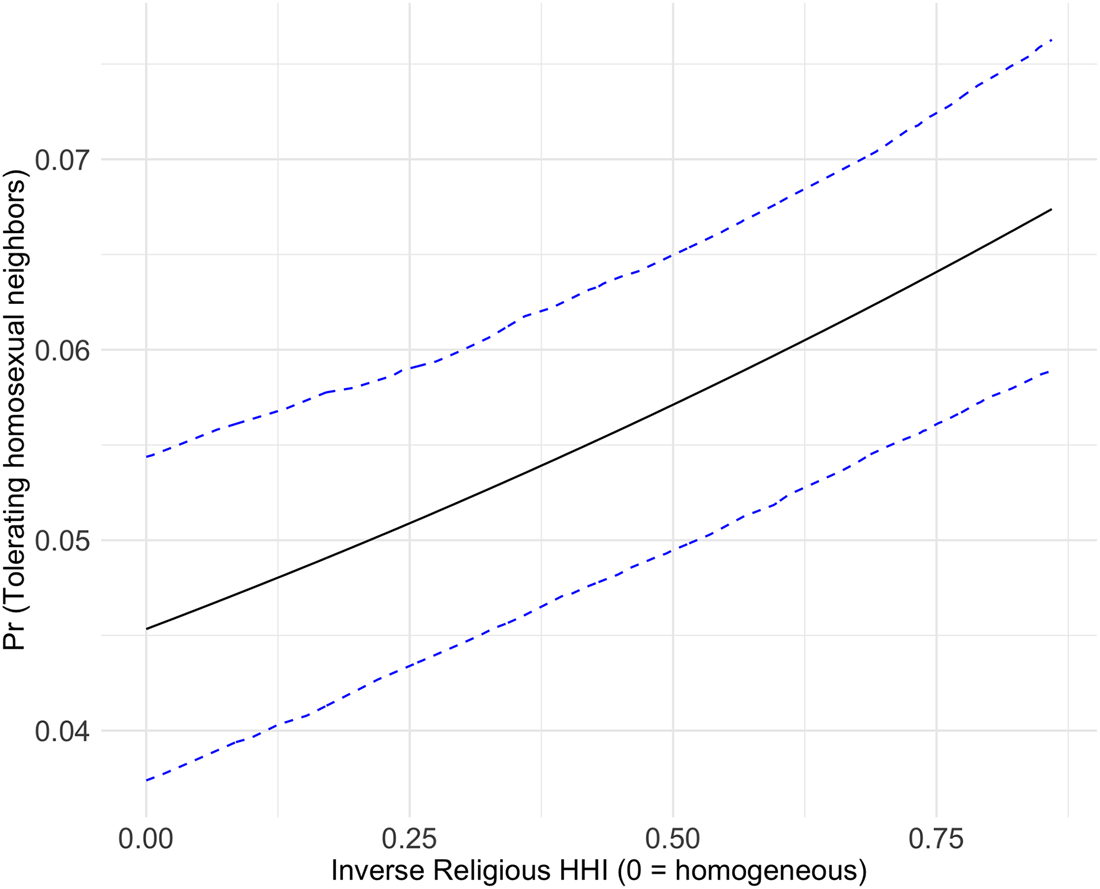
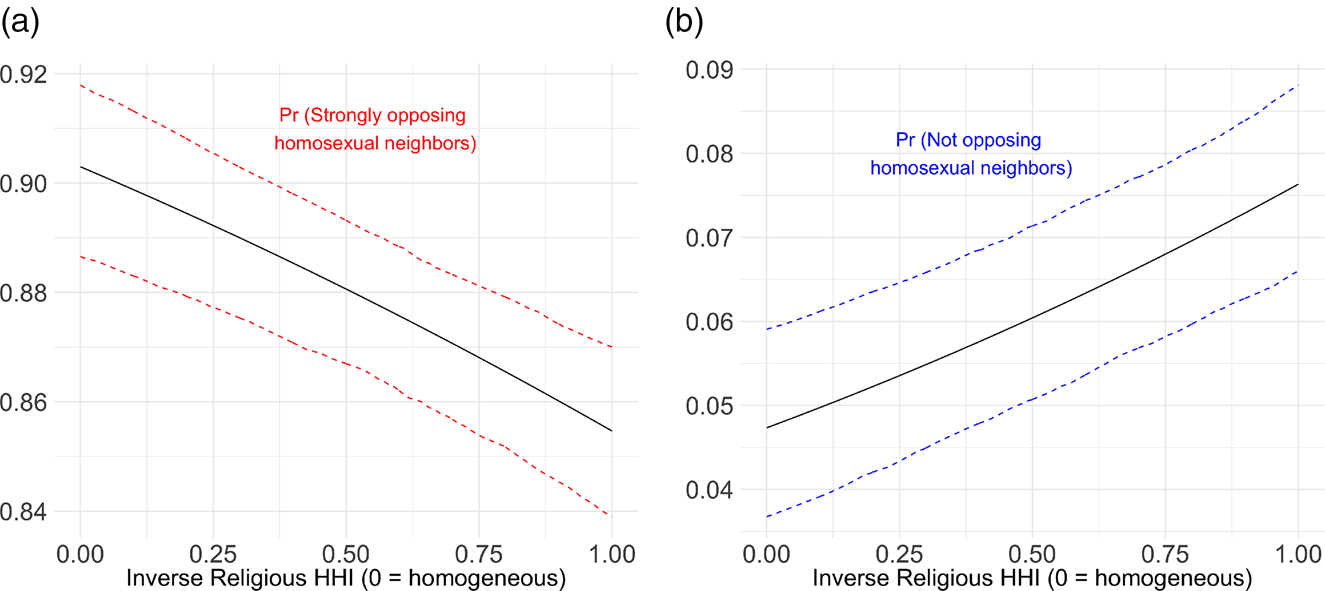
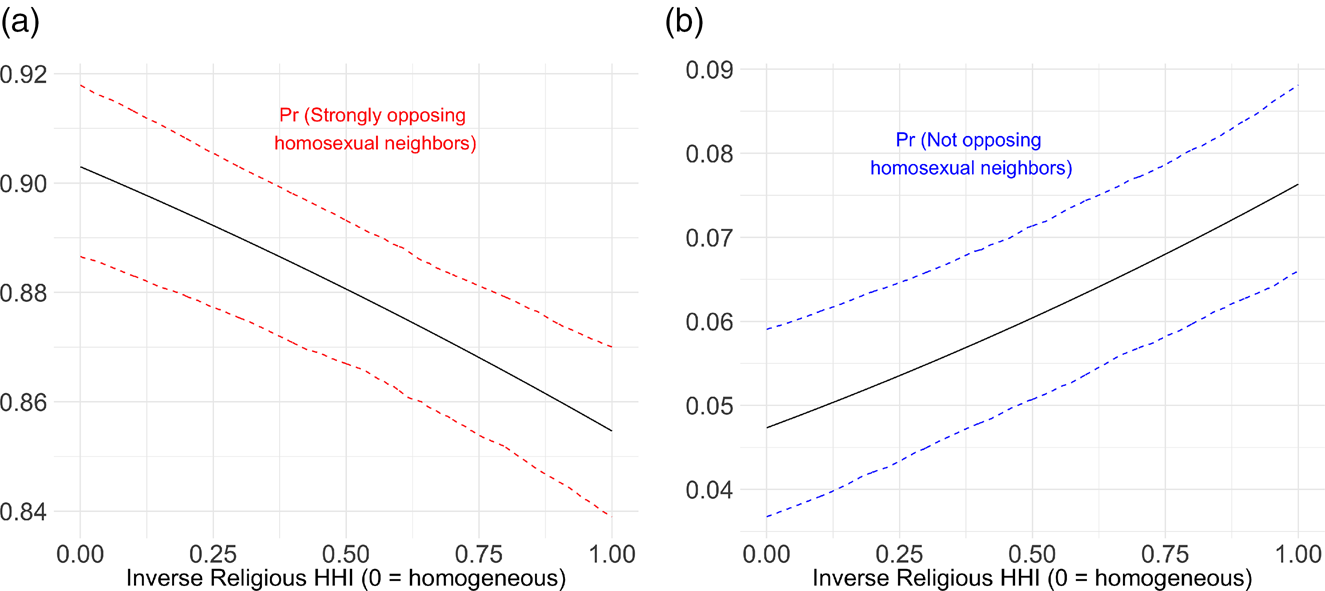
To clarify the substantive impact of religious diversity on attitudes, Figures 4 and 5 visualize Model 3's (from Table 1) logit and ordered probit estimations.Footnote 27 Figure 4 shows the predicted increase (a roughly 50% shift) in tolerance of homosexuality (from 0 = intolerant to 1 = tolerant) as an individual moves from a district where there is no religious diversity to a district that is perfectly diverse. Figure 5 displays ordered responses and predicted probabilities of a respondent indicating strong opposition to homosexual neighbors (Figure 5a) and no opposition to homosexual neighbors (Figure 5b). Results show that individuals' strong dislike for the idea of having a homosexual neighbor falls by more than four percentage points as they move from a district where there is no religious diversity to a district that is perfectly diverse (Figure 5a). Individuals' tolerance grows by nearly three percentage points as they move from homogeneous to pluralistic districts (Figure 5b).
Effect of religious diversity on tolerance of sexual minorities (logit).

Effect of religious diversity on attitudes toward sexual minorities (ordered probit).
Robustness
While observational survey data necessarily impose limitations to causal inference, the data are sufficiently rich to enable us to address numerous potential validity threats with robustness checks regarding omitted variables, selection threats, and measurement. We summarize here the steps we take to address inferential threats, which we expand upon in the Appendix.
One alternative explanation for our results could be that our effects do not stem from religious homogeneity/diversity but from the presence of specific religious adherents who harbor particularly anti-gay attitudes. Grossman (Reference Grossman2015) provides evidence that a growth of Pentecostalism engenders increased political salience of LGBTs in Africa. Meanwhile, although Muslims in East Africa are seen as more tolerant of homosexuality than Muslims in the Middle East, Muslim adherents could similarly be more conservative in their beliefs, relative to other religious groups. Indeed, evangelical Protestants (including Pentecostals) and Muslims exhibit higher levels of intolerance toward homosexuals than those in other Christian groups (Table A.24, Model 7). However, if the presence of people who are more likely to hold exclusionary attitudes (like possibly evangelical Protestants or Muslims) drive our main results, then homogeneous evangelical Protestant or Muslim areas would be less tolerant of sexual minorities, compared to homogeneous Catholic or mainline Protestant areas or areas with a combination of religious groups. Robustness tests suggest that respondents from homogeneous evangelical Protestant districts are only slightly less likely to tolerate gay neighbors than those in other Christian homogeneous districts, while homogeneous Muslim areas are less likely to harbor anti-gay attitudes (Table A.24, Figure A.24). Nevertheless, there remains a positive statistically significant relationship between religious diversity and tolerance even in districts subsetted to each religious sub-group. These robustness checks suggest that while individual evangelical Protestant or Muslim respondents may be less likely to tolerate homosexuality, the presence of these respondents does not account for the effects of diversity on attitudes. Moreover, there is a stronger relationship between religious diversity and gay tolerance among the subset of respondents from districts with multiple religions present (i.e., those districts which contain at least one evangelical, mainline, Catholic, and Muslim respondent), relative to all respondents from all districts (Table A.24).
Next, to mitigate concerns that diversity in general, or latent aspects of it, accounts for our results, we perform two tests to demonstrate that religious diversity has a unique effect on gay attitudes. As mentioned, the introduction of a control for district-level ethnic diversity in Model 4 above does not affect our main findings. To further confirm that ethnic diversity does not similarly engender tolerance for gays and lesbians, we replicate our main model (Model 3) with an inverse HHI of ethnic diversity in Tables A.13 and A.14 to compare the effects of religious (Model 1) and ethnic (Model 2) diversity. Crucially, district-level ethnic diversity does not produce a similar effect on support for homosexuality as compared to district-level religious diversity.
We also examine the possibility that people who are dispositionally tolerant in general—and more tolerant of sexual minorities in particular—self-select into religiously diverse communities or that members of the gay community select into religiously diverse districts in order to live around those more tolerant of their sexual identities. We alleviate concerns of these selection threats in two ways. Qualitatively, there are strong historical and empirical reasons to suspect that people tolerant of homosexuality are not self-selecting into religiously diverse areas. Because the politicization of queer identities is relatively recent, same-sex attitudes are not likely to account for migration patterns prior to 2014, the first year that Afrobarometer Round 6 was conducted. Existing research also indicates that migration within African countries is most strongly driven by economic or crisis-related concerns.
Quantitatively, we demonstrate that religious diversity has a unique effect on support for homosexuals, but not tolerance more generally or toward other types of social groups. We do so, first, by including controls for various types of social tolerance in all models (Table 1). Religious diversity's effect on acceptance of homosexuality maintains even when controlling for tolerance of other social groups. Our models therefore do not simply capture a respondent's overall latent social tolerance (which also alleviates concerns of self-selection of generally tolerant individuals into diverse districts). Next, we perform a series of placebo tests by replicating our main model (Model 3) on the other four variables included in the battery of social tolerance questions (Tables A.15 and A.16). As expected, religious diversity has a significant positive effect on tolerance toward other religious groups; however, it does not have a significant effect on tolerance toward non-co-ethnics, people living with HIV/AIDS, or immigrants.Footnote 28 By demonstrating that religious diversity tempers attitudes toward religiously proscribed behavior (e.g., same-sex relations) and members of other religious groups, but does not shape attitudes toward behaviors or social identities less linked to religion, these placebo tests further support our argument that religious diversity has a unique influence on respondents' attitudes toward homosexuals. The placebo tests also provide additional evidence that our results are not driven by a selection threat, in which socially tolerant individuals systematically move to religiously diverse districts.
We also consider whether people in religiously diverse areas express tolerant attitudes simply because they are more exposed to gay identities or issues than those in homogeneous communities. We control for such information and exposure with two proxies (internet consumption and urban residence) in Table 1.Footnote 29 Internet consumption has a small positive effect (roughly 1.2 percentage points) on attitudes toward homosexuality while urban residence has no consistent effect, but religious diversity's significant positive effect maintains in models that include these additional proxies. Our results therefore do not appear simply as artifacts of increased exposure to queer identities or by individuals living in diverse areas.
Last, we address potential measurement biases in the construction of our independent and dependent variables. Our core explanatory variable, measured by the inverse HHI of religious diversity, should alleviate concerns of survey-response bias because it is constructed from district-aggregated responses and therefore cannot be endogenous or spurious to individual responses on attitudes toward gays and lesbians. Afrobarometer's sampling procedure also alleviates concerns of measurement bias due to sampling.Footnote 30 However, we also replicate our main tests with different granularities of the HHI measurement at the sub-national regional level, a higher unit of aggregation than the district level. Results with this different measurement specification remain consistent (Tables A.22 and A.23).
Plausible measurement biases in our outcome variable may arise if respondents systematically conceal their true beliefs. This may be a particularly relevant issue among African survey respondents, given the popular rejection of homosexuality across the continent. If so, we expect that any misrepresentation would result in individuals under-reporting their feelings of tolerance toward sexual minorities, resulting in a systematic under-estimation of pro-queer attitudes. To the extent that such noise exists, it is likely to be orthogonal to our main explanatory variable of religious diversity, given how our HHI measure was constructed. Nevertheless, we further explore whether an unobserved social desirability factor may have systematically driven respondents to hide their preferences. If so, it likely not only drives responses to tolerance toward homosexuals, but also toward other social groups. We would therefore expect responses on these items to correlate consistently, highly, and significantly. Table A.2 investigates this possibility by presenting pairwise correlations between social tolerance questions. Responses on beliefs about views of other marginalized groups (e.g., immigrants or those living with HIV/AIDS) do not correlate with responses on homosexuals. Therefore, it does not appear that a latent social desirability bias confounds our measurement or explains our results.
CONCLUSION
This paper examines the interplay between contemporary religious and political dynamics and variation in public support for homosexuality throughout Africa. Respondents from across the continent harbor somewhat high levels of anti-gay attitudes. This is unsurprising, considering its history of missionary-colonial interventions, high levels of literalist approaches to interpreting religious texts, and contemporary dynamics that allow powerful elites to marginalize and demonize sexual minorities for political gain. At the same time, we provide systematic and robust evidence of certain social conditions which may help moderate attitudes, and we argue that because local religious diversity exposes community members to alternative religious-moral paradigms, it may engender openness to social out-groups community members would have otherwise rejected. Our results show that as local religious diversity increases, surveyed Africans are more likely to express same-sex-tolerant attitudes.
Our paper contributes to comparative research on politics, religion, and political behavior in Africa. First, we incorporate religion as a critical driver of mass political attitudes and identify social conditions that may disrupt widespread African support for queer-exclusionary politics at a time when little is known about such attitude defection. Second, we provide nuanced insights to research that examines the variously pro- and anti-social effects of social diversity on individual behavior and group outcomes. While research has often shown ethnic diversity to undermine local collective cooperation, we demonstrate that religious diversity could facilitate tolerance toward out-groups and marginalized individuals. Similar to Ayoub (Reference Ayoub2014; Reference Ayoub2016), our results challenge simple conclusions regarding the relationship between religion and homosexuality based on levels of religiosity or specific religious denominations. Rather, religion's ability to activate beliefs that are politically important for gays and lesbians may reside in different aspects of religion's role in public life, related to levels of religious diversity.
Identifying religious diversity as a promising venue for tolerance introduces both opportunities and challenges for scholars, policymakers, and gay activists. On the one hand, our evidence suggests that homophobic attitudes are less fixed and more movable than previously assumed. If African countries follow similar trajectories that scholars have observed in industrialized democracies—where state LGBTQ-rights policies generally followed shifts in social attitudes—this movement toward greater social tolerance may precede African states' adoption of pro-gay policies. On the other hand, religious diversity on its own is not likely to change the landscape for Africa's sexual minorities quickly, given the stable nature of religious demographics at the local level.
These realities generate two promising research and policy frontiers. First, social scientists could examine the scope of the relationship between religious diversity and social attitudes and begin to explore the specific mechanisms that link diversity to gay tolerance. Second, our analysis provides evidence that could help inform public-policy initiatives dedicated to improving queer rights. While African governments have pursued mostly restrictive legislation and religious leaders mostly promulgate anti-gay theologies, citizens may not be as homophobic or attached to anti-gay attitudes as many people assume. Certain social conditions may foster attitude change. Stakeholders could use this evidence to further employ tools that leverage democratic activism in Africa to advance LGBTQ rights. While we are unlikely to see dramatic shifts in levels of religiosity at the district level in the short-term (even if diversity slowly increases with geographic mobility), evidence that individuals' attitudes are shaped by, and may grow tolerant because of, everyday interactions with social “others” provides important insights for how cultivating social exchanges among diverse identities can further social tolerance.
SUPPLEMENTARY MATERIAL
To view supplementary material for this article, please visit https://doi.org/10.1017/S1755048319000348