Introduction
After quantum dots, nanowires, and nanotubes, two-dimensional (2D) materials in the form of sheets with atomic-scale thickness represent the most recent nanoscale material family under intense study. These materials appear in their bulk form as stacks of layers held together via van der Waals interaction in crystals. Single layers with atomic-scale thickness can be extracted from such crystals. The best-known example is graphite, composed of individual graphene layers. Two-dimensional materials are attractive for use in electronic devices because, compared to nanowires and nanotubes, it is easier to fabricate complex structures from them. Their atomic-scale thickness makes it possible to tune their properties using external electric fields, while control over the number of layers in mesoscopic structures gives an additional way to modify their electronic and optical properties.Reference Kuc and Heine1,Reference Wang, Kalantar-Zadeh, Kis, Coleman and Strano2
The first layered material to be thinned to a single monolayer (ML) was graphite, where the ML is referred to as graphene.Reference Novoselov, Geim, Morozov, Jiang, Zhang, Dubonos, Grigorieva and Firsov3 It continues to be widely studied because of its rich physics and high mobility.Reference Novoselov4 However, pristine graphene does not have a bandgap, which is required for many applications in electronics and optoelectronics. Bandgaps can be engineered in graphene, but this increases complexity either reduces mobilities to the level of strained silicon films (∼100 cm2/Vs at room temperature) or requires voltages on the order of 100 V.Reference Zhang, Tang, Girit, Hao, Martin, Zettl, Crommie, Shen and Wang5,Reference Xia, Farmer, Lin and Avouris6
One of the key advances that brought attention to 2D semiconductors was the demonstration of a field-effect transistor (FET) with a high ON/OFF ratio based on a single layer of MoS2,Reference Radisavljevic, Radenovic, Brivio, Giacometti and Kis7 a semiconducting material from the transition-metal dichalcogenide (TMDC) family. This was the first demonstration of a high-quality device based on a 2D material other than graphene.
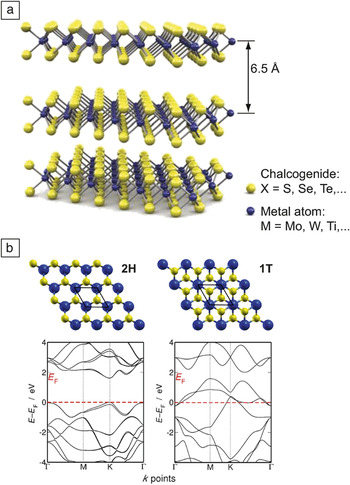
MoS2 (Figure 1) is a member of a large family of materials known as TMDCs (please see the Introduction article in this issue of MRS Bulletin). They have the common chemical formula MX2, where M stands for a transition metal (M = Mo, W, Nb, Ta, Ti, Re) and X for Se, S, or Te. Bulk TMDC crystals are formed by vertical stacking of 2D layers that are ∼6.5 Å thick. Depending on the chemical composition, they can have different electrical properties ranging from semiconducting to superconducting. Single layers can be extracted using the micromechanical cleavage technique,Reference Novoselov, Jiang, Schedin, Booth, Khotkevich, Morozov and Geim9,Reference Benameur, Radisavljevic, Heron, Sahoo, Berger and Kis10 commonly used for the production of graphene or liquid phase exfoliation, a mild solvent-based exfoliation technique.Reference Coleman, Lotya, O'Neill, Bergin, King, Khan, Young, Gaucher, De, Smith, Shvets, Arora, Stanton, Kim, Lee, Kim, Duesberg, Hallam, Boland, Wang, Donegan, Grunlan, Moriarty, Shmeliov, Nicholls, Perkins, Grieveson, Theuwissen, McComb, Nellist and Nicolosi11 Large-area MoS2 can be grown using chemical-vapor-deposition-like growth techniques.Reference Najmaei, Liu, Zhou, Zou, Shi, Lei, Yakobson, Idrobo, Ajayan and Lou12,Reference van der Zande, Huang, Chenet, Berkelbach, You, Lee, Heinz, Reichman, Muller and Hone13 The lack of dangling bonds also makes it possible to re-stack different 2D materials in the vertical direction and produce heterostructuresReference Britnell, Gorbachev, Jalil, Belle, Schedin, Mishchenko, Georgiou, Katsnelson, Eaves, Morozov, Peres, Leist, Geim, Novoselov and Ponomarenko14 without the requirement of lattice matching.
(a) Three-dimensional representation of the structure of transition-metal dichalcogenides (TMDCs) with the common formula MX2. Single layers can be extracted and used as the starting point for fundamental research and device applications. (b) Structure (top) and band structure (bottom) of monolayer MoS2 in 2H, trigonal prismatic, (left) and 1T, octahedral, (right)Reference Wypych and Schollhorn8 symmetry. The Fermi level (E F) is indicated by the red dashed line. Courtesy of Nourdine Zibouche (Jacobs University Bremen). Note: E, energy.
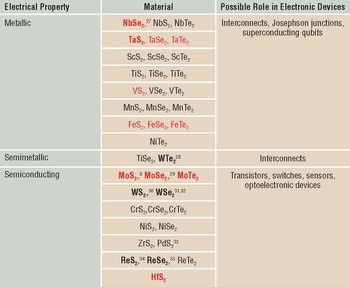
Around 60 TMDC materials were known in the late 1960s, with around 40 of them having a layered structureReference Wilson and Yoffe15 (Table I). First reports of ultrathin (10 nm thick) MoS2 date back to 1963,Reference Frindt and Yoffe16 while the production of single-layer MoS2 in suspension was first reported in 1986.Reference Joensen, Frindt and Morrison17 The rapid growth of graphene-related research and the development of new techniques for working with ultrathin layered materials opened new perspectives for the study of 2D TMDC layers. The indication that TMDC MLs are fundamentally different from thicker bulk material came with the realization that the bandgap of MoS2 changes from the bulk value of 1.2 eV18 to 1.8 eV19,20 as the thickness is decreased down to a ML. This is due to quantum-mechanical confinement in the vertical directionReference Kuc, Zibouche and Heine21 and the resulting change in hybridization in orbitals related to M and X atoms. Moreover, unlike the bulk material, single-layer MoS2 is a direct gap semiconductor. This seems to be a general feature shared by many other semiconducting TMDCs (MoSe2, WS2, WSe2, MoTe2) that are expected to show indirect to direct bandgap transitions in the limit of a single layer, spanning the 1.1–1.9 eV bandgap energy range.Reference Kuc, Zibouche and Heine21–Reference Ataca, Şahin and Ciraci25
Overview of stable layered transition-metal dichalcogenides.

First experimental studies on mesoscopic structures have been performed on compounds in bold. 2H (trigonal prismatic) structure; most stable are in red.Reference Ataca, Şahin and Ciraci25
Even though a large number of layered TMDCs are known, only a handful of them are widely available in the form of a synthetic material. Most of the recent research efforts are concentrated on semiconducting TMDCs due to their potential for applications in electronics, with MoS2 being the most studied example due to the fact that it is also available in the form of a naturally occurring mineral, molybdenite.26
Modeling the electronic structure of TMDCs
Important contributions to the development of the field of 2D crystals have come from theory. While theory offers an explanation of many fundamental experimental effects, many phenomena have been predicted by computer simulations. In the following, some of these examples are compiled, with a focus on our own contributions. It is important to note that calculations on 2D materials may require different approaches and computational details, so the interested reader is referred to our recent tutorial reviews of the topic.Reference Kuc and Heine1,Reference Heine36
Theoretical modeling offers fast screening of many 2D crystals. We have compiled the structural and electronic properties of a large selection of 2D crystals, thus providing a database of bandgaps, effective electron and hole masses, lattice parameters, and band structures for further investigation by experiment and theory.Reference Miro, Audiffred and Heine37 Materials with spectacular properties invite further investigation; for example, in the case of PdS2, a Group 10 TMDC with 1T symmetry is semiconducting as a ML, but becomes semimetallic as a bilayer (BL).Reference Miro, Ghorbani-Asl and Heine38
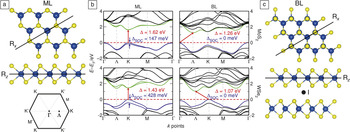
When Group 6 semiconducting –MX2 materials with the 2H (trigonal prismatic) structure type (Figure 1b) are confined from the bulk to the ML, their crystal symmetry lowers, and their electronic structure changes significantly. An important example of this quantum confinement is the observed enhanced photoluminescence signal from a MoS2 ML, which has been rationalized by band structure calculations.Reference Splendiani, Sun, Zhang, Li, Kim, Chim, Galli and Wang19,Reference Mak, Lee, Hone, Shan and Heinz20 MoS2, when thinned down to a ML, undergoes an indirect to direct bandgap transition, as illustrated in Figure 2. We have shown that this phenomenon is not restricted to MoS2 but is also present in other Group 6 MX2 materials.Reference Kuc, Zibouche and Heine21
(a) Structure of 2H MX2 monolayers (MLs) with high-symmetry reflection planes Rx and Rz, and the Brillouin zone with its high-symmetry k points. (c) The same information for the bilayer (BL) system, with the inversion point I indicated. (b) Band structure of MoS2 (top) and WSe2 (bottom) for ML (a) and BL (c). The Fermi level (E F) is indicated by a red dashed line. The valence band (blue) and conduction band (green) frontier orbitals are marked. The red arrow shows the lowest energy electronic excitation, indicating a direct bandgap for the MLs, but an indirect one for the BLs. Bandgaps (Δ) and spin–orbit splitting (ΔSOC) are indicated. Adapted with permission from Reference 40.

Figure 2 also shows the importance of relativistic effects. Schwingenschlögl et al.Reference Zhu, Cheng and Schwingenschlögl39 predicted giant spin–orbit (SO) splitting for MoS2 ML on the basis of density functional theory calculations. This strong quantum effect alters the electronic levels of the material, depending on their spin signature, due to the interaction of the intrinsic electron spin with its angular orbital momentum. This effect is also general for all 2H Group 6 MX2 materials, with values reaching 480 meV for WTe2.Reference Zibouche, Kuc, Musfeldt and Heine40
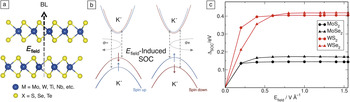
It is intriguing to compare the electronic property changes of MX2 MLs and BLs. While MLs show giant SO splittings, these are absent in the bulk and BLs, which is explained by the presence of an inversion center, resulting in the presence of two degenerate orbitals of opposite spin for any point in the band structure. Thus, it is possible to exploit the symmetry for tuning the SO splitting, offering interesting materials for spintronic applications. Any symmetry breaking will introduce SO splitting in the BL. One way to do this is by an external electric field normal to the basal plane, for example, provided by a gate voltage, as shown in Figure 3. This introduces a Stark effect––the applied electric field quasi-linearly splits the bands––and the SO splitting converges quickly to about the same values as found for the respective MLs.Reference Zibouche, Philipsen, Kuc and Heine41 After a field strength of ∼5 V/nm, a value that can be reached experimentally, the SO splitting is saturated. However, MX2 MLs are insensitive to the presence of even strong gate voltages.Reference Zibouche, Philipsen, Heine and Kuc42
(a) The electric field (E field) normal to the lattice plane is indicated. (b) The electric field breaks the degeneracy of the opposite spin orbitals at different valleys K and K′, thus introducing a spin–orbit (SO) splitting. σ– (σ+) denotes left (right)-handed circularly polarized light that couples to the band-edge transitions at K (K′) point. (c) SO splitting (ΔSOC) in MX2 bilayers (BLs) as a function of an external electric field normal to the lattice plane. Electric field already induces SO splitting in the MX2 BLs for weak fields and quickly saturates to values typically observed in their respective monolayers.Reference Zibouche, Philipsen, Kuc and Heine41 Note: SOC, spin–orbit coupling.

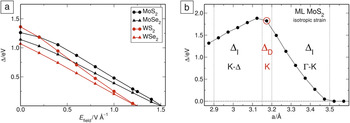
External fields have another important effect on the electronic structure of MX2 materials and can be used to tune the bandgap. Again, MLs are almost unaffected by external electric fields, with bandgap and effective electron and hole masses remaining stable.Reference Zibouche, Philipsen, Heine and Kuc42 Only at very high fields of about 50 V/nm do the bandgaps get smaller and eventually vanish, but at such a high field strength in the laboratory, MLs would not remain intact. BLs show a quasi-linear decrease in the bandgap in the presence of an external field (Figure 4).
(a) Bandgap change (Δ) of Group 6 2H MX2 materials as a function of a perpendicular electric field (E field).Reference Zibouche, Philipsen, Kuc and Heine41 Semiconductor–metal transition is achieved for a field strength of at least 1.2 V Å–1. (b) Bandgap change as a function of lattice parameter a.Reference Ghorbani-Asl, Borini, Kuc and Heine44 The equilibrium value is marked with a red circle. The range of direct bandgap transition is marked with dotted vertical lines and labeled ΔD. Outside this small region around the equilibrium distance, the bandgap is indirect (ΔI). The bandgap reduces almost linearly for compression (to the left) and expansion (to the right), where a semiconductor–metal transformation is reached at ∼10% strain. The figure also includes the reciprocal lattice points at which the smallest energy transition from valence to conduction band is possible.

Mechanical deformation is another way to change the electronic structure in MX2 materials. Group 6 2H MX2 materials readily form nanotubes and nano-onions, which have been investigated for their tribological properties. WS2 nanotubes resist strain for elongations of 10% and more, thereby showing a linear strain–stress relation up to rupture.Reference Kaplan-Ashiri, Cohen, Gartsman, Ivanovskaya, Heine, Seifert, Wiesel, Wagner and Tenne43 In the 2D crystal, deformation is accompanied by strong electronic effects (straintronics). Under isotropic and unidirectional strain, the bandgap is almost linearly lowered until a semiconductor–metal transition is observed at about 10% isotropic strain (Figure 4).Reference Ghorbani-Asl, Borini, Kuc and Heine44 Note that strained MoS2 ML, as well as related Group 6 MX2 MLs, are no longer direct bandgap semiconductors.
The metallic state has been confirmed by explicit calculations of the quantum conductance, indicating that transport channels are opened. Unidirectional strain gives similar results but with a smaller magnitude. Also, unidirectional strain can be employed to introduce anisotropy to the electronic properties.Reference Ghorbani-Asl, Zibouche, Wahiduzzaman, Oliveira, Kuc and Heine45 However, it is difficult to introduce strain experimentally. One way is to employ an atomic force microscope (AFM) tip; computer simulations of an indentation experiment showed that the electronic structure of MoS2 remains remarkably stable up to the point of piercing by the tip.Reference Lorenz, Ghorbani-Asl, Joswig, Heine and Seifert46 Another method is bending, or thermal expansion, which could be carried out on a substrate with a strong thermal expansion coefficient. However, due to the low friction coefficient of Group 6 MX2, only a small amount of isotropic strain or compression can be introduced into a MoS2 ML.Reference Plechinger, Castellanos-Gomez, Buscema, van der Zant, Steele, Kuc, Heine, Schüller and Korn47 Nevertheless, the first experiments with strain up to 2% confirm that the bandgap of MoS2 ML can be tuned by strain with an accompanying bandgap decrease of ∼70 meV per % strain.Reference He, Poole, Mak and Shan48,Reference Conley, Wang, Ziegler, Haglund, Pantelides and Bolotin49
The electronic properties of MX2 materials are strongly affected by defects that often form due to the synthesis procedure. For instance, point defects lead to new photoemission peaks and enhanced photoluminescence intensity in MoS2 MLs.Reference Tongay, Suh, Ataca, Fan, Luce, Kang, Liu, Ko, Raghunathanan, Zhou, Ogletree, Li, Grossman and Wu50 These effects can be attributed to the trapping potential of free charge carriers and to localized excitons. Simulations of the electronic structure of defective MoS2 ML show that defects introduce mid-gap states that act as scattering centers.Reference Ghorbani-Asl, Enyashin, Kuc, Seifert and Heine51 Our non-equilibrium Green’s function transport simulations, where the current due to a potential drop between two leads in the presence of a bias voltage is calculated, show that single atomic vacancies can significantly reduce the average conductance and lead to significant anisotropy of electron transfer in MLs with grain boundaries. These results indicate that defects are important limiting factors in electronic transport,Reference Qiu, Xu, Wang, Ren, Nan, Ni, Chen, Yuan, Miao, Song, Long, Shi, Sun, Wang and Wang52 thus explaining a large variation of conductivity in different samples.
Similar to freestanding graphene, MX2 MLs are not completely flat, which was shown from the microscopic structure of thin MoS2 layers using high-resolution transmission electron microscopy and atomic force microscopy.Reference Brivio, Alexander and Kis53 MoS2 MLs form ripples, which may reach heights of 6–10 Å for a lateral flake length of 6–10 nm. This was supported by Born–Oppenheimer molecular dynamics simulations. Here, forces on the atoms are calculated from first principles, while the dynamics of the atoms is calculated using classical theory. These simulations confirmed that the inherent dynamics of MoS2 MLs lead to spontaneous ripple formation even at temperatures as low as 77K.Reference Miro, Ghorbani-Asl and Heine54 The ripples converged to the heights observed experimentally for supercells with lateral lengths of about 9 nm.
Field-effect devices
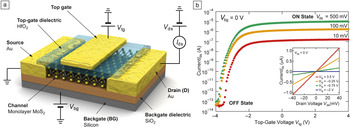
One of the most direct ways of accessing the electrical properties of a material is to incorporate it in an electronic device, for example in a FET (see Figure 5). In this multi-terminal device, current is injected by applying a voltage between source and drain electrodes, while the charge density can be modulated and the Fermi level varied using the gate electrode. FETs are not just convenient devices for probing the electrical properties of materials, but they are also the main building blocks of modern electronics, so demonstrating that a well-behaved FET can be made using a new semiconducting material is an important step in highlighting their technological relevance.
(a) Schematic representation of the first top-gated field-effect transistor with a 2D transition-metal dichalcogenide (MoS2) channel. (b) Device current as a function of gate voltage. The transistor could be completely turned OFF for gate voltages <–2 V, and it showed an ON/OFF current ratio of 108. Inset: current as a function of bias voltage, showing linear I ds–V ds curves for small bias voltages.Reference Radisavljevic, Radenovic, Brivio, Giacometti and Kis7

Radisavljevic et al. reported the first FET based on a 2D TMDC material in 2011.Reference Radisavljevic, Radenovic, Brivio, Giacometti and Kis7 It included a HfO2 top-gate dielectric and showed a current ON/OFF ratio exceeding 108 at room temperature and OFF-state currents smaller than 25 fA/µm. For comparison, an ON/OFF ratio of 106 and an OFF-state current on the order of 1 nA/µm is considered acceptable for digitial electronic circuits. This showed for the first time that electronic devices with interesting performance levels could be realized based on 2D materials other than graphene. It resulted in the inclusion of MoS2 and semiconducting TMDCs in the International Technology Roadmap for Semiconductors55 in 2011.
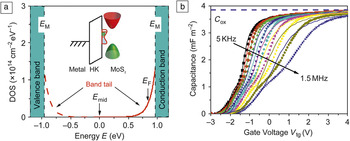
The encapsulation of MoS2 using insulating HfO2 was crucial in achieving high performance levels in early devices. Subsequent temperature-dependent measurements of electrical transport in various geometriesReference Radisavljevic and Kis56 showed that encapsulation in HfO2 can effectively increase the mobility of MoS2 through a combination of homopolar phonon mode quenchingReference Kaasbjerg, Thygesen and Jacobsen57,Reference Kaasbjerg, Thygesen and Jauho58 as well as charged impurity screening by the dielectric and the top gate.Reference Ong and Fischetti59 A complementary approach to achieving high mobility involves vacuum annealing, resulting in the removal of adsorbates,Reference Jariwala, Sangwan, Late, Johns, Dravid, Marks, Lauhon and Hersam60,Reference Baugher, Churchill, Yang and Jarillo-Herrero61 lower noise,Reference Xie, Sarkar, Liu, Kang, Marinov, Deen and Banerjee62 and low-temperature mobilities in ML MoS2 of ∼250 cm2/Vs extracted from Hall effect measurements and field-effect effective mobilities of ∼1000 cm2/Vs.Reference Baugher, Churchill, Yang and Jarillo-Herrero61 These values could be significantly underestimated and lower than the intrinsic limitReference Kaasbjerg, Thygesen and Jacobsen57 due to the presence of electronic trap statesReference Zhu, Low, Lee, Wang, Farmer, Kong, Xia and Avouris63 and the formation of a band tail, as seen in Figure 6a. The smearing of the band edge due to various types of inhomogeneities could include sulfur vacancies, charges trapped at the TMDC/dielectric interface, or other structural defects. The extent of the band tail in MoS2 was characterized by Zhu et al., who found a ∼100 meV characteristic energy width of the band tail using frequency-dependent capacitance–voltage measurementsReference Zhu, Low, Lee, Wang, Farmer, Kong, Xia and Avouris63 (Figure 6b).
(a) Density of states (DOS) for MoS2, including both localized band-tail and mid-gap localized states. E mid is the energy level in the middle of the bandgap and E M is the energy of the mobility edge. Inset shows a simplified band diagram of the device. (b) Multi-frequency capacitance of a MoS2 test structure as a function of gate voltage (V tg). C ox is the oxide capacitance. The symbols are experimental results, and the lines indicate modeling results.Reference Zhu, Low, Lee, Wang, Farmer, Kong, Xia and Avouris63 Data and the model show reasonable agreement. Adapted with permission from Reference 63. © 2014 Nature Publishing Group. Note: HK, high-κ (dielectric constant) dielectric; E F, Fermi energy.

While further increases in the mobility of MoS2 are to be expected, it is already large enough to allow operation of MoS2-based transistors in the GHz range, where current, voltage, and power gains were demonstrated.Reference Krasnozhon, Lembke, Nyffeler, Leblebici and Kis64 These performance figures are mostly limited by the contact resistance.
Reducing the contact resistance due to the Schottky barrier between the 2D semiconductor and the metal and realizing an ohmic contact is one of the most important challenges for engineering a high-quality device. This is, for example, crucial in achieving highly responsive photodetectors.Reference Lopez-Sanchez, Lembke, Kayci, Radenovic and Kis65 One way to achieve this is by using low work-function metals as contacts, such as Ni66 or Sc.Reference Popov, Seifert and Tománek67,Reference Das, Chen, Penumatcha and Appenzeller68 In addition to choosing the metal with an advantageous work function, other factors such as the orbital overlap between the metals and TMDCs and the contact geometry (top versus edge contacts) also play important roles, as shown by Kang et al. first in their theoretical studyReference Kang, Liu, Sarkar, Jena and Banerjee69 and later in the experimental demonstration of low-resistance Mo contacts to MoS2.Reference Kang, Liu and Banerjee70
A complementary approach is to reduce the Schottky barrier height by doping the semiconducting region under the contact (e.g., by p-doping WSe2 devices to NO2Reference Fang, Chuang, Chang, Takei, Takahashi and Javey31 in order to improve Pd contacts, n-type doping using the chemical compound benzyl viologen to improve Ni contacts to MoS2,Reference Kiriya, Tosun, Zhao, Kang and Javey71 or chlorine doping in the case of Ni on WS2 and MoS2).Reference Yang, Majumdar, Liu, Du, Wu, Hatzistergos, Hung, Tieckelmann, Tsai, Hobbs and Ye72 The biggest reduction in contact resistance reported so far was by using the radical approach of converting MoS2 in the contact region from the semiconducting 2H to the metallic 1T phase by locally increasing the charge doping level using lithiation,Reference Kappera, Voiry, Yalcin, Branch, Gupta, Mohite and Chhowalla73 resulting in a contact resistance of less than 300 Ω·µm. Previous typical contact resistance values were above 1 kΩ·µm. Not only can MoS2 be semiconducting or metallic, but at sufficiently high doping levels, it can also become superconducting, with a gate tunable transition temperature showing a maximum at 11 K.Reference Ye, Zhang, Akashi, Bahramy, Arita and Iwasa74
Because 2D TMDCs are direct bandgap semiconductors, FETs based on these materials can also be used as simple and efficient photodetectors. Early phototransistors based on MoS2 had a photoresponsivity of 7.5 mA/W.Reference Yin, Li, Li, Jiang, Shi, Sun, Lu, Zhang, Chen and Zhang75 Using layers with different thicknesses, the responsivity of the photodetector can be tuned to different wavelength ranges.Reference Lee, Min, Chang, Park, Nam, Kim, Kim, Ryu and Im76 Lopez-Sanchez et al.Reference Lopez-Sanchez, Lembke, Kayci, Radenovic and Kis65 reported ML MoS2 phototransistors with a high photoresponsivity of 880 A/W.
Experimental work on other semiconducting TMDCs has also started. While MoS2 is usually n-type, p-type FET devices based on WSe2 have been realized showing a room-temperature hole mobility of 250 cm2/Vs31 as well as n-WSe2 transistors with a room-temperature mobility of 142 cm2/Vs.Reference Liu, Kang, Sarkar, Khatami, Jena and Banerjee32 Using liquid gating, in which an ionic liquid is used in place of a solid dielectric, it was possible to achieve ambipolar operation in ML WSe2Reference Allain and Kis77 as well as in WS2.Reference Jo, Ubrig, Berger, Kuzmenko and Morpurgo78
While most of the work in 2D TMDC-based transistors has focused on using a 2D material as the semiconducting channel, the wide range of electrical properties represented by 2D materials, from insulating such as boron nitride (BN) to superconducting, implies that, in principle, all parts of an FET structure can be replaced by 2D materials. The lack of dangling bonds in 2D materials also weakens the usual constraints of lattice matching that limit the possible combinations for “classical” three-dimensional materials. This allows for the realization of a host of new types of devices, such as vertical FETs with several BN12 or TMDC layersReference Georgiou, Jalil, Belle, Britnell, Gorbachev, Morozov, Kim, Gholinia, Haigh, Makarovsky, Eaves, Ponomarenko, Geim, Novoselov and Mishchenko79 sandwiched between graphene electrodes.
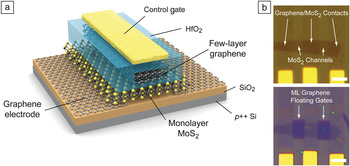
Being a good conductor, graphene can be used as an electrical contact for lateral electrical transport through MoS2 and other 2D semiconductors. Bertolazzi et al.Reference Bertolazzi, Krasnozhon and Kis80 demonstrated flash memory cells based on ML MoS2 contacted by low-resistance ohmic-like graphene contacts (see Figure 7). By using BN as the gate insulator, the entire FET structure could be implemented using 2D materials as the contact, semiconducting channel, and gate insulator.Reference Roy, Tosun, Kang, Sachid, Desai, Hettick, Hu and Javey81
(a) MoS2/graphene heterostructure memory based on a MoS2 transistor with graphene contacts. (b) Optical image of MoS2 contacted by graphene (upper panel) and multilayer graphene floating gates deposited on top of the semiconducting channel (lower panel).Reference Bertolazzi, Krasnozhon and Kis80 Note: ML, monolayer.

Electronic circuits
Electronic circuits based on 2D TMDC semiconductors have already been demonstrated. Radisavljevic et al.Reference Radisavljevic, Whitwick and Kis82 realized the first such circuit, which consisted of two transistors on the same piece of ML MoS2 and operating as an inverter. The gain of the inverter was higher than 4, indicating that such logic gates could be integrated into more complicated circuits without attenuation of voltage levels. The same device can also be operated as an analogue amplifierReference Radisavljevic, Whitwick and Kis83 for small signals. Logic circuits based on BL MoS2Reference Wang, Yu, Lee, Shi, Hsu, Chin, Li, Dubey, Kong and Palacios84 and complementary inverters based on WSe2Reference Tosun, Chuang, Fang, Sachid, Hettick, Lin, Zeng and Javey85 were also demonstrated, as were ring oscillators and random access memory circuits.Reference Wang, Yu, Lee, Shi, Hsu, Chin, Li, Dubey, Kong and Palacios84 Bertolazzi et al.Reference Bertolazzi, Krasnozhon and Kis80 demonstrated flash memory cells, with operating principles similar to the ones used in consumer electronic devices such as cell phones and cameras, in a heterostructure geometry. Such devices could offer reduced crosstalk between neighboring memory cells and could be scaled to smaller sizes due to the high sensitivity of the ML MoS2 semiconducting channel to the charge stored on the multilayer graphene floating gate.
Flexible devices
In addition to its interesting electronic applications, TMDC semiconductors have favorable mechanical properties. The first mechanical measurements of the stiffness and breaking strength of single and BL MoS2 were carried out by suspending MoS2 membranes on perforated substrates and deforming them using an AFM tip.Reference Bertolazzi, Brivio and Kis86 These experiments showed that MoS2 has a Young’s modulus of ∼270 GPa, higher than that of steel (∼205 GPa). The breaking strength of single and BL MoS2 was between 6% and 11% of their respective Young’s modulus, which represents the upper theoretical limit of a material’s breaking strengthReference Griffith87 and reflects the intrinsic properties of its interatomic bonds. This makes ML MoS2 the strongest semiconducting material and suggests that MoS2 is suitable for integration with flexible plastic substrates, such as polyimide, whose maximum strain before failure is ∼7%. Similar mechanical properties are expected in all TMDC materials because of the similar nature of interatomic bonds in these materials. Therefore, MoS2 is an interesting material for flexible electronics and nanoelectromechanical systems. Castellanos-Gomez et al.Reference Castellanos-Gomez, van Leeuwen, Buscema, van der Zant, Steele and Venstra88 realized the first devices of this kind when they demonstrated nanomechanical resonators based on ML MoS2 membranes with resonant frequencies of up to 30 MHz. A number of flexible FETs based on MoS2 have been realized using liquid gels,Reference Pu, Yomogida, Liu, Li, Iwasa and Takenobu89 high-κ (where κ is the dielectric constant),Reference Chang, Yang, Lee, Tao, Hwang, Jena, Lu and Akinwande90 or BNReference Lee, Yu, Cui, Petrone, Lee, Choi, Lee, Lee, Yoo, Watanabe, Taniguchi, Nuckolls, Kim and Hone91 as dielectrics, and show robust electrical operation against mechanical deformation.
Summary
We have summarized the most recent work on MoS2 and other Group 6 TMDC materials, focusing on their electronic properties and their potential to enter the field of next-generation 2D electronics, including applications in low-power electronics (due to reduction of leakage currents and contact resistance), flexible electronics, optoelectronics, and straintronics. The enormous progress of the field, ranging from fundamental science up to device implementation, is reflected by the large number of scientists working in the field, even though the first transistor on a MoS2 ML was reported only recently. MoS2 and other TMDCs are being developed, in synergy with graphene and hexagonal boron nitride, as important material components for 2D electronics. The work has just begun, and a large number of TMDCs have not even been synthesized or studied.
Acknowledgments
This work was financially supported by the European Research Council (grants no. 240076 & no. 256962), Marie Curie ITN network “MoWSeS” (grant no. 317451), the Swiss National Science Foundation (grants no. 132102 and 138237), Swiss SNF Sinergia Grant no. 147607, and Deutsche Forschungsgemeinschaft (HE 3543/19–1).