I. INTRODUCTION
Metal microspheres are used for a variety of applications ranging from biomedical drug delivery systems to large surface area electrode material for energy storage devices. Their usefulness in these applications arises from their high surface to volume ratio and relative ease of fabrication. While it is known that submicrometer size materials display considerably enhanced mechanical strength compared to their bulk counterparts, a complete understanding of the operative plastic deformation mechanisms, particularly their strain rate dependence, is still largely incomplete but is absolutely necessary to realize the full potential of metal microspheres. Reference Greer, Oliver and Nix1–Reference Purkayastha and McMeeking6
A frequently observed characteristic of submicrometer size metal samples is that they display plastic deformation occurring by a stochastic process of discrete displacement jumps corresponding to the motion of single, or groups of, dislocations. Reference Greer and Nix7–Reference Schneider, Clark, Frick and Arzt10 While the resolved shear stress required to initiate plastic deformation in these small samples is very high, it is less than the ideal theoretical shear strength of the bulk crystal. Reference Shenoy, Phillips and Tadmor11–Reference Schuh, Mason and Lund13 This suggests that, dislocations are being nucleated at inhomogeneities within, or from the surface of, the sample. Reference Paul, Oliver, Miyahara and Grütter14 The high strength and interrupted nature of the ductility of these small samples is therefore likely to be related to the conditions for nucleation of dislocations from these sites rather than the conditions necessary for the motion of existing dislocations past obstacles within the sample. This is the basic tenant behind the dislocation starvation model for plastic deformation of submicrometer sized metal samples. Reference Greer and Nix7
To date, few studies of microspheres, Reference Mordehai, Lee, Backes, Srolovitz, Nix and Rabkin15–Reference Wang, Shan, Li, Sun and Ma18 nanodots, Reference Mook, Niederberger, Bechelany, Philippe and Michler9 nanoposts Reference Mook, Lund, Leighton and Gerberich19 and nanowires Reference Gall, Diao and Dunn20–Reference Deng and Sansoz22 exist that investigate the kinetics of this deformation process and most of the studies in this area have used a computational/numerical modeling approach. Experimental investigations in this area are still lacking. In this study we perform compression tests, at various loading rates, and finite element simulations to investigate the characteristics of the kinetics of dislocation nucleation/glide in single crystal Au spheres of 0.8–6.0 µm diameter.
II. MATERIALS AND METHODS
A. Sample preparation
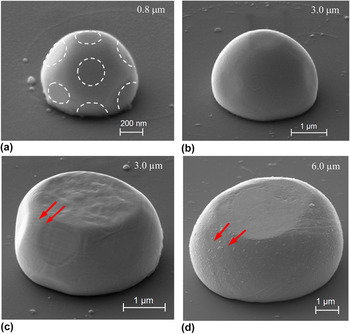
Gold microspheres were fabricated on a (0001) sapphire wafer by the following procedure. At least sixty circles, each of 1.5–12.0 µm diameter, were projected upon a photoresist-coated sapphire wafer using electron beam lithography. After the exposed photoresist was removed, a Au film of 99.9% purity and 100–600 nm thickness was deposited upon the pattern. The remaining photoresist was then removed and the resulting free-standing Au cylinders were annealed in-vacuum at 1000 °C. The annealing was accomplished by heating to 950 °C at a rate of 10 °C/s followed by heating to 1000 °C at 0.5 °C/s and then holding at 1000 °C for 90 s. During annealing the Au dewetted from the sapphire substrate and took the form of facetted spheres of 0.8–6.0 µm diameter (Fig. 1). Previous studies of similarly fabricated Au spheres indicated that these facets are {111} and {100} planes. Reference Mordehai, Lee, Backes, Srolovitz, Nix and Rabkin15–Reference Lee, Mordehai, Rabkin and Nix17 The surface energy of Au shows strong cusps at {111} and {100} orientations with the close-packed {111} facets having the lowest surface energy. Under equilibrium conditions the Au microspheres contain both {111} and {100} facets on their surface but at the microsphere/substrate interface there is a (111)Au/(0001)sapphire orientation relationship. Since the top facet, the one upon which the sphere will be compressed in this study, is parallel to this interface, it must also have a 〈111〉 normal axis and therefore must be a {111} plane. About 60 microspheres were fabricated for each sphere diameter of 0.8, 1.0, 3.0, and 6.0 µm.
SEM images of Au microspheres tested in this study. Images (a) and (b) are as-fabricated 0.8 and 3.0 µm diameter Au microspheres. {111} facets are marked by white dotted lines in Image (a). Compressed Au microspheres of 3.0 and 6.0 µm diameter are shown in (c) and (d). Dislocation slip traces corresponding to {111}〈110〉 slip systems are identified with red arrows.

The fabrication procedure described above provides two important advantages for this study: (i) It allows for the fabrication of many, in this case about 60, identical microspheres which allows us to study a phenomenon, initiation of plastic deformation, that displays considerable sample-to-sample variability, with sufficient number of specimens to reach statistically significant findings, and (ii) It also results in single crystal spheres that are free of crystal defects such as ion-induced defects associated with the more commonly used FIB milling process.
B. Microsphere compression
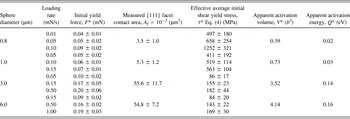
The Au microspheres were compressed with a 9 µm diameter diamond flat punch attached to a NanoTest nanoindentation platform (Micro Materials Ltd, Wrexham UK). About 60 compression tests were performed on samples from each sphere diameter. The compression tests were carried out by loading the spheres at a constant rate, between 0.01 and 1.00 mN/s, to a deflection of about 20% of the initial sphere diameter (Table I). Compressive force F versus sphere deflection h curves obtained at the various loading rates provide the data from which the sample-size dependence and the strain rate dependence of the plastic deformation behavior of the microspheres was assessed.
Summary of loading rates and corresponding parameters F*, A f, τ*, V*, and Q* of the Au microspheres tested.

C. Finite element simulation
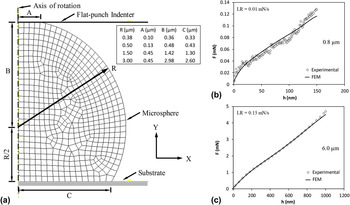
Finite element (FE) simulation was performed to assess the local stress and strain state within the deforming microspheres. An axisymmetric FE model was used for this analysis [Fig. 2(a)]. The dimensions of the model matched those directly measured from SEM images of the actual Au spheres. In the simulation, the flat punch and the sapphire substrate were assumed to be rigid and in frictionless contact with the Au sphere. Four-node linear axisymmetric quadrilateral elements were used in the model.
(a) The FE mesh used in this study. The dimensions of the different Au microspheres analyzed are shown in the inset. FE simulated F–h curves matched with experimentally obtained F–h curves for (b) 0.8 and (c) 6.0 µm diameter Au microspheres. The loading rate of the experimental test is shown as LR.

Compression of the sphere was simulated by imposing downward displacement of the nodes at the flat punch/sphere interface [Region A in Fig. 2(a)]. All simulations were done by defining multiple load steps. The Au was treated as an isotropic elastic/plastic material, E = 79 GPa and ν = 0.42. Incremental plastic deformation was treated by application of the Prandtl–Reuss flow equation with user-defined multilinear isotropic Von-Mises hardening. A separate multilinear Von-Mises equivalent stress–strain response was selected for each Au diameter such that the F–h response obtained from the simulation matched with the experimentally measured F–h curve [Figs. 2(b) and 2(c)]. Twelve Finite element models were created to simulate the deformation of four microsphere diameters (0.8, 1.0, 3.0, and 6.0 µm) compressed at three loading rates.
III. RESULTS
A. Compression tests
Figures 3(a) and 3(b) show the experimentally obtained F–h curves for Au microspheres compressed at various loading rates. The deformation force F necessary for a given deflection h shows a strong dependence upon loading rate for the small diameter spheres however the dependence is considerably reduced for the large diameter spheres.
Experimentally obtained compressive force F versus deflection h response for (a) 0.8 and (b) 6.0 μm diameter Au microspheres deformed at three loading rates. Average Von-Mises equivalent stress
 ${\bar \sigma _{{\rm{VM}}}}$
versus average equivalent plastic strain
 ${\bar \varepsilon _{{\rm{VM}}}}$
responses, averaged over the nodes along the central axis of rotation of the FE grid, for (c) 0.8 and (d) 6.0 µm diameter Au microspheres compressed at three average strain rates
 $\left( {\dot \varepsilon } \right)$
.

The F–h curves of the small (0.8 and 1.0 μm) diameter spheres displayed discrete load jumps. These jumps occurred less frequently in the larger (3.0 and 6.0 μm) diameter spheres. SEM images of the deformed 3.0 and 6.0 µm diameter spheres are shown in Fig. 1. Dislocation slip traces corresponding to {111}〈110〉 slip can be seen.
The apparent contact stress corresponding to the start of plastic yielding σy defined as the initial yield force F* divided by the area A f of the facet upon which the flat punch indenter contacted the sphere, was between 994 ± 360 and 2504 ± 642 MPa for the 0.8 µm diameter spheres and decreased to between 168 ± 40 and 338 ± 60 MPa for the 6.0 µm diameter spheres over the three loading rates tested.
B. Average equivalent stress–strain curves
The average FE calculated centerline equivalent stress–plastic strain, calculated as the average nodal Von-Mises stress
 ${\bar \sigma _{{\rm{VM}}}}$
and the average nodal plastic strain
 ${\bar \varepsilon _{{\rm{VM}}}}$
along the central axis of rotation of the model, is depicted in Figs. 3(c) and 3(d) for 0.8 and 6.0 µm diameter microspheres compressed at three average strain rates
 $\left( {\dot \varepsilon } \right)$
. In all cases
 ${\bar \sigma _{{\rm{VM}}}}$
increased, for a given
 ${\bar \varepsilon _{{\rm{VM}}}}$
, with increasing average strain rate. For example, in the case of the 0.8 μm diameter spheres
 ${\bar \sigma _{{\rm{VM}}}}$
corresponding to
 ${\bar \varepsilon _{{\rm{VM}}}} = 20\%$
increased from 275 to 425 MPa when
 $\dot \varepsilon$
is increased from 0.039 to 0.262 s−1 [Fig. 3(c)].
IV. ANALYSIS AND DISCUSSION
The data presented above illustrate the size-, strain-, and strain rate-dependence of both the bulk plastic deformation of Au microspheres and the initiation of plastic deformation. Here we analyze both features. We first assess the average FE computed centerline
 ${\bar \sigma _{{\rm{VM}}}}$
in terms of power-law functions of
 ${\bar \varepsilon _{{\rm{VM}}}}$
and the experimentally obtained average strain rate
 $\dot \varepsilon = {{\dot h} \mathord{\left/ {\vphantom {{\dot h} {\left( {0.75{D_{{\rm{sphere}}}}} \right)}}} \right. \kern-\nulldelimiterspace} {\left( {0.75{D_{{\rm{sphere}}}}} \right)}}$
to determine the effect of sphere diameter on the strain hardening and the strain rate sensitivity of
 ${\bar \sigma _{{\rm{VM}}}}$
. This provides insight on the operative dislocation–obstacle interactions within these spheres during bulk plastic deformation. We then assess the size- and strain rate-dependence of the initial plastic deformation event to determine the operative dislocation nucleation mechanism.
A. Strain hardening and strain rate sensitivity of Au microspheres
It is common when characterizing the isothermal plastic deformation of bulk metal samples to express the equivalent flow stress as a power–law function of the equivalent strain and strain rate. Here we apply this approach to assess the dependence of
 ${\bar \sigma _{{\rm{VM}}}}$
upon
 ${\bar \varepsilon _{{\rm{VM}}}}$
and
 $\dot \varepsilon$
for the Au microspheres. Logarithmic plots of
 ${\bar \sigma _{{\rm{VM}}}}$
versus
 ${\bar \varepsilon _{{\rm{VM}}}}$
and
 $\dot \varepsilon$
yield slopes of magnitude n and m respectively. Figure 4(a) shows n plotted versus
 $\dot \varepsilon$
. The larger, 6.0 and 3.0 µm diameter, Au spheres displayed a strain hardening exponent of n = 0.40–0.50 and n showed clear strain-rate dependence. These values are similar in magnitude to those reported for bulk fcc metals such as Au.
Reference Kelly and Nicholson23
The smaller, 0.8 and 1.0 µm diameter, microspheres displayed lower strain hardening exponent of n = 0.27–0.33 and n was significantly less dependent upon strain-rate. Figure 4(b) shows the strain rate exponent m plotted against
 $\dot \varepsilon$
. The 6.0 µm diameter spheres displayed decreasing m, from m = 0.08 to 0.03, as
 ${\bar \varepsilon _{{\rm{VM}}}}$
increased from 0.05 to 0.20. A strain rate exponent of m = 0.03 is typical of bulk fcc metals.
Reference Dao, Lu, Shen and Suresh24
The smaller 0.8 and 1.0 µm diameter spheres displayed significantly higher m values ranging between m = 0.2 to 0.3 over the same strain range. Our observation that m is significantly increased when the diameter of the Au spheres is less than about 1 μm is similar to what was reported from uniaxial strain rate change tests performed on nanocrystalline Ni
Reference Wang, Hamza and Ma25
and uniaxial compression tests performed on Cu nanopillars.
Reference Jennings, Li and Greer26
(a) Strain hardening exponent n, (b) Strain rate sensitivity m, and (c) Apparent activation volume V* plotted as a function of average centerline Von-Mises equivalent plastic strain
 ${\bar \varepsilon _{{\rm{VM}}}}$
, for all diameters of Au microspheres tested in this study.

The sample size dependence of the strain- and strain rate-sensitivity of the flow stress of Au microspheres described above point to a clear sample size dependence in the operative dislocation nucleation/glide mechanism. The deformation of small free-standing ductile metal volumes, such as our 0.8 µm diameter Au spheres, will likely be affected by the process of dislocation nucleation at the free surface and glide of these dislocations through the small sample with little chance of interaction with other dislocations. Atomistic simulations have predicted that dislocation nucleation from free surfaces has a very low associated characteristic activation volume of V* = 1–10b 3. Reference Zhu, Li, Samanta, Leach and Gall27 This will result in a very low strain rate sensitivity since the parameters V* and m are related as Reference Wang, Hamza and Ma28–Reference Zhu, Li, Ogata and Yip30
 $${V^ * } = \sqrt 3 kT{\rm{/}}m\sigma \quad ,$$
where k is the Boltzmann constant and T is the absolute temperature.
Plastic deformation of the large, 3 or 6 μm diameter, Au spheres will likely involve more dislocation nucleation from inhomogenities within the interior of the sample and obstacle-limited glide of the dislocations through the sample. The characteristic activation volume for such a process is significantly higher, typically between V* = 100–1000b 3. Reference Rodriguez31
Substituting the values of m and
 ${\bar \sigma _{{\rm{VM}}}}$
from our study into Eq. (1) allows us to determine an apparent activation volume V* which is characteristic of the deformation process in the Au microspheres. Figure 4(c) indicates the calculated V* as a function of
 ${\bar \varepsilon _{{\rm{VM}}}}$
. In this figure V* is normalized with respect to b
3, where the Burgers vector of Au is taken as b = 0.289 nm.
Reference Nix and Lee32,Reference Bhakhri and Klassen33
For the smaller, 0.8 and 1.0 µm diameter, spheres V* remains at 4–6b
3 and is independent of strain while for the larger, 3.0 and 6.0 µm, diameter spheres V* increased from 12 to 42b
3 with increasing strain. The low V* values, 4–6b
3, for the smaller diameter spheres is similar to previously reported estimates for fcc metals by Mook and Gerberich,
Reference Mook, Lund, Leighton and Gerberich19
and is characteristic of dislocation surface nucleation events. These findings are also consistent with frequent discrete load jumps that were observed in the F–h curves of the 0.8 and 1.0 µm diameter spheres [Fig. 3(a)]. The larger, 3.0 and 6.0 µm diameter, spheres displayed smoother F–h curves [Fig. 3(b)] and displayed larger values of V* and its tendency to increase with increasing strain is typical of the operation of a dislocation–obstacle interaction limited deformation mechanism which is common in bulk ductile metals.
Reference Kocks, Argon and Ashby34
B. Initiation of plastic deformation
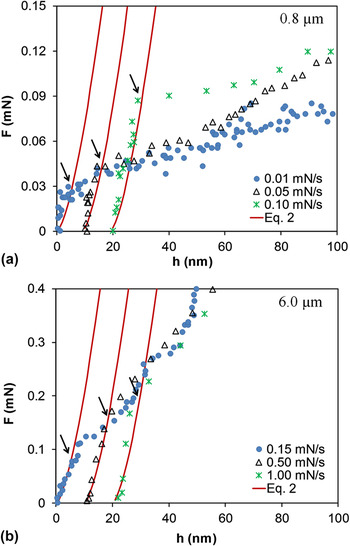
The sample size- and strain rate-dependence of the initiation of plastic deformation within the Au microspheres was studied to provide a more detailed assessment of the operative rate-dependent dislocation nucleation process. The initial yield force F* at which the measured F–h response deviated from the ideal elastic response was recorded for microspheres of diameter from 0.8 to 6.0 μm that were compressed at several loading rates (Fig. 5 and Table I). The ideal elastic F–h response was expressed by the following Hertz equation describing the elastic contact of two spheres, one of radius R and the other of infinite radius Reference Kogut and Etsion35
 $$F = {4 \over 3}{E_{\rm{r}}}{R^{1{\rm{/}}2}}{h^{3{\rm{/}}2}}\quad ,$$
where the reduced elastic modulus E r is given as
 $${1 \over {{E_{\rm{r}}}}} = {{1 - \nu _1^2} \over {{E_1}}} + {{1 - \nu _2^2} \over {{E_2}}}\quad .$$
Representative F–h curves of the Au microspheres compressed at three loading rates, (a) 0.8 and (b) 6.0 µm diameter Au microspheres. For each test the initial portion of the F–h curve is well matched by the F–h elastic response predicted by Eq. (2) (red lines). The load corresponding to the first deviation from the F–h elastic response indicates F* and is indicated by the black arrows. For the sake of clarity, the displacement data for each loading rate is offset by 10 nm.

Our calculations used isotropic elastic properties of E 1 = 79 GPa and ν1 = 0.42 for the Au microsphere and E 2 = 1141 GPa and ν2 = 0.07 Reference Maharaj and Bhushan36 for the diamond flat-punch.
The average initial yield equivalent shear stress τ* was then calculated as
 $${\tau ^ * } = 0.5{{{F^ * }} \over {{A_{\rm{f}}}}}\quad ,$$
where A f is the area of the {111} facet upon which the flat-punch contacted the Au sphere and the factor 0.5 represents the characteristic Schmid factor of a ductile fcc metal. Reference Gall, Diao and Dunn20,Reference Heyer, Brinckmann, Pfetzing-Micklich and Eggeler37 Values of F*, A f, and τ* are given in Table I. It should be noted that finite element elastic simulation indicates that the use of the Hertz equation to determine F* results in an uncertainty of about 10% due to the geometrical differences between the ideal flat surface/sphere point contact of the Hertz model and the flat surface/facetted-sphere contact of the microspheres of this study. This uncertainty is well within the sample-to-sample variability displayed by the data in Table I.
The average equivalent shear strain rate at the point of initial yielding was obtained from Eq. (2) as
 $${\dot \gamma ^ * } = {1 \over {\sqrt 3 }}\left( {{{{\rm{d}}\varepsilon } \over {{\rm{d}}t}}} \right) = {1 \over {\sqrt 3 }}\left( {{{\dot h} \over {0.75{D_{{\rm{sphere}}}}}}} \right) = {{0.12\dot F} \over {{{\left( {E_{\rm{r}}^2{R^4}{F^ * }} \right)}^{1/3}}}}\quad ,$$
where
 $\dot F = {\rm{d}}F{\rm{/d}}t$
is evaluated at F*.
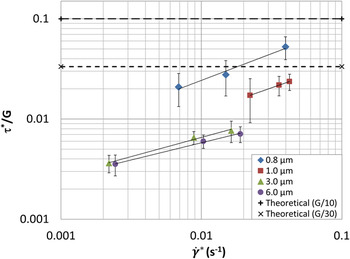
Plots of τ*/G versus
 ${\dot \gamma ^ * }$
(Fig. 6) indicate that the shear stress required to initiate initial plastic deformation increases with increasing strain rate and decreasing sphere diameter. In these plots the elastic shear modulus of G
Au = 23.6 GPa was used.
Reference Kamimura, Edagawa and Takeuchi38
Included on the graph is the estimated theoretical shear strength which is normally estimated to be between G/30 and G/10 for fcc metals such as Au.
Reference Hull and Bacon39–Reference Bei, Shim, Pharr and George41
It is notable that τ*/G of the smaller, 0.8 and 1.0 µm diameter, spheres approaches the estimated theoretical strength limit for Au.
Normalized initiation of plastic deformation shear stress τ*/G versus strain rate of Au microspheres. Included in the plot are dashed lines indicating common estimates of the ideal theoretical shear strength (τideal = G/30 to G/10) of a metal.

The strain-rate dependence of τ* suggests that the deformation mechanism controlling these events involves a time-dependent process. Previous molecular dynamic simulation of deforming Au micro-particles demonstrated that first dislocation nucleation events occur at periphery of the contact region between the facetted sphere and the compression platen. Reference Mordehai, Lee, Backes, Srolovitz, Nix and Rabkin15 A plausible theory to explain the observed size dependence of τ* is that the platen/sphere contact area increases with increasing sphere diameter and thus the number of interfacial vacancies increases and the rate of diffusion of these vacancies controls the observed strain rate sensitivity of τ*. This theory is supported by the findings of Salehinia et al. Reference Salehinia, Perez and Bahr42 which demonstrate that the presence of vacancies beneath the indenter during nano-indentation of Ni strongly affects F*.
The hypothesis that the strain rate dependence of τ* is linked to vacancy diffusion enhanced dislocation nucleation from the platen/sphere contact area can be tested by calculating the apparent activation energy of the process and comparing its value to that characteristic of vacancy diffusion. Application of the Orowan equation allows us to describe the shear strain rate,
 $\dot \gamma$
, as a function of the mobile dislocation density ρm, Burgers vector b, and the average dislocation glide velocity
 $\bar v$
as
Reference Orowan43
;
 $$\dot \gamma = {\rho _{\rm{m}}}b\bar v\quad .$$
The dislocation velocity can be expressed in terms of a stress- and temperature-activated atomic jump frequency as Reference Bhakhri, Wang, Ur-rehman, Ciurea, Giuliani and Vandeperre44 :
 $$\bar v = {\nu _0}b\left[ {\exp \left( { - {{\left( {{\tau _{\rm{p}}} - \tau } \right){V^ * }} \over {kT}}} \right)} \right]\quad ,$$
where ν0 is a characteristic athermal atomic jump frequency, τp is the athermal lattice resistance to dislocation glide, τ is the applied shear stress, and the remaining terms are previously defined. Combining Eqs. (6) and (7) with the assumptions that τV* ≫ kT and the apparent activation volume V* can be treated as constant, the following expression for τ can be arrived at
 $$\tau = {\tau _{\rm{p}}} + {{kT} \over {{V^ * }}}\ln \dot \gamma - {{kT} \over {{V^ * }}}\ln \left[ {{\rho _{\rm{m}}}{b^2}{\nu _0}} \right]\quad .$$
This relationship forms the basis of conventional thermal-rate-dependent analyses of mechanical flow stress of materials.
Reference Bhakhri, Wang, Ur-rehman, Ciurea, Giuliani and Vandeperre44–Reference Pirouz, Demenet and Hong46
In this study we use this equation to assess the
 ${\tau ^ * } - {\dot \gamma ^ * }$
response shown in Fig. 6. The linear dependence of the data when plotted on a semilogarithmic plot indicates a constant activation volume associated with the dislocation nucleation process occurring at τ*. Assuming that τ* occurs by the nucleation of a dislocation in an essentially dislocation free microsphere, ρm will be very small and the third term on the right side of Eq. (8) is much less than the second term. In such a case, the slope of the
 ${\tau ^ * } - {\dot \gamma ^ * }$
plot represents kT/V*. This analysis method was used to determine the activation volume V* associated with the initial dislocation nucleation process (Table I and Fig. 7).
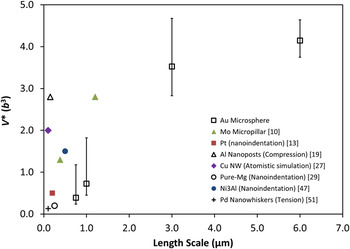
The change of apparent activation volume, V* during the initiation of plastic deformation of different diameter Au microspheres.

The dependence of V* upon microsphere diameter is shown in Fig. 7. The calculated V* of 0.8 and 1.0 µm diameter Au spheres is about 0.4b 3 and 0.7b 3 respectively. These V* values are similar in magnitude to those obtained from a host of small specimen tests on systems where heterogeneous dislocation nucleation events from pre-existing defects such as vacancy clusters, impurity atoms, or free surfaces control the deformation process. Reference Somekawa and Schuh29,Reference Wo, Zuo and Ngan47 The values of V* are, however, considerably smaller in magnitude than those calculated for the bulk deformation Au microspheres (described in the previous section).
The apparent activation energy of the initial dislocation nucleation process is expressed as Q* = τ0 K V*. We calculated the athermal stress, τ0 K of Au using room and high temperature nano-indentation hardness (<1 μm depth) measurement data obtained from literature. Reference Smith and Zheng48,Reference Vieregge49 We used our experimentally obtained V* values along with the calculated value for the athermal stress of Au, τ0 K = 256 MPa to calculate values of Q* (Table I). Our calculated Q* values increased from 0.02 to 0.16 eV with increasing microsphere diameter from 0.8 to 6.0 µm (Table I). The values of V* and Q* obtained from this study are of the same order of magnitude as those for atomic surface self-diffusion as reported by Liu et al. Reference Liu, Cohen, Adams and Voter50 and are also consistent with the findings from a recent study by Chen et al. Reference Chen, He, Shin, Richter and Gianola51,Reference Li52 on the kinetics of incipient plastic deformation in Pd whiskers.
V. CONCLUSIONS
In this study the dependence of the plastic deformation of Au microspheres upon sphere diameter and strain-rate at ambient temperature is investigated using micro-compression testing. Our study observed that the dependence of flow stress upon both strain and strain-rate was dependent upon the diameter of the Au microspheres. Analysis of the apparent activation volume, V* of the overall deformation process indicated that the operative deformation mechanism, for the small 0.8–1.0 µm diameter spheres was typical of a mechanism limited by the surface nucleation of dislocation, and for larger 3.0–6.0 µm diameter spheres was controlled by the dislocation–obstacle interaction limited mechanism, which is typical of bulk fcc metals.
The initial yield stress increased with increasing strain rate and with decreasing microsphere diameter. The size dependence of the initial yield stress was attributed to the presence of vacancies whose amount increased, as a result of increased flat-punch/sphere contact area, in the larger diameter microspheres. A thermal activation based model was used to interpret the loading-rate dependence of the measured initial yield stress. The apparent activation volume, V*, and activation energy, Q*, values were found to be 0.4b 3 and 0.02 eV for 0.8 µm diameter spheres and increased to 4.1b 3 and 0.16 eV for 6.0 µm diameter spheres. These estimated values indicate that the initiation of plastic deformation within these microspheres is controlled by heterogeneous dislocation nucleation events occurring at, or near, the flat-punch/sphere interface the rate of which is highly dependent upon the rate of surface self-diffusion of the Au atoms.
ACKNOWLEDGMENTS
Authors wish to acknowledge the assistance of the Nanofabrication laboratory of the University of Western Ontario for their assistance in fabricating the test samples used in this study and Dr. Vineet Bhakhri (Canadian Nuclear Laboratories, Chalk River, Ontario, Canada) for helpful discussions. The research presented in this paper was supported by funding from the Discovery Grant program of the Canadian Natural Science and Engineering Research Council (NSERC). AZM Islam gratefully acknowledges the financial support of the provincial government of Ontario through an Ontario Graduate Scholarship.