It’s no longer a question of staying healthy. It’s a question of finding a sickness you like.
–Jackie Mason
Introduction
Health-care spending can be expressed as the product of costs per case and the number of treated cases. In seeking to explain rising health-care spending, most of the economics literature has emphasized the former and, in an attempt to gauge the benefits of more intensive treatment, investigators have purposefully restricted attention to medical conditions (e.g. heart attack and low birth weight infants) where the number of treated cases has been relatively stable over time (Cutler et al., Reference Cutler, McClellan, Newhouse and Remler1998; Cutler and Meara, Reference Cutler and Meara2000). The literature has acknowledged the contribution of increases in the number of treated cases, or ‘treatment expansion’, in passing, but it has not been a focus.
There are important reasons to examine treatment expansion as a distinct phenomenon. Recent increases in treated disease prevalence have been large in magnitude and are responsible for a substantial share of increases in health-care spending (Thorpe et al., Reference Thorpe, Florence, Howard and Joski2005). While new technology may cause treated disease prevalence and costs per case to rise together, for some conditions treated disease prevalence has increased even though the underlying medical technology is basically unchanged.
In this paper, we examine the causes of recent increases in treated disease prevalence in the United States. A number of studies in the medical literature have considered increases in treated disease prevalence rates for specific diseases, but we are interested in identifying factors that underlie increases across diseases. We use an epidemiological model to identify the determinants of treated prevalence. We then document increases in treatment rates and present a series of analyses suggesting that increases in treated disease prevalence rates are driven partly by increases in obesity levels and partly by more aggressive detection and treatment of patients with mildly symptomatic and asymptomatic illness. We conclude by reviewing the following explanations for changes in detection and treatment patterns: new treatment technology, changes in diagnostic technology, pharmaceutical company marketing practices and ‘medicalization’.
A model of treated prevalence
A mechanistic, epidemiological model of treated prevalence is useful for identifying factors that may be responsible for changes in treated disease prevalence and generating empirical predictions. ‘Treated prevalence’ refers to the proportion of the population receiving treatment for a specific medical condition. (Hereafter, we use the term interchangeably with ‘treatment rate’.) It differs from the standard epidemiological concept of prevalence in two respects. First, it excludes persons who have the disease, but do not receive medical treatment. Second, it includes persons who do not have the disease, but are receiving treatment (perhaps in response to a false positive test result). Theoretically, treated prevalence could be higher or lower than the clinical prevalence of disease, though in most cases it will be lower.
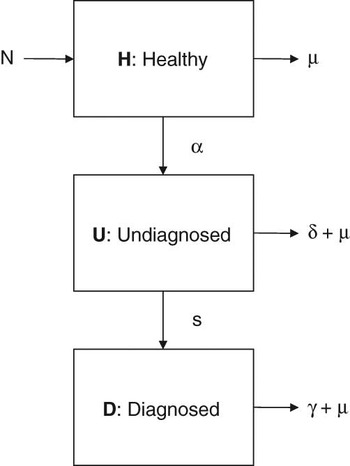
The model is depicted graphically in Figure 1. Each box represents a segment of the population, or a state and arrows represent transitions between groups.Footnote 1 There are three states. State H is the number of people in the healthy state. N persons are born into state H every period. People in state H transition to state U, representing undetected disease, at rate α. People in U transition to state D, representing detected disease, at rate s. The total population at time t is Ht + Ut + Dt. The parameter s is the sum of the screening rate and the rate at which persons with undetected disease develop symptoms. Parameter δ represents the mortality rate for persons with undetected disease, parameter γ represents the mortality rate for persons with detected disease and μ represents the mortality rate from a competing risk of death. For some conditions (e.g. hypertension), detection and treatment are associated with lower mortality rates, so γ < δ. For conditions where diagnosis is based primarily on symptoms, development of symptomatic disease is associated with higher mortality rates: γ > δ.
A model of treated prevalence

The model is described by three equations, one for each state:



.
These equations represent the period-to-period change in the population of each state. Steady state values are:

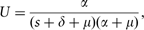

These were calculated by setting ΔH = ΔU = ΔD = 0 in equations (1a–1c) and solving for H, U and D.
The steady state values define treated prevalence as a function of the parameters:

This expression identifies the determinants of treated prevalence. In the Appendix, we show that treated prevalence will increase in response to an increase in the clinical incidence rate, α or the detection rate, s:

and treated prevalence will decline in response to an increase in any of the three mortality rates,

including the cause-specific rate, γ and competing risk of death, μ. When mortality rates decrease, survival time among persons with the disease increases, and the number of people with the disease increases relative to the overall population. We review evidence on the contribution of each factor to recent changes in treatment patterns below.
Trends in treated prevalence
We calculate trends in treated prevalence using the 1996–2004 Medical Expenditure Panel Surveys (MEPS) for respondents aged 18 years and older. MEPS, a household level survey, records information on the treatment patterns and health-care spending of the US civilian, non-institutionalized population. Medical care use is based on a combination of respondent self-report and provider surveys to verify encounters and identify the conditions that were addressed during each encounter. Following Thorpe et al. (Reference Thorpe, Florence, Howard and Joski2005), a respondent is counted as receiving treatment for a disease if she received inpatient, outpatient or physician office care or a prescription drug associated with the condition (a single health-care encounter may be associated with more than one condition). Annual sample sizes range between 15,745 and 27,574 respondents.
We focus on the 10 most costly diseases, as measured by total spending: heart disease, cancer, mental disorders, pulmonary conditions (which includes asthma and emphysema), diabetes, hypertension (i.e. high blood pressure), cerebrovascular disease (i.e. stroke), arthritis, pneumonia and kidney disease (Cohen and Krauss, Reference Cohen and Krauss2003).Footnote 2, Footnote 3 We chose to focus on the 10 most costly medical conditions because of their economic significance and high baseline prevalence (allowing for enough cases in a population-level database). It is worth noting, however, that treatment rates for many low-prevalence conditions are also increasing. Two examples are autism and Crohn’s disease.
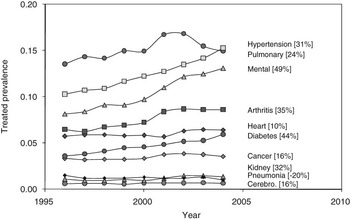
Figure 2 displays the treated prevalence of the 10 medical conditions for the years 1996–2004. Percentage increases are noted in brackets. These and all subsequent results using MEPS data are weighted using the MEPS sample weights. Furthermore, these estimates are adjusted to reflect the age and sex composition of the US civilian, non-institutionalized population in 2004 to net out the impact of demographic changes on treated prevalence. Results indicate that treatment rates have risen for all diseases except pneumonia. For example, treatment rates for hypertension are up 31% and treatment rates for mental illness are up 49%.
Treated prevalence among adults above 18 years, standardized by age and sex to 2002 (numbers in brackets represent percentage increases between 1996 and 2004; source: MEPS)

To confirm that increases in treated prevalence are not an artifact of changes in MEPS data collection methods, we examine trends in treated prevalence using Medicare claims data from 1991 to 2001. These data consist of claims for a random 5% sample of traditional Medicare beneficiaries residing in one of the nine cities and states that reported data to the Surveillance Epidemiology and End Results cancer tumor registry in 1991. The sample includes beneficiaries diagnosed with cancer as well as beneficiaries never diagnosed with cancer. We limit the analysis to beneficiaries aged 65 years and older. The annual sample sizes range between 109,104 and 116,369 beneficiaries. Conditions are identified using the diagnosis codes on outpatient, physician office and inpatient claims.Footnote 4 We do not have claims for beneficiaries in Medicare managed care plans. Managed care enrollment was 11% at the beginning of the period and increased to 16% by 2001.
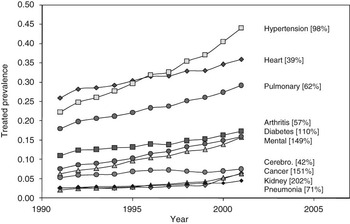
Results are displayed in Figure 3. Treated prevalence levels cannot be directly compared between MEPS and the Medicare data. The Medicare sample only includes persons aged 65 years and above and Medicare claims contain information only on those services reimbursed by Medicare. Despite these differences, the basic pattern of increases in treated prevalence is confirmed. If anything, the increases in treated prevalence in the Medicare data are larger than those documented in the MEPS data.
Treated prevalence among Medicare beneficiaries above 65 years, standardized by age and sex to 2002 (numbers in brackets represent percentage increases between 1996 and 2004; source: SEER Medicare)

Factors behind increases in treated prevalence
Below we present evidence on the contribution of three factors – increases in disease incidence (α), reductions in mortality rates (γ and μ) and changes in medical practice (s) – to increases in treated prevalence.
Changes in disease incidence
The underlying clinical incidence of disease does not change spontaneously. Rather, changes in risk factors drive changes in disease incidence. To evaluate the contribution of increases in incidence to increases in treated prevalence, we need to determine whether there have been corresponding increases in exposure to clinically significant risk factors.
Given that treated disease prevalence is increasing for many different types of conditions (e.g. cancer, diabetes, mental disorder), it is unlikely that simultaneous changes in idiosyncratic, condition-specific risk factors account for increases in treated prevalence. Instead, changes in treated prevalence rates may reflect some common, underlying health risk factor. Obesity seems like a good candidate. It is a risk factor for many different conditions (Must et al., Reference Must, Spadano, Coakley, Field, Colditz and Dietz1999; Field et al., Reference Field, Coakley, Must, Spadano, Laird, Dietz, Rimm and Colditz2001) and has risen steeply over the period covered by the study. According to MEPS, the proportion of the adult population that is obese has increased from 16% in 1997 to 25% in 2002. Other risk factors, such as smoking, alcohol abuse and exposure to air pollution do not share these characteristics. Either they have decreased in recent years or they are only linked to a few of the conditions described in Figure 1.
To gauge the impact of changes in obesity levels, as defined by body mass index (BMI), and other observable, individual characteristics on treated prevalence, we performed a decomposition analysis. The goal is to estimate the impact of changes in obesity on changes in treated disease prevalence at the population level. We estimated probit regressions for each condition where the dependent variable is equal to one if the respondent is receiving treatment for the condition and independent variables include age group (18–24, 25–34, 35–44, 45–54, 55–64, 65–74, 75–84, 85+), sex, race (Hispanic, black, other), census region, educational attainment (<12 years, high school graduate, some college, college graduate), and BMI group (<18.5, 18.5–24.9, 25–29.9, 30–34.9, >35). Persons with a BMI in excess of 30 are considered obese and persons with a BMI in excess of 35 are considered severely obese. For the sake of comparison, we also estimated a model where the independent variables include age and sex only. Both age and BMI are continuous variables. However, it is common in health applications to enter them as categorical variables in regressions to account for non-linearity.
We estimated the models on the 2002 MEPS sample and applied the Blinder–Oaxaca decomposition, modified for non-linear models (Fairlie, Reference Fairlie2005), to the 1997 MEPS samples to calculate the portion of the total change in treated prevalence that is explained by changes in observable characteristics. (We used the 1997 MEPS because all the respondents in the 1996 MEPS are included in the 1997 panel, and the 1997 sample has 8470 more observations.) The decomposition is based on the predicted values calculated by applying the coefficients (estimated on the 2002 sample) to the 1997 data. This counterfactual prediction provides an estimate of what treated prevalence levels would be today if the observable characteristics had not changed between 1997 and 2002. Subtracting these values from actual treated prevalence levels in 2004 and dividing by the total change provides an estimate of the proportion of the total change attributable to changes in the observable characteristics.
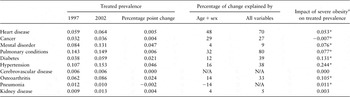
Results are displayed in Table 1.Footnote 5 Column 1 displays treated prevalence in 1997, column 2 displays treated prevalence in 2002 and column 3 displays the percentage point change in treated prevalence. The fourth column shows the proportion of the increases in treated prevalence explained by age and sex. The fifth column shows the proportion of the increases explained by all of the observable variables.
Impact of demographic changes and other factors on increases in treated prevalence

aBody mass index >35.
*p < 0.05.
Source: Medical Expenditure Panel Surveys.
The proportion of the increase in treated prevalence explained by age and sex ranges between 4% and 48%. The proportion explained by all variables, including indicators for whether respondents are overweight, obese or severely obese, ranges from 5% to 80%. For cancer, the proportion of the increase explained by age and sex exceeds the proportion explained by all observable variables. This implies that some factors that are negatively related to the likelihood of having the condition have increased between 1997 and 2002.
The last column shows the marginal effect of severe obesity (BMI >35) on the likelihood of receiving treatment for the condition. Being severely obese significantly increases the likelihood of receiving treatment for all conditions except cancer, cerebrovascular disease and kidney disease. Being obese (BMI 30–35) significantly increases the likelihood of receiving treatment for most of the conditions (results not shown). Being overweight does not significantly increase the likelihood of being treated for diabetes, hypertension and osteoarthritis (results not shown).
The conclusion we draw from Table 1 is that the ‘obesity epidemic’ is associated with a sizable share of increases in treated prevalence, especially for conditions clinically linked to obesity like diabetes. However, trends in obesity levels alone are not sufficient to explain increases in treated prevalence. These results must be interpreted cautiously because weight is self-reportedFootnote 6 and is measured at the time of the survey. For conditions like cancer, illness is associated with weight loss. For conditions like mental illness and pulmonary disease, illness is associated with weight gain. Another limitation is that we do not control for cigarette consumption, which is particularly important for explaining trends in pulmonary conditions.Footnote 7
Data from the National Health and Nutrition Examination Surveys (NHANES) yield additional evidence on the degree to which observed increases in treatment rates reflect changes in underlying clinical prevalence rates. These data are unique in terms of allowing us to identify both (1) the proportion of the population meeting the clinical criteria for a condition and (2) the proportion of the population receiving medical care for a condition. By examining trends in (1) and (2), we can determine how treated prevalence has changed in relation to clinical prevalence and incidence.
NHANES is conducted periodically by the Department of Health and Human Services and includes detailed medical and laboratory examinations of community-dwelling respondents. Following methods described in Gregg et al. (Reference Gregg, Cheng and Cadwell2005)Footnote 8, we used NHANES to calculate the proportion of respondents aged 20–74 years meeting the clinical criteria for three conditions for which both clinical disease markers and self-reported treatment rates are available: high cholesterol, hypertension and diabetes. We evaluate these conditions as ‘diseases’ in their own right, though the major reason for treating high cholesterol and hypertension is that they are risk factors for heart disease.
Assessment of disease biomarkers was based on laboratory examination of respondents’ blood samples (for cholesterol and diabetes) and blood pressure measurements (for hypertension). We used consistent criterion across years so that results are not affected by changes in the clinical thresholds used to define disease. We also calculated the proportion of subjects reporting use of medications for high cholesterol and high blood pressure and the proportion of subjects who have been told by a physician that they have diabetes. Again following Gregg et al. (Reference Gregg, Cheng and Cadwell2005), we calculated the ‘true’, clinical prevalence of disease by summing the proportions of respondents reporting treatment and respondents not reporting treatment, but who met the clinical thresholds for each condition. Note that we cannot define disease based on clinical thresholds alone because treatment may lower disease markers below clinical thresholds. In addition, some of the persons receiving treatment never had the disease in question, but it is impossible to identify them because we do not have pre-treatment markers of disease. All results are weighted to produce nationally representative estimates.
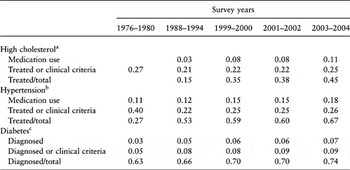
The results of the analysis are displayed in Table 2. These indicate that the prevalence of high cholesterol declined from 0.27 (or 27%) from 1976–1980 to 0.22 in 2000–2001, but increased to 0.25 in 2003–2004. There appears to have been a large decline in the prevalence of hypertension between 1976–1980 and 1988–1994, but there were changes in the protocol for measuring blood pressure between the surveys that may account for some or the difference (Burt et al., Reference Burt, Cutler, Higgins, Horan, Labarthe, Whelton, Brown and Roccella1995). Medication use to treat high cholesterol and hypertension has increased over time, and a higher fraction of those with the condition are receiving treatment.
Trends in the prevalence and treated prevalence of three conditions

aSerum cholesterol ⩾240 mg/dl.
bSystolic blood pressure ⩾140 mmHg or diastolic blood pressure ⩾90 mmHg.
cFasting glucose level ⩾126 mg/dl.
Source: National Health and Nutrition Examination Surveys.
For diabetes, both true prevalence and treated prevalence have increased. The data show, for example, that 5% of subjects met the clinical criteria for diabetes or reported having been diagnosed with diabetes in 1976–1980. By 1999–2000, the figure had risen to 9%. The proportion of diabetics who were diagnosed increased from 63% to 74%.
Taken together, the analyses using the MEPS and NHANES suggest that a combination of increases in disease incidence and changes in treatment patterns have contributed to recent increases in treated prevalence.
Changes in mortality rates
According to the model (see equation 5), treated prevalence will increase in response to a decrease in either the cause specific or competing risks of death. Intuitively, if the mortality rate for a disease declines, then persons with the disease will live longer and comprise a larger share of the population. The connection between the mortality rate for a competing risk and treated prevalence is less intuitive. If individuals are less likely to die from a disease, they will have more opportunity to develop another condition. The role of mortality for competing risks is especially important to consider in light of the fact that many persons have multiple conditions. Thus, it is plausible that a reduction in the death rate for heart disease could lead to an increase in the treated prevalence of diabetes.
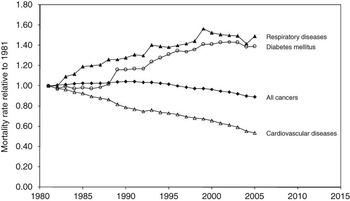
Between 1990 and 2002, life expectancy increased from 75.4 to 77.3 years, an increase of almost 2 years, and life expectancy at age 65 increased from 17.2 to 18.2 years, an increase of 1.5 years (National Center for Health Statistics, 2006). Condition-specific mortality rates for cancer, heart disease (including cerebrovascular disease), diabetes and respiratory disease are displayed in Figure 4. (Mortality rates for some other conditions, such as kidney disease, are difficult to compare over time because of changes in cause of death coding.) Mortality rates for cancer and cardiovascular disease have decreased, while mortality rates for diabetes and respiratory disease have increased. It is important to interpret these figures cautiously. The denominator for the mortality rates is the general population, not persons with the disease in question. Changes in mortality rates can drive changes in prevalence rates or vice versa. For example, the most likely explanation for the increased diabetes mortality rate is that the clinical prevalence of diabetes in the population has increased.
Trends in age adjusted mortality rates for selected conditions (US population ages above 18 years; source: Centers for Disease Control Prevention. National Center for Health Statistics. Health Data Interactive.www.cdc.gov/nchs/hdi.htm (accessed 21 December 2008))

If we think about the model describing the path of a cohort borne into state H, it generates a useful prediction for testing the contribution of mortality reductions to increases in treated prevalence: a decrease in the cause-specific mortality rate will lead to increases in treated prevalence rates that vary positively with age. We prove this claim in the Appendix. (With a slight modification – assuming that people are borne into a healthy state where they are not subject to a competing risk of death – a similar prediction can be derived for the competing risk of death.)
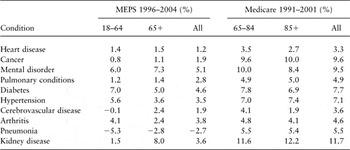
Table 3 presents evidence on the degree to which recent changes in treated prevalence levels vary by age. The first three columns present annualized growth rates based on the 1996 and 2004 MEPS samples. The second set of columns presents annualized growth rates from 1991 and 2001 Surveillance Epidemiology and End Results (SEER)-Medicare claims data. The MEPS and SEER data show that for most conditions, treated prevalence has increased at similar rates across age groups. If declines in mortality were the dominant cause of increases in treated prevalence, we would have expected larger increases among older age groups. One caveat to this analysis is that we cannot control for cohort effects; differences in treated disease prevalence will reflect cumulative risk over a lifetime, and at a single point in time those who are aged 18–64 years grew up in different circumstances from those who are aged 65 years and older.
Annualized growth rates in treated prevalence by age group, standardized by age and sex

The annualized growth rate is the annual percent increase in treated prevalence.
Changes in the screening and detection rate
Treated prevalence will rise in response to an increase in the screening rate, s. Conceptually, we think of screening and detection as capturing changes in the use and accuracy of diagnostic technologies as well changes in the definition and classification of disease that result from guideline revisions, the introduction of new treatments, or the ‘marketing’ of new conditions by pharmaceutical companies.
To document the shift toward earlier diagnosis, we need measures of health status for newly diagnosed patients (i.e. incident cases) before treatment that are collected consistently over time on a large sample of patients. If detection rates have increased substantially, we would expect that incident cases (i.e. newly treated patients) have less severe cases of disease today than in the past. Unfortunately, these types of data exist only for two of the conditions we examine: cancer and end stage renal disease. Below we present trends in health at diagnosis for these conditions.
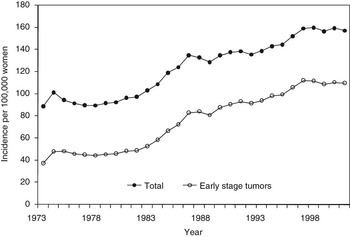
The SEER registry collects data on all patients newly diagnosed with cancer in various regions of the United States. We present data on women newly diagnosed with breast cancer for the years 1973–2002. We use cancer stage as a measure of health status and disease severity at diagnosis. Early stage tumors are confined to the breast tissue and are usually detected via screening. Patients diagnosed with late stage tumors typically present symptomatically.
Figure 5 shows trends in total incidence and the incidence of early stage tumors. Over the period 1973–2002, the incidence of breast cancer in women increased from less than 100 per 100,000 women to over 150 per 100,000 women. The increase in the incidence of early stage tumors mirrors the increase in the overall incidence rate. The incidence of late stage tumors, represented by the vertical distance between the top and bottom lines, has been relatively stable over time.
Trends in breast cancer incidence, women aged 65 years (early stage tumors are classified as ‘In situ’ or ‘Localized’ using the SEER historic stage A; source: SEER)

Some explanations for the increase in breast cancer incidence focus on changes in risk factors, such delayed childbearing, reductions in breastfeeding, increased use of oral contraceptives and hormone replacement therapy and even increased obesity rates. However, the pattern of incident tumors by stage is consistent with another explanation; increases in mammography rates have led to increases in the number of women diagnosed with breast cancer. Between 1987 and 2003, the mammography rate among women aged 40 and older increased from 28.7% to 69.7% (National Center for Health Statistics, 2006). Similar patterns have occurred for other types of tumors that are commonly detected via screening. For example, use of the prostate-specific antigen test to detect early stage prostate cancer began in the late 1980s and increased to 38% among white men and 31% among black men aged 65 and older by the late 1990s (Etzioni et al., Reference Etzioni, Berry, Legler and Shaw2002). Over this same period, the incidence of prostate tumors increased by 48% according to the SEER data. The fact that the increase in the incidence of early stage breast tumors has not been accompanied by a decline in the incidence of late stage tumors suggests that there is substantial overdetection; women are being diagnosed with early stage tumors that would never have become clinically manifest if left untreated (Berry et al., Reference Berry, Cronin, Plevritis, Fryback, Clarke, Zelen, Mandelblatt, Yakovlev, Habbema and Feuer2005).
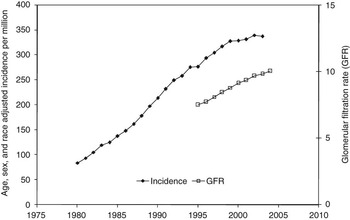
Our second set of disease-specific incidence data are from the United States Renal Data Registry, which collects information on patients with kidney failure. End-stage renal disease may be diagnosed via presentation of symptoms or via screening of high-risk groups. Kidney function at diagnosis is measured using the glomerular filtration rate, with lower rates indicating worse health. Figure 6 shows trends in the overall incidence of kidney failure, on the primary y-axis, and the glomerular filtration rate at diagnosis, on the secondary y-axis. Between 1980 and 2004, the incidence rate increased from 100 per 1,000,000 persons to over 300 per 1,000,000 persons. The glomerular filtration rate at diagnosis increased by one third between 1995 and 2004. While these data do not permit us to determine how much of the increase in the incidence rate is due to better detection vs clinical factors, they suggest that changes in detection patterns have played an important role because the typical patient diagnosed today has a higher glomerular filtration rate than the typical patient diagnosed in the mid 1990s.
Kidney failure incidence and kidney function at diagnosis (source: US Renal Data System)

Explaining changing detection patterns
The evidence presented in the previous section suggests that treated prevalence is increasing partly because of early detection and treatment of pre-symptomatic and mildly symptomatic cases. In this section, we discuss four explanations for this shift in practice patterns: development of new treatment technology, development of new diagnostic technology, pharmaceutical company marketing practices and ‘medicalization’.
New treatment technology
Most of the economic literature on rising medical costs assigns a central role to new treatment technology. Treatment technology leads to treatment expansion when the technology increases the benefits or reduces the costs of treating patients with mild cases of disease. In some instances, new technology offers differential benefits to patients with less severe cases. An example would be breast-conserving surgery for early stage breast cancer. In other cases, new technology offers a uniform benefit for mild and severe cases alike, but the improvement is enough to induce patients with mild, previously untreated cases to seek care.
The case of selective serotonin re-uptake inhibitors (SSRIs) for depression is one of the most well-documented examples of technology-driven treatment expansion. Before the advent of SSRIs, the most common treatment modality was psychotherapy, which entailed a significant time cost for patients. Existing drugs were associated with severe side effects. The introduction of an easy-to-use, effective drug greatly reduced the monetary and time costs associated with treatment. The introduction of SSRIs also solidified the idea that depression was at least in part a biologically based condition, reducing the stigma associated with seeking care and increasing public support for parity mandates to equalize coverage of mental and physical illness. The diffusion of SSRIs was facilitated by the ease with which they could be prescribed by primary-care physicians. The ability to treat depression in the primary care setting reduced barriers to treatment among patients with limited financial resources and patients who lacked the skill to navigate the health-care system to access specialty care.
In the case of depression and some other conditions, such as gallstones, there is a direct link between the development of new technologies and recent increases in treated prevalence (Legorreta et al., Reference Legorreta, Silber, Costantino, Kobylinski and Zatz1993). For other conditions, however, treated prevalence has increased in the absence of major technological breakthroughs. Examples would include early stage prostate, breast and colorectal tumors, asthma, diabetes and kidney disease. It is not that treatment technology for these conditions is static – treatment for early stage breast and prostate tumors is associated with fewer side effects today than in the past – but it is difficult to isolate major, discrete technological improvements in technology. It seems as if the forces driving treatment expansion in these cases are operating independently of changes in treatment technology.
Changes in diagnostic technology
Of the ten conditions we examine, three (heart disease, cancer and high blood pressure) are often diagnosed asymptomatically and three (COPD, diabetes and kidney failure) are often diagnosed in mildly symptomatic forms. The treated prevalence of these conditions will be sensitive to changes in screening and diagnostic technology. In some cases, new diagnostic technology is more accurate than existing technologies, in other cases new diagnostic technology is easier to use, less costly or less invasive.
The case of the prostate-specific antigen (PSA) test for prostate cancer illustrates how treated prevalence responds to new diagnostic technology. Before late 1980s, men were screened for prostate cancer using only the digital rectal examination. Around 1988, physicians began to use the PSA test, often in conjunction with the digital rectal examination, to detect early state prostate tumors. Unlike the digital rectal examination that enables physicians to detect only larger, ‘palpable’ tumors via touch, the PSA permits detection of tumors that are only a few millimeters in diameter. In addition, because the PSA test is a blood test, it is associated with less patient discomfort. Because of its ease of use, the PSA test was used on previously unscreened patients, and because of its high sensitivity, the PSA test detected tumors in patients who were previously classified as cancer-free using the digital rectal examination.
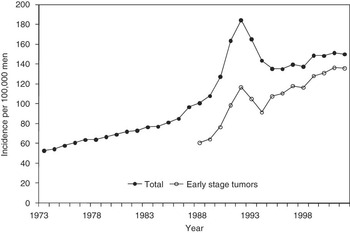
Figure 7 shows trends in total prostate cancer incidence rates and the incidence of early-stage tumors, calculated using data from the SEER registry. The introduction of PSA testing shows up as a sharp spike in the incidence rate from 1988 to 1993. After 1993, incidence rates stabilized at about 194% of the pre-PSA level. While treatment technology for early stage prostate cancer has improved over this timeframe, the changes have been gradual. As in the case of breast cancer, early stage tumors account for all of the increase in total incidence rates (note that tumor staging data are not available pre-1988).
Trends in prostate cancer incidence

Pharmaceutical company marketing practices
A growing body of work, much of it highly polemic, blames pharmaceutical industry marketing practices for recent increases in treated prevalence (e.g. Critser’s (Reference Critser2005) ‘Generation Rx. How Prescription Drugs Are Altering American Lives’, Moynihan and Cassel’s (Reference Moynihan and Cassels2005) ‘Selling Sickness: How the World’s Biggest Pharmaceutical Companies Are Turning Us All into Patients’). Mild mental disorders such as attention deficit hyperactivity disorders and ‘lifestyle’ conditions like erectile dysfunction are often cited as examples of diseases that have been ‘marketed’. Much of the attention has focused on direct-to-consumer advertising, which urges consumers to ‘talk to your doctor’ about signs and symptoms, but this is only one of several avenues by which drug companies can increase demand. Even before the rules governing direct-to-consumer advertising were relaxed in 1997, drug companies promoted aggressive treatment of target conditions by encouraging physicians to screen for specific conditions, developing tools and technologies to facilitate diagnosis, and donating money to patient advocacy groups to promote ‘awareness’.
The use of marketing techniques by drug companies to encourage detection and diagnosis is consistent with economic theories about the relationship between market power and firms’ incentives to engage in market-expanding advertising (Grossman and Shapiro, Reference Grossman and Shapiro1984; Iizuka, Reference Iizuka2004). Yet, it seems overly simplistic to attribute the rise in treated prevalence to marketing alone. To achieve the market power necessary to justify market-expanding advertising, a company must have a product that is truly innovative. (Having a patent is necessary but not sufficient to achieve market power, since on-patent drugs must compete with existing medications and non-pharmacological interventions.) Thus, the literature on the contribution of marketing to treatment expansion seems to be re-stating the hypothesis that technological innovation drives treatment expansion, albeit with strong claims about the welfare implications of treatment expansion. Of note, Iizuka (Reference Iizuka2004) finds that expenditures on direct-to-consumer advertising are positively related to product quality.
Some commentators carry the argument further and claim that recent increases in treatment expansion are the result of the 1997 decision by the Food and Drug Administration to relax the rules governing direct-to-consumer advertising. Rosenthal et al. (Reference Rosenthal, Berndt, Donohue, Epstein and Frank2003) studied the impact of direct-to-consumer advertising on prescription drug spending and found that though the relationship was positive, the post-1997 increase in direct-to-consumer advertising explained <20% of the observed increase in spending. This finding is consistent with the observation that treatment rates for many of the conditions we examine were on the rise before 1997 and treatment rates have increased for conditions like early stage cancer where treatment regimens consist mainly of off-patent drugs and non-pharmacological interventions. On the basis of this evidence, we conclude that pharmaceutical industry marketing practices are a mechanism by which new technology leads to treatment expansion, but ultimately pharmaceutical industry marketing fails as a stand-alone explanation for why treated prevalence is on the rise.
Medicalization
The term ‘medicalization’ is used in medical sociology to describe the process by which the medical community defines new conditions and illnesses. Most of the literature focuses on the creation of entirely new categories of disease, as opposed to the expansion of existing conditions, but some authors have begun referring to the shift towards earlier diagnosis as the ‘medicalization of risk’ (Klawiter, Reference Klawiter2005).
In seeking to explain medicalization, sociologists reject the ‘technological determinism’ that characterizes much of the health economics literature on medical spending (Conrad, Reference Conrad2005). Before scientists can invent a treatment for high blood pressure or ‘pre-diabetes’, the medical community must classify these conditions as ‘diseases’ and persons with the conditions must come to view themselves as ‘patients’. Thus, sociologists focus on the social construction of illness by the medical profession, patient interest groups and industry.
Much of the work on medicalization is descriptive, and the treatment of the dynamic aspects of medicalization often leaves much to be desired. Why are some conditions medicalized and not others? Moreover, why are some conditions only being medicalized today when it would have been advantageous to do so in the past? Nevertheless, the medicalization literature provides a valuable perspective on the increase in treatment rates and shows the fallacy of viewing these trends solely in terms of technological innovation.
Conclusion
There have been sizable increases in treated prevalence for common, high-cost medical conditions over the 1990s and early part of this decade. These trends defy easy explanation. For some conditions, the underlying incidence of disease has increased, possibly reflecting the growth in obesity rates. But the decomposition analysis and analysis of NHANES data suggest that increases in underlying prevalence are insufficient to fully explain observed increases in treated prevalence. Changes in diagnosis and treatment patterns could account for the proportion of the change in treated prevalence unexplained by increased disease incidence. Modern medicine has put increasing emphasis on screening and treatment of patients with ‘subclinical’ illness. Wider use of screening tests, campaigns to encourage care-seeking by patients and changes in the clinical thresholds used to define disease (Herndon et al. Reference Herndon, Schwartz, Woloshin and Welch2007; Kaplan and Ong Reference Kaplan and Ong2007) all contribute to increases in treated disease prevalence.
According to one study, three quarters of the adult population meet the thresholds for at least one chronic disease (Schwartz and Woloshin, Reference Schwartz and Woloshin1999). Of course, these types of findings are not new. A population screening study conducted in 1946–1958 showed that even using the comparably primitive technology of that era, it was possible to diagnose treatable illness in 92% of 10,709 subjects ‘who considered themselves well and declared themselves asymptomatic’ (Schenthal, Reference Schenthal1960).
Given the rapid pace of technological change, we expect treatment rates, conditional on disease prevalence, to continue to rise in the near future. Ongoing research on disease ‘biomarkers’, genetics and novel uses of imaging technology will greatly expand the ability of modern medicine to identify disease in pre-symptomatic phases and continue to blur the distinction between ‘health’ and ‘illness’. There is potential for these types of interventions to have large positive effects on population health by eliminating the downstream consequences of serious illness. At the same time, policymakers should not presume that screening programs are inherently cost-saving, cost-effective or even effective. The evidence base for many early detection-related interventions is surprisingly thin. The case of hypertension, as described by Kaplan and Ong (Reference Kaplan and Ong2007), is instructive. Medical treatment of hypertension has been widely credited with reducing the incidence of serious cardiovascular disease. However, the rationale for treating mild cases of hypertension is based on extrapolating results from trials that enrolled patients with more serious cases. The relationship between blood pressure and cardiovascular outcomes is probably non-linear, in which case the only way to determine the benefits of treatment in patients with mild cases is to study them directly. Obviously, it is not possible to study every treatment in every subpopulation. In general, early detection and treatment interventions should receive the same degree of scrutiny and study that is typically reserved for expensive new drugs and surgeries.
Acknowledgements
We thank Curtis Florence, Lee Rivers Mobley, Christopher Ruhm and participants at the University of Chicago’s health economics seminar, Yale’s health policy seminar, and the National Bureau of Economic Research summer institute for valuable suggestions.
Appendix
Claim: TPα > 0, TPs > 0, TPδ < 0, TPγ < 0, TPμ < 0.
Proof: The parameters δ, γ and μ appear only in the denominator, and so it is trivial to show TPδ < 0, TPγ < 0 and TPμ < 0. To establish that TPα > 0, take the derivative of treated prevalence as given by (4) with respect to α:
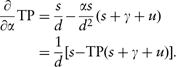
The term d represents the denominator of (4). Re-arranging the second term inside the brackets, we have:
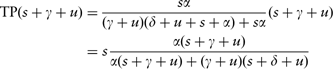
The second term in (A2) is <1, and so the term inside the brackets in (A1) is greater than zero. The expression for treated prevalence is symmetric with respect to s, and so the same argument establishes TPs > 0.
Claim: Let TPt(γ) represent treated prevalence at age t as a function of γ. We show that a decrease in the cause-specific mortality rate, γ, will lead to a larger proportional increase in treated prevalence at older ages,
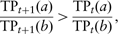
for a < b if two conditions hold: (1) 1 > γ + μ and (2) α < a,b.
The first condition simply states that expected survival time in state D is longer than one period. This second requires that the disease-specific mortality rate be greater than the incidence rate, a reasonable assumption for most of the conditions we examine. For example, the disease-specific mortality rate for cancer is greater than the incidence rate. This condition may not hold for diseases like mental illness where the cause-specific mortality rate is very low. In such cases, the inequality (A3) will hold up to a point, but for large values of treated prevalence, the inequality is reversed. For example, if α = 0.05, μ = 0.02, a = 0.02 and b = 0.01, the inequality holds until TP(a) = 0.71 and TP(b) = 0.76.
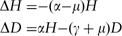
Proof: To simplify notation, we ignore state U and work with a two state model described by the following equations:
Step 1: We show that we can the left-hand side of (A3) as:
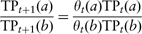
Using (A4), write treated prevalence at time t + 1 as a function of the diseased and healthy populations at time t:

Note that for ease of explication, we suppress the argument of Dt, Ht and TPt. Re-arranging terms, we have:

Step 2: We show that  .
First note that treated prevalence in period 1 does not depend on 
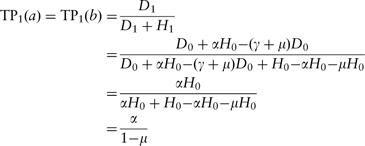
The third equality holds because D 0 = 0 (i.e. people are born into the healthy state).
To establish the claim, we show that holding TPt fixed:  .

The term outside the brackets is positive (recall 1 > γ + μ). The term inside is <0 because TPt +1 < 1. It follows that θ 1(a) > θ 1(b) for a < b.
Step 3: We show that the sequence

converges to 1.
First note that θt > 1 as long as  :
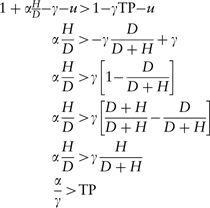
The left-hand side of (A10) the inequality is the numerator of θt (see (A6)), the right-hand side is the denominator. In addition, note that θt = 1 when  .
It follows that:

Then θt converges to 1 as treated prevalence rises from 0 to  and the ratio (A9) converges to 1 as well.
Step 4: We show that  .
The derivative of θt with respect to treated prevalence is:

The term outside the bracket is positive, so the sign of the derivative will depend on the sign of the term inside the brackets.
We can write:
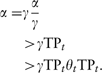
The first inequality holds because  and the second holds because
 . Dividing both sides of (A13) by TPt establishes that
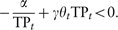
Step 5: We show that (A3) holds.
The inequality will hold as long as

By step 2 we have θ 1(a) > θ 1(b) and by step 3 we have that θt(a) and θt(b) both converge to 1. From step 4 and the fact that for  , TPt + 1 > TPt, it follows that θt is monotonically non-increasing. Thus, it must be the case that θt(a) > θt(b) for all t.