In October 2008, the Centers for Medicare & Medicaid Services halted reimbursement for preventable hospital-acquired conditions (HAC), such as central line–associated bloodstream infections (CLABSI). 1 Although our group’s prior work found no impact of this policy on already declining secular trends in CLABSI rates reported by US hospitals as a wholeReference Lee, Kleinman and Soumerai 2 or by safety net status,Reference Vaz, Kleinman and Kawai 3 we did not examine whether a hospital’s financial operating margin (OM) impacted its response to the HAC policy. Others have demonstrated that hospitals operating at a financial loss have worse performance in terms of quality measures.Reference Ly, Jha and Epstein 4 This report considers the impact of the HAC policy on secular trends in CLABSI rates reported by US hospitals with high versus low OMs.
METHODS
The Preventing Avoidable Infectious Complications by Adjusting Payment (PAICAP) study enrolled acute care, nonfederal US hospitals subject to the Hospital Inpatient Prospective Payment System and reporting to the National Healthcare Safety Network (NHSN). 1 PAICAP recruited these hospitals to evaluate the impact of the 2008 Centers for Medicare & Medicaid Services HAC policy.Reference Lee, Kleinman and Soumerai 2 , Reference Vaz, Kleinman and Kawai 3 Each hospital provided CLABSI data reported to NHSN on the basis of standardized surveillance definitions.Reference Horan, Andrus and Dudeck 5 We included hospitals that reported data in one or more quarters from July 1, 2007, through December 31, 2012. Data prior to July 1, 2007, were excluded because only a small number of PAICAP hospitals reported NHSN data during this time, with an unequal distribution across OM groups.
We obtained demographic data on hospitals by linking to the 2009 American Hospital Association Annual Database 6 and financial data by using the Centers for Medicare & Medicaid Services Healthcare Cost Report Information System. 7 To assess financial standing at the time of policy implementation, we calculated the average 2007–2008 OM for each hospital and then divided the hospitals into OM quartiles. The OM was calculated as: [Net patient revenue − Total operating expenses]/[Net patient revenue], yielding a percentage profit or loss for each hospital.
In our primary analysis, we used an interrupted time series design to evaluate the impact of the HAC policy on quarterly CLABSI rates reported by hospitals in the lowest (greatest annual loss) and highest (greatest annual profit) quartiles.Reference Lee, Kleinman and Soumerai 2 , Reference Vaz, Kleinman and Kawai 3 We hypothesized that the potential for financial penalties might have led to a different response to the HAC policy in hospitals operating at a financial loss. Because ventilator-associated pneumonia (VAP) was not targeted by the HAC policy, this was used as a control condition.
We used χ2 analyses to compare hospital demographic characteristics across the 2 study groups, including region, urbanicity, bed size, type of ownership, teaching status, and safety net status. We identified hospitals as safety net hospitals if their Medicare Disproportionate Share index was in the highest quartile.Reference Vaz, Kleinman and Kawai 3 We also compared central line–days across the 2 study groups in both the prepolicy period (July 1, 2007–September 30, 2008) and the postpolicy period (October 1, 2008–December 31, 2012), using a t test for comparison.
We then used negative binomial mixed-effects models to evaluate the impact of the HAC policy on quarterly CLABSI rates, accounting for clustering at the hospital level. Separate models were run for the lowest and highest quartile hospitals, with data aggregated by quarter to reduce variability. Independent variables included time, policy period (before or after October 1, 2008), and an interaction term between time and policy period. Our analyses evaluated changes in intercept and slope after the policy.
We also performed 3 sensitivity analyses for CLABSI reporting trends, including only hospitals that consistently reported data to NHSN throughout the study period, evaluating OM tertiles rather than quartiles, and using data back to January 1, 2007. Finally, we analyzed the impact of the HAC policy on quarterly VAP reporting using similar negative binomial mixed-effects models. All analyses were performed in SAS, version 9.4 (SAS Institute).
RESULTS
Of 358 US hospitals participating in PAICAP and reporting CLABSI data, 92 were in the lowest quartile for financial performance at the time the HAC policy was implemented (≤−5.78% OM [annual loss]) and 90 were in the highest quartile (≥3.64% OM [annual profit]). Greater than 75% of the hospitals included in the CLABSI analysis also reported VAP data: 70 in the lowest quartile and 72 in the highest quartile.
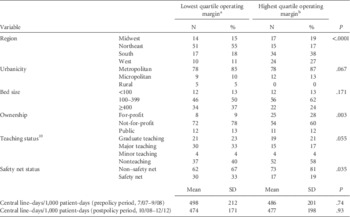
Table 1 compares hospital characteristics in the 2 study groups. For-profit, nonteaching hospitals were significantly more common in the highest quartile group, and safety net hospitals were significantly more common in the lowest quartile group, consistent with national data (online Appendix 1). There were no differences in the number of central lines per 1,000 patient-days in the 2 study groups (Table 1).
Characteristics for PAICAP Study Hospitals Included in Our Analyses Based on Central Line–Associated Bloodstream Infection Reporting July 1, 2007– December 31, 2012

NOTE. PAICAP, Preventing Avoidable Infectious Complications by Adjusting Payment.
a There were 92 hospitals with operating margins ≤−5.78% in 2007–2008 (lowest quartile).
b There were 90 hospitals with operating margins ≥3.64% in 2007–2008 (highest quartile).
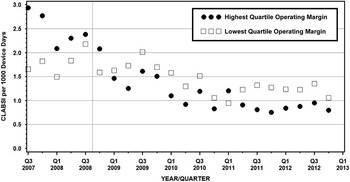
Quarterly CLABSI rates reported by high and low OM hospitals are shown in Figure 1. Among hospitals with the highest average OMs in 2007–2008, we observed decreases in CLABSI rates both before the policy (4% decline per quarter) and after the policy (5% decline per quarter). We found no evidence that the trend for CLABSI differed between the pre- and postpolicy periods (ratio of postpolicy slope to prepolicy slope, 0.99 [95% CI, 0.84–1.17]). There also was no evidence for an immediate change in CLABSI reporting at the time of policy implementation (relative odds when comparing reporting in quarter 4 vs quarter 3 of 2008, 0.74 [95% CI, 0.45–1.21]).
Secular trends in central line–associated bloodstream infections (CLABSI) reported by hospitals in the Preventing Avoidable Infectious Complications by Adjusting Payment study. This is a plot of CLABSI rates per 1,000 device days by quarter from July 1, 2007, through December 31, 2012, as reported by medical and surgical adult critical care units. The figure compares trends for hospitals in the highest quartile versus the lowest quartile based on 2007–2008 operating margins. A line is drawn to indicate the start of the Centers for Medicare and Medicaid Hospital-Acquired Conditions policy in October 2008.

Among hospitals with the lowest average OMs in 2007–2008, we observed increases in CLABSI rates before the policy (8% increase per quarter), followed by decreases after the policy (3% decline per quarter). These 2 trends were significantly different (ratio of slopes, 0.90 [95% CI, 0.84–0.96]). There was no evidence, however, for an immediate change in CLABSI reporting at the time of policy implementation (relative odds, 1.19 [95% CI, 0.77–1.83]).
In all 3 sensitivity analyses, the direction of the preintervention and postintervention slopes was the same as reported above for both high OM and low OM hospitals. However, unlike in our main analysis, the change in slope was no longer significant in the low OM hospitals.
There was no evidence for a change in trend for VAP nor an immediate change in reported VAP rates in either the high OM hospitals (ratio of slopes, 0.99 [95% CI, 0.86–1.14]; relative odds, 0.78 [95% CI, 0.47–1.29]) or the low OM hospitals (ratio of slopes, 0.92 [95% CI, 0.82–1.04]; relative odds, 1.19 [95% CI, 0.77–1.83]).
DISCUSSION
For hospitals with OMs in the highest quartile, CLABSI rates were already declining prior to the HAC policy and continued to decline at a similar rate following the policy. In contrast, for hospitals with OMs in the lowest quartile, CLABSI rates appeared to decline following the policy relative to the prepolicy period. This suggests that the policy may have affected hospitals operating at a financial loss differently than hospitals operating at a financial profit. Still, despite concerns that the HAC policy might lead to shifting resources away from nontargeted HAIs, we did not observe an increase in VAP rates in either of our 2 study populations.Reference Hoff, Hartmann, Palmer, Wroe, Dutta-Linn and Lee 8 , Reference Lee, Hartmann and Graham 9
A limitation in our analysis is the small number of hospitals reporting CLABSI data before July 1, 2007. In general, a longer baseline period is preferred for interrupted time series analyses, and it is possible that a longer baseline would lead to different conclusions. Additionally, we had data available for only a single comparison condition. VAP was the only nontargeted HAI that was consistently reported by most PAICAP hospitals during the study period. We recognize, however, the limitations of using VAP surveillance definitions owing to their subjective nature.Reference Horan, Andrus and Dudeck 5
Our group’s prior work showed no impact of the HAC policy on already declining CLABSI rates overall,Reference Lee, Kleinman and Soumerai 2 but the current findings suggest that the HAC policy may have improved reported CLABSI rates in a subset of US hospitals operating at a financial loss at the time of policy implementation. Continued evaluations are needed to assess whether these findings are robust and to ensure payment policies do not result in unintended consequences for vulnerable populations.
ACKNOWLEDGMENTS
We thank all of the hospitals participating in the PAICAP study that provided NHSN data (Appendix 2). We are also grateful to the members of the PAICAP study team and the PAICAP Advisory Board for their guidance and input in this article.
Financial support. Agency for Healthcare Research and Quality (grant R01HS018414).
Potential conflicts of interest. All authors report no conflicts of interest relevant to this article.
Disclaimer: The content of this article is solely the responsibility of the authors and does not necessarily represent the official views of the Agency for Healthcare Research and Quality.
SUPPLEMENTARY MATERIAL
To view supplementary material for this article, please visit http://dx.doi.org/10.1017/ice.2015.250.