I. INTRODUCTION
Polycrystalline silicon (poly-Si), amorphous silicon (a-Si), and nanocrystalline silicon (nc-Si) are commonly used for large-area electronics such as flat panel displays,Reference Wagner, Gleskova, Cheng and Wu1 x-ray imaging arrays,Reference Reuss, Chalama, Moussessian, Kane, Kumar, Zhang, Rogers, Hatalis, Temple, Moddel, Eliasson, Estes, Kunze, Handy, Harmon, Salzman, Woodall, Alam, Murthy, Jacobsen, Olivier, Markus, Campbell and Snow2 and solar cells. Currently, a-Si is used in Si thin-film transistors for large-area electronicsReference Wagner, Gleskova, Cheng and Wu1 due to its uniformity and low-temperature processing, despite its relatively low electrical carrier mobility.Reference Makino and Nakamura3 There is a growing demand for displays and sensors on larger areas, using flexible and shatter-proof substrates like plastics, that can operate at higher speeds and sensitivities. Large areas require uniformity; flexible substrates require low-temperature processing; and higher speed and sensitivity require use of crystalline material instead of amorphous material. Cost-effective techniques to achieve single-crystal Si on arbitrary substrates will also enable significant technological advancements, such as integration of high performance circuitry with displays or sensor arrays as complete systems.
The interest in achieving high-speed circuitry for large-area electronics has motivated studies on crystal growth on glass and plastics,Reference Wagner and Ellis4 transfer of crystalline structures onto glass and plastic substrates, and crystallization of low temperature-deposited Si.Reference Wagner, Gleskova, Cheng and Wu1, Reference Reuss, Chalama, Moussessian, Kane, Kumar, Zhang, Rogers, Hatalis, Temple, Moddel, Eliasson, Estes, Kunze, Handy, Harmon, Salzman, Woodall, Alam, Murthy, Jacobsen, Olivier, Markus, Campbell and Snow2, Reference Kamins5
Vapor–liquid–solid growthReference Wagner and Ellis4 of Si nanowires leads to single-crystal structures,Reference Cui, Zhong, Wang, Wang and Lieber6 which are compatible with glass and potentially with plastic substrates. The remaining challenges for this approach are related to orientation and placement control.
Transfer of single-crystal islands or large areas can be achieved with silicon-on-insulator (SOI) wafers and using layer transfer techniques, which allow good control over orientation and placement. This is achieved by bonding a handle wafer to the top Si layer, etching of the underlying oxide, bonding of the thin Si layer to the host substrate, and detaching from the handle wafer. This approach, requiring SOI wafers, is cost prohibitive.Reference Shi, Henttinen, Suni, Suni, Lau and Wong7
Crystallization of low temperature-deposited a-Si films is a promising approach that has been studied in the past decades. This requires thermal processing of a-Si. High temperature annealing of a-Si films typically results in polycrystalline films. However, it has been reported that patterning the films to form microstructures with widths smaller than 250 nm can result in the growth of single crystal along the length with preferred crystal orientation. Metal-induced crystallizationReference Wu, Chang, Liu, Wu, Chou, Tu, Lou and Chang8, Reference Su, Lin and Huang9 reduces the required temperature significantly, making it more compatible with low temperature substrates, but there are some concerns regarding the metal contamination in the crystallized films.Reference Kim, Han, Han, Kim, Oh, Kim, Lee and Seo10
Local heating techniques, where the energy required for heating is directly delivered to the film or the patterned structures, allow the substrate to remain at room temperature. These techniques include sequential lateral solidification using an excimer laser,Reference Sposili and Im11, Reference Im, Sposili and Crowder12 rapid melting and growth from melt using self-heating,Reference Sameshima, Andoh and Takahashi13 or microfabricated heaters atop the structures.Reference Andoh, Sameshima and Kitahara14 Some of the laser annealing techniques, such as sequential lateral crystallization, are currently in industrial use.
The approach described in this article is crystallization of nc-Si microwires through single microsecond voltage pulses, leading to self-heating, melting, and growth from melt in a very short time (1 μs). The short duration local heating of the structures to be crystallized makes this approach compatible with low temperature substrates. Real-time current–voltage measurements can be made on these structures during the crystallization process, which can help in understanding the mechanisms involved. The extreme thermal gradients (1 K/nm) and the short time scales involved in these experiments are similar to those in pulse laser annealing. The main differences in this case are due to formation of molten filaments in the current path and thermoelectric effects, which appear to be very strong under the extremely high electric current densities (>20 MA/cm2) during the voltage pulse. Here, we give an overview of our experimental observations on melting, growth from melt and thermoelectric effects, and computational studies on heating and cooling of the wires, including the role of thermoelectric effects.
II. EXPERIMENTAL
A. Fabrication
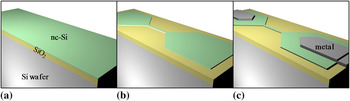
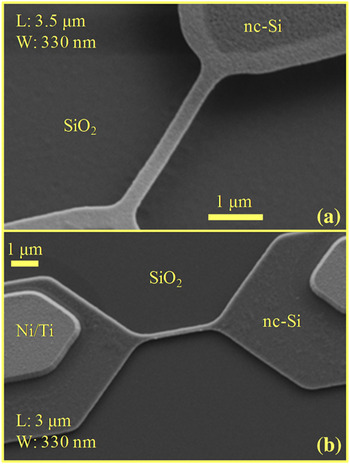
The microwires are patterned on n- and p-type nc-Si films deposited on oxidized single-crystal Si wafers (500-nm SiO2) in a low pressure chemical vapor deposition system at 580 or 600 °C with phosphorous doping or at 560 °C with boron doping ([P], [B] > 1020 cm−3). The room temperature resistivities of the n- and p-type films are 22.95 ± 0.29 mΩ·cm and 12.88 ± 0.26 mΩ·cm, respectively. Some of the microwires are suspended by etching the underlying oxide using buffered oxide etch. Dimensions of the wires range from 0.5 to 25 μm in length and from 100 nm to 1 μm in width. Metal extensions (Ti/Ni or Ti/Al stacks) are deposited to form ohmic contacts to the Si pads. The fabrication process is shown in Fig. 1. Figure 2 shows scanning electron microscope (SEM) images of two as-fabricated microwires.
Device fabrication schematics: (a) silicon dioxide (SiO2) growth and nanocrystalline silicon (nc-Si) deposition; (b) patterning of the nc-Si film; (c) forming of metal extensions.

Scanning electron microscope (SEM) images of as-fabricated (a) suspended microwire and (b) microwire on oxide with metal extensions. The parts of the structure that are released from the underlying oxide appear as lighter color.

B. Microsecond voltage pulse crystallization
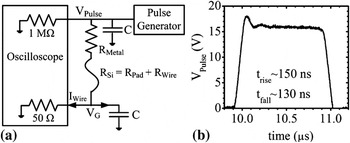
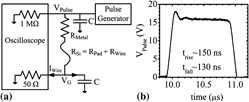
The experiments are conducted using a semiconductor probe station, a parameter analyzer, a pulse generator unit, and an oscilloscope. The setup is configured as seen in Fig. 3(a) for experiments on crystallization through self-heating. The I–V characteristics of the microwires are measured before and after the voltage pulses using the parameter analyzer. The applied voltage (V Pulse) and voltage across the 50 Ω termination (V G) are measured by the oscilloscope during the pulse. Current through the wire is calculated as the resistive current through the 50 Ω termination (V G/50) because the capacitive current is calculated to be less than 1% of the resistive current. Tungsten needles are used to probe the metal contacts or the Si contact regions of microwires without metal extensions.Reference Bakan, Cywar, Silva and Gokirmak15
(a) Schematic of the experimental setup. R Metal and R Si are resistances of metal extension and total Si resistance (contact pad and wire), respectively. C is the coaxial cable capacitance (100 pF). (b) Example of voltage pulse with 16 V amplitude and 1 μs duration.

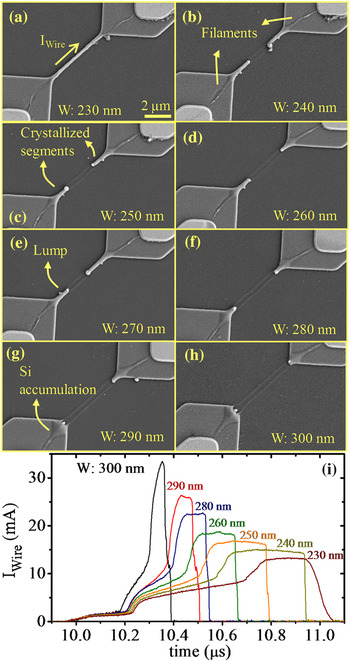
A single high-amplitude voltage pulse applied to a wire results in a characteristic nonlinear increase in current through the wire because of self-heating during the voltage pulse [Fig. 4(i)]. Figure 4 shows that the peak current levels increase with wire width and all other than the narrowest structure break during the voltage pulse as can be seen in the sudden drop in the current during the voltage pulse. I–t plots show stable plateaus [Fig. 4(i)] with corresponding peak current densities in the order of 10 MA/cm2. The SEM images of these structures after the pulse suggest that the wires melt before breaking, and melting is more severe for wider structures [Figs. 4(g) and 4(h)]. Narrower microwires show two smooth, crystallized wire segments at the two ends [Figs. 4(b)–4(f)]. The narrowest microwire shows only the formation of narrow filaments on the Si pads and surface modification on the wire [Fig. 4(a)].
(a)–(h) SEM images of 5.5-μm long, p-type microwires after 20 V, 1 μs pulses. Wide microwires show breaking and crystallized segments or Si accumulation on Si pads under the same pulse condition. (i) I–t plots of the microwires show two transitions and a flat region before the wires break.

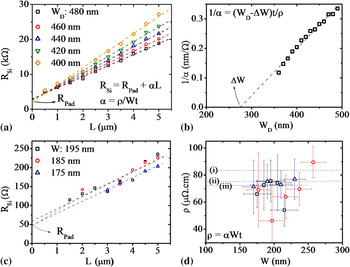
The melting of the wires is verified by extracting the wire resistivity during the pulse when I–t plots show a plateau. This is achieved by calculating the resistance (V Pulse/I Wire) of a number of structures with different widths and lengths. The solid-state microwire lengths and thicknesses are known accurately; however, widths (W) are significantly smaller than the design widths (W D) due to overexposure of photoresist during mask making and pattern transfer processes. The actual wire widths are calculated from electrical measurements performed on an array of devices with varying widths and lengths. Linear fits are made to room temperature resistance versus length for different widths [Fig. 5(a)].The slopes from those fits plotted as a function of design width are used to extract the difference between design and actual widths (ΔW) [Fig. 5(b)]. The actual wire dimensions and the resistance (V Pulse/I Wire) of the wires at the plateau of the I–t plots are used to calculate the resistivity,Reference Bakan, Cywar, Silva and Gokirmak15, Reference Bakan, Cil, Cywar, Silva and Gokirmak19 yielding 73.3 ± 3.9 μΩ·cm. This value is in good agreement with previous reports on liquid Si resistivity of 83 μΩ·cm by Glazov et al.,Reference Glazov, Chizhevskaya and Glagoleva16 75.2 ± 0.6 μΩ·cm by Schnyders and Van Zytveld,Reference Schnyders and Van Zytveld17 and 72 μΩ·cm by Sasaki et al.Reference Sasaki, Ikari, Terashima and Kimura18 Liquid Si at melting temperature is reported to be 10% denser than Si at solid phase at room temperature.Reference Glazov, Chizhevskaya and Glagoleva16 Liquid Si resistivity is extracted to be 66.0 ± 3.5 μΩ·cm, accounting for 10% volume reduction in liquid phase from these microsecond voltage pulse experiments.
(a) Room temperature resistance of microwires with different widths as a function of length from one test site. The y-intercept corresponds to the Si pad resistance, which is expected to be approximately the same for all microwires. (b) Reciprocal of α as a function of design width, obtained from the linear fits in (a). The x-intercept corresponds to the difference between design and actual widths. (c) Resistance of the liquid path for different widths as a function of length as extracted from the flat regions of the I–t plots. (d) Calculated liquid Si resistivity from three different test sites. Dashed lines indicate previous liquid Si resistivity reports: (i) Ref. Reference Glazov, Chizhevskaya and Glagoleva16 (ii) Ref. Reference Schnyders and Van Zytveld17, and (iii) Ref. Reference Sasaki, Ikari, Terashima and Kimura18.

The resistance of Si pads, the y-intercept in the resistance versus length plots of wires in liquid state, is on the order of 50 Ω, suggesting highly conductive continuous liquid Si paths between the two metal contacts [Fig. 5(c)]. The molten and resolidified filaments, indicating the percolation pathsReference Ayas, Bakan, Williams, Gokirmak and Silva20 between the metal contacts and the wire, are visible in the SEM images (Fig. 4). Faster increase in the temperature of the least resistive percolation path and negative temperature coefficient of the nc-Si films result in a positive feedback, leading to an increase in both current density and temperature on this path as most of the current collapses on a narrow filament on the Si pads. The molten filaments resolidify upon termination of the voltage pulse. The filamentation process takes place in less than 1 μs for the microwires seen in Fig. 4 for the given voltage pulse conditions.
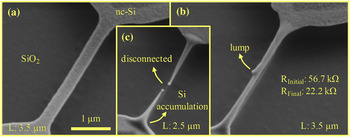
Melting of the wires requires less current, and the mechanical stress induced by the substrate is eliminated if the wires are suspended by removing some of the underlying oxide. The heat loss from the suspended wires is predominantly to the contact regions at the two ends. The as-fabricated suspended microwires, wide and thin with uniform nanocrystalline texture as seen under SEM [Fig. 6(a)], acquire a cylindrical shape with smooth surfaces (due to surface tension) and a lump in the middle [Fig. 6(b)] upon melting and resolidification. The as-fabricated structures have compressive stress, seen as sagging of the structures after the release [Fig. 6(a)]. The recrystallized wires are stretched between the contact pads, indicating a tensile stress. The resolidification process starts from the Si pads and move toward the middle of the microwire. Some of the liquid Si cannot fit in the middle as the two solid–liquid fronts meet because Si expands as it solidifies. Excess Si is ejected and forms a lump after resolidification [Fig. 6(b)]. The microwires that experience longer duration pulses show tapering and breaking [Fig. 6(c)] through Si migration toward the Si pads. Strong thermal gradient along the suspended microwires, owing to low heat loss to the substrate, is expected to suppress nucleation along the wire and consequently limits the number of grains to two, one starting from each end. Microwires on oxide, experiencing smaller thermal gradients during cooling, may resolidify to form more than two grains along the wire [Fig. 4(a)].
(a) An as-fabricated, n-type, suspended microwire and two microwires after (b) 40 V, 1 μs and (c) 40 V, 2 μs pulse. Resistance of the wire in (b) decreased significantly after the pulse.

The conductance of the microwires is enhanced after the voltage pulse. Figure 6(b) shows a 3.5-μm-long microwire with prepulse total resistance of 56.7 kΩ. The total resistance (R Si) consists of the microwire (10 kΩ) and Si pad resistances (40 kΩ). After the voltage pulse, the total resistance of the microwire in Fig. 6(b) was measured as 22.2 kΩ, which is smaller than the prepulse Si pad resistance. Low postpulse resistance is attributed to conductance enhancement in both the microwires and the contact regions, even though the changes in the contact regions are not observable under SEM in this case. Resistivity of the pulsed, unbroken microwires is reduced by a factor of up to10×,Reference Williams, Carpena, Cil, Silva and Gokirmak21 indicating crystal growth rather than solidification in amorphous form.
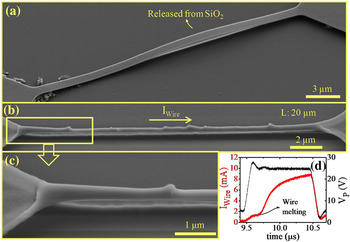
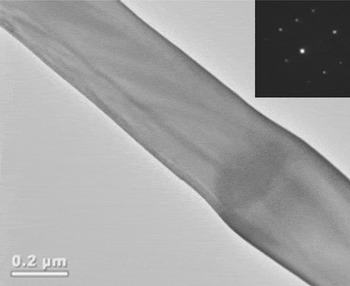
Crystallization is also verified with transmission electron microscope (TEM) studies on a long (20 μm), suspended, p-type microwire, which experienced a single voltage pulse. A short segment of long microwire touches the underlying oxide after the release of the wire due to compressive stress as observed under SEM before the pulse [Fig. 7(a)]. After the pulse, the microwires show smooth surfaces with multiple lumps along the length [Figs. 7(b) and 7(c)]. This wire was cut and placed on a TEM sample holder using a focused ion beam system. Figure 8 shows a bright field TEM image and electron diffraction analysis of a section of the microwire seen in Fig. 7, which shows existence of a single crystal in the imaged area.
SEM image of a (a) 25-μm long, suspended, p-type microwire, (b) 20-μm long, suspended, p-type microwire after a 25 V, 1 μs pulse with current direction during the pulse as indicated. (c) Closeup image of left end of the microwire. (d) I–t plot of the microwire during pulse, showing onset of melting as a sudden increase in current.

Bright field transmission electron microscope image of a section of a 20-μm long crystallized microwire and corresponding electron diffraction pattern (inset).

C. Capture and analysis of light emission from the microwires under long duration biases
The microsecond pulsing of the microwires results in very high current densities (>20 MA/cm2). The peak temperature on the wire reaches the melting temperature of Si (1690 K), while the contact pads remain at room temperature, leading to thermal gradients on the order of 1 K/nm. Thermoelectric effects are expected to be very significant at such current densities and thermal gradients.Reference Rowe22, Reference MacDonald23 The transient effects in the short time scales involved in melting and crystallization in these experiments are difficult to probe. However, it is possible to gain some information about the steady-state temperature profile and the thermoelectric effects from the light emitted from the wire as it is heated up to 1000 K and beyond. This allows for verification of the high temperature materials’ parameters and models used for the computational studies.
The first optical observation of thermoelectric effects in a single material system (Thomson effect) was reported by Mastrangelo et al.Reference Mastrangelo, Yeh and Muller24 The authors observed that the peak light intensity (hottest spot) on p-type poly-Si microlamps was shifted from the center toward the higher potential end (V+). Englander et al.Reference Englander, Christensen and Lin25 observed a similar asymmetric light emission profile shifted toward the lower potential terminal in n-type poly-Si microheaters. Jungen et al.Reference Jungen, Stampfer and Hierold26 also reported a shift toward the lower potential end for self-heated, n-type poly-Si, microbridges.
Thermoelectric effects (thermoelectricity) is due to the coupling of electronic and heat transport through heat transfer by charge carriers. Direct electrical–thermal energy conversion for power generation, solid-state cooling,Reference Rowe22, Reference MacDonald23 and characterization of semiconductor materialsReference Schroder27 are the most common applications of thermoelectricity. Thermoelectricity can be observed as an open-circuit voltage across a temperature difference in a circuit of two different materials (Seebeck effect), heating or cooling at a current-passing junction between two different materials (Peltier effect), and heating or cooling along a current-carrying homogeneous material under a temperature gradient (Thomson effect). The Seebeck voltage polarity and heating versus cooling for Peltier and Thomson effects depend on temperature-dependent thermoelectric properties of the material and directions of temperature gradient and electric current. The three thermoelectric effects are characterized by the Seebeck (S), Peltier (Π), and Thomson (β) coefficients, which are interrelated by the fundamental Kelvin relationshipsReference MacDonald23:


Thomson effect results in skewing of temperature profiles and is typically very small in macroscopic structures; however, it is significant in self-heated small-scale structures such as microlampsReference Mastrangelo, Yeh and Muller24 and microheatersReference Englander, Christensen and Lin25, Reference Jungen, Stampfer and Hierold26 as mentioned earlier, as well as phase-change memory (PCM) elements,Reference Tio Castro, Goux, Hurkx, Attenborough, Delhougne, Lisoni, Jedema, in’t Zandt, Wolters, Gravesteijn, Verheijen, Kaise, Weemaes and Wouters28 owing to the large current densities and temperature gradients. In all these cases of self-heating at high temperatures, the hottest spot along the structures appears closer to the lower potential end (V−) for n-type structures and closer to the higher potential end (V+) for p-type structures, in agreement with expected high-temperature positive Thomson coefficient for n-type (β > 0) and high–temperature negative Thomson coefficient for p-type (β < 0) materials (Fig. 12).
Castro et al.Reference Tio Castro, Goux, Hurkx, Attenborough, Delhougne, Lisoni, Jedema, in’t Zandt, Wolters, Gravesteijn, Verheijen, Kaise, Weemaes and Wouters28 have calculated a Thomson coefficient of −100 μV/K for SbTe above room temperature using an analytical solution for the hottest spot location and indicated that a 5% reduction in RESET current was obtained in asymmetric PCM structures due to Thomson effect. However, changes in the material during the heating process can contribute to the asymmetry in the temperature profile, and hence, the observed asymmetries may be larger than what is due to the pure contribution of thermoelectric effects.
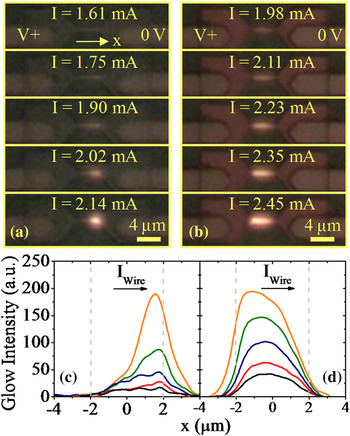
In our experiments, we have recorded videos of light emission from self-heated nc-Si microwires using a high magnification optical setup and a commercial high-definition (full HD) camcorder at 30 frames per second. The wires self-heated to sufficiently high temperatures (T > 800 °C25) emit light in the visible range. The speed of the measurement is limited by the sensitivity and the frame rate of the camera. Hence, the light emission from the wires was observed with slow voltage sweeps and alternating current (AC) signals at 1 Hz frequency. The light intensity profiles along the microwires and shift in the brightest (hottest) spot are extracted from the videos using MATLAB.
As the current increases, the hottest spot on the microwires always shifts toward the lower potential end for n-type microwires and to the higher potential end for p-type microwires, in agreement with the previous reports.24–26 Figure 9 shows two sets of video frames and corresponding light intensity profiles along 4-μm-long, n- and p-type microwires as current increases. The hottest spot is shifted 1.5 μm away from the center of the n-type microwire (37% of the length) and by 1.15 μm from the center of the p-type microwire (30% of the length) for the highest current achieved (>1 MA/cm2). These results are higher than those of previous reports of 5% on p-type, poly-Si microlamps and ∼20% on n-type, poly-Si heaters. We attribute the larger shifts in our experiments on nc-Si microwires to the larger current densities and local deformation of the microwires where the hottest spot was observed (Fig. 10). This local deformation suggests increased resistance at this location, leading to increased local heating and a positive feedback for the shift in the location of the hottest spot.
Two sets of video frames showing glow of (a) an n-type and (b) a p-type microwire as current through the microwires increases as indicated. Electrical bias conditions are shown on the top frames. Microwires’ dimensions (L, W, t) are (4, 0.41, 0.08) μm and (4, 0.42, 0.12) μm for the n- and p-type microwires, respectively. Evolution of glow intensity for the (c) n- and (d) p-type microwires. Wire centers are located at x = 0. Dashed lines indicate ends of the microwires. Curves are smoothened with 5-point adjacent averaging filter.

SEM image of a p-type microwire after a slow voltage sweep, with current direction as indicated. The higher potential end of the microwire, which coincides with the hottest region as observed optically, shows significant modification and fractures.

The effect of changes in the material can be identified and eliminated to some degree by alternating the current direction using an AC signal. Figures 11(a) and 11(b) show glowing of a 2.5-μm-long, suspended, n-type microwire during positive and negative cycles of an AC signal generated by a parameter analyzer. The hottest spot on the microwire alternates position as the current direction changes, confirming that the shift of the hottest spot is not caused by any asymmetric geometrical or thermal boundaries but by thermoelectric effects. Figure 11(c) shows current through the microwire and the shift in the hottest spot location as a function of time. The shift in the hottest spot for either cycle of the AC signal is ∼250 nm (10% of the length). The shift in the hottest spot for the negative cycle gradually increases over time, showing a memory effect. Similar behavior is observed on other wires when they are biased with opposite polarity of the previous bias. Suspended microwires exhibit smaller asymmetries compared to unsuspended ones because they reach glowing temperatures for lower current levels; hence, they show weaker thermoelectric effects.
A 2.5-μm-long, suspended, n-type microwire during the (a) positive and (b) negative cycle of an applied square wave with 0.95 mA amplitude. Current levels and directions are as indicated. Wire center is located at x = 0. (c) Current (I) through the microwire and shift (Δx) in the hottest spot location as a function of time.

D. Numerical modeling
The experimental results are complemented by finite element analysis of a 2.5-μm-long, suspended, n-type microwire using COMSOL Multiphysics software,29 including the thermoelectric effects, using the parameters available in the literature. The thermoelectric effects are included in both current continuity and heat transfer equationsReference Lifshitz, Landau and Pitaevskii30:


where d Si is the density, C P is the specific heat, k is the thermal conductivity, ρ is the electrical resistivity, and S is the Seebeck coefficient. The thermoelectric term (−TJ∇S) in Eq. (4) reduces to the Thomson heat for homogeneous structures  .
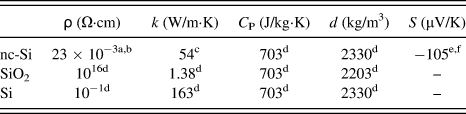
The resistivity of the microwire is modeled as an exponentially decaying function from its room temperature value of 23 mΩ·cm to the melting temperature value of 3 mΩ·cm, following the trend of the measured resistivity in the 300–650 K range (ρ = 3.2 + 195.5 e−T/142 mΩ·cm).Reference Sasaki, Ikari, Terashima and Kimura18 Temperature-dependent thermal conductivity and Seebeck coefficient are not yet characterized for the heavily doped nc-Si used for the fabrication of the wires, nor are there any thermal conductivity or Seebeck coefficient data available in the literature on nc-Si, to the best of our knowledge. Hence, an inverse polynomial extrapolation function given in Ref. 31, fitting the experimental thermal conductivity of heavily doped poly-Si in the 300–800 K range, is used. Similarly, Seebeck coefficient of heavily doped poly-Si ([P] ~ 1020 cm−3) is used at low temperature range (150–450 K)Reference Von Arx, Paul and Baltes32 and Seebeck coefficient of poly-Si with [P] = 6 × 1017 cm−3 is used at high temperature range (700–1350 K) for modeling.Reference Fulkerson, Moore, Williams, Graves and McElroy33 The Seebeck coefficient in the 450–700 K range is extrapolated linearly from these two poly-Si datasets, which intersect at 800 K, and it is also linearly extrapolated in the range between 1350 and 1690 K using the high temperature data (Fig. 12). Density and specific heat of c-Si are close to those of poly-Si and a-SiReference Ong, Sin and Tan37 and change only slightly with temperature; therefore, constant (room temperature) c-Si values29 are used. The room temperature values of the modeling parameters of nc-Si, SiO2, and c-Si layers are shown in Table I. Figure 13 shows the three-dimensional structure used for the modeling of the microwire and the electrical and thermal boundaries. A 5.8 V, 1 μs voltage pulse or square wave (AC) with increasing amplitude is applied across the wire. The current continuity and heat transfer equations including thermoelectric effects are solved self-consistently [Eqs. (3) and (4)]. The modeling of pulsed wires is also performed without thermoelectric effects for comparison.
Experimental Seebeck coefficient of Si as a function of temperature from the literature. Crystallinity, dopant type, and doping level or resistivity of the samples are indicated in the legend. nb-Si is used for nanobulk Si. aRef. Reference Geballe and Hull34, bRef. Reference Von Arx, Paul and Baltes32, cRef. Reference Fulkerson, Moore, Williams, Graves and McElroy33, dRef. Reference Bux, Blair, Gogna, Lee, Chen, Dresselhaus, Kaner and Fleurial35, and eRef. Reference Jones, Le Comber and Spear36.

Three-dimensional structure used for numerical modeling: a 2.5-μm long, suspended nc-Si microwire and pads on SiO2 over c-Si substrate. A single voltage pulse or a square signal with increasing amplitude is applied to the square section of the left pad, while the square section on the right pad and the bottom surface of the substrate are set to 0 V. The temperature at these electrical boundaries is kept at 300 K.

Room temperature values of the physical parameters used for the modeling.

aThis work, bRef. Reference Sasaki, Ikari, Terashima and Kimura18, cRef. Reference Geisberger, Sarkar, Ellis and Skidmore31, dRef. 29,eRef. Reference Von Arx, Paul and Baltes32, and fRef. Reference Fulkerson, Moore, Williams, Graves and McElroy33.
nc-Si, nanocrystalline silicon; SiO2, silicon dioxide; Si, silicon.
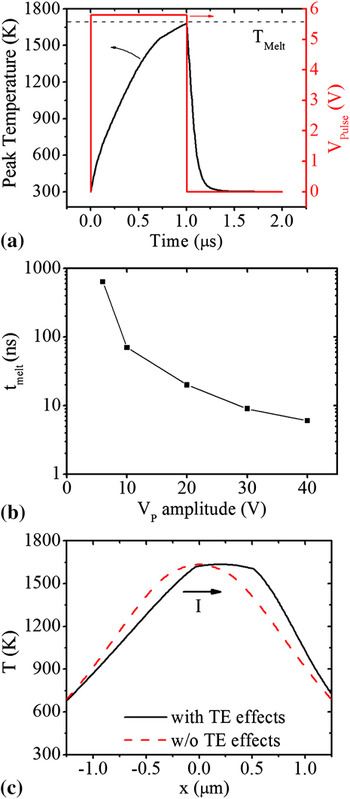
Simulation results for the pulsed wire are seen in Fig. 14. The peak temperature on the wire reaches melting temperature of Si (1690 K) in 1 μs for 5.8 V, 1 μs voltage pulse [Fig. 14(a)]. The voltage pulse amplitude is chosen to keep the peak temperature on the wire below the melting temperature because the phase change is not included in the modeling. The time to reach the melting temperature scales down as the voltage pulse amplitude is increased [Fig. 14(b)]. The simulations suggest that the peak temperature on the wire can reach the melting temperature in less than 10 ns for voltage pulse amplitudes larger than 30 V. The cooling time of the wire is less than 250 ns for the given geometry. The simulated temperature profile along the wire just before melting is significantly skewed compared to the profile simulated without thermoelectric effects [Fig. 14(c)]. The peak temperature is closer to lower potential end of the wire, which is in agreement with previous reports and our optical observations. Figure 14(c) suggests that the melting of the wire starts on one end and continues until the whole wire melts.
(a) Simulated peak temperature on a 2.5-μm long, suspended, n-type, nc-Si wire during a 5.8 V, 1 μs voltage pulse with 5 ns rise and fall times. (b) Simulated time required to reach the melting temperature of Si (1690 K) on the wire as a function of voltage pulse amplitude. (c) Simulated temperature along the wire just before reaching melting temperature with and without thermoelectric effects. The arrow indicates the current direction.

The light emission from the self-heated microwires is expected to be due to blackbody radiation.Reference Mastrangelo, Yeh and Muller24 The light emission intensity profiles corresponding to the simulated temperature profiles are calculated using Eq. (5)Reference Mastrangelo, Yeh and Muller24 in the visible range to compare the simulated and experimental light intensity results.

where ε(λ,T) is the emissivity of the microwires, which is assumed to be constant as it changes only very slightly throughout the visible range for Si.Reference Sato38 E(λ,T) is the blackbody radiation from the microwire as a function of radiation wavelength and temperature. The calculated light emission is convoluted using a point source approach to emulate the diffraction-limited experimental light intensity profiles.Reference Brandon and Kaplan39 Each 1-nm segment of the microwire is assumed to be a point light source with a Gaussian intensity profile as given in Eq. (6).

where x center is the point where the Gaussian profile is evaluated, I(x center) is the blackbody radiation from that point, and σ is the width for the profile. The optical resolution of our system, calculated as 1.11λ, where λ is the wavelength of the emitted light,Reference Brandon and Kaplan39 was used for σ. The intensity profiles from each point source are added together and scaled to have the same peak intensity as the experimental profile.
Figure 15(c) shows the experimental (I = 0.95 mA) and simulated light intensity profiles (I = 0.96 mA) exhibiting 250 and 154 nm of shift in the hottest spot [Figs. 15(a) and 15(b)], respectively. The simulated light intensity profiles are in good agreement with the experiments, showing the correct direction of the asymmetry and a comparable magnitude for the shift of the hottest spot location. The difference is expected to be due to a mismatch between the actual physical nc-Si parameters (electrical and thermal conductivities and Seebeck coefficient) and those used for the simulation from the literature for similar materials. The same simulations performed for heavily doped nanobulk-Si (milled and welded nano-grain Si)Reference Bux, Blair, Gogna, Lee, Chen, Dresselhaus, Kaner and Fleurial35 show smaller asymmetry in the temperature profile owing to smaller Thomson coefficient of nanobulk-Si.
(a, b) Simulated temperature profiles of the suspended, n-type microwire for indicated current level and direction. Experimental and simulated light intensity for (c) positive and (d) negative voltage cycles. Current direction for each cycle is as indicated. The simulated light intensity profiles are calculated as blackbody radiation from the microwires in the visible range, at a current level (0.96 mA) that matches the experimental value.

III. SUMMARY
Nanocrystalline Si microwires are self-heated, melted, and crystallized by microsecond voltage pulses. The crystallized microwires are under tensile stress and typically acquire a cylindrical shape with smooth surfaces. Highly conductive continuous liquid Si paths form between the metal contacts and the wire following percolation paths on the Si pads. Significant reduction in resistivity and TEM analysis of a section of a pulsed, suspended microwire indicate crystallization of the microwires upon resolidification, with growth of large single-crystal domains.
The extremely high current densities (>20 MA/cm2) and temperature gradients (~1 K/nm) reached along the microwires result in strong thermoelectric effects as observed through asymmetric heating of the microwires. These thermoelectric effects are analyzed through capture of asymmetric light emission from both n- and p-type microwires during slow voltage sweeps and low frequency AC signals. The hottest spot is always closer to the lower potential end for n-type microwires and closer to the higher potential end for p-type microwires. Low frequency AC voltage applied to the microwires results in alternating location of the hottest spot, confirming the thermoelectric nature of the observed asymmetric self-heating, rather than being due to any asymmetric geometrical or thermal boundary condition. Characterization of Thomson effect through analysis of light emission from self-heated small-scale structures can be used as a tool to study nonequilibrium thermoelectric properties of materials and confined geometries as compared to the equilibrium (no current) Seebeck voltage.
Numerical modeling of the thermoelectric transport in an n-type microwire during an AC signal, including temperature-dependent physical parameters, shows good agreement with the experiments. Simulation results for a microsecond voltage-pulsed microwire show significantly skewed temperature profiles for temperatures close to melting temperature of Si, suggesting that this model can be used to predict the heating and cooling of microwires during the rapid self-heating and crystallization process.
The findings of this work are relevant for studies on crystallization techniques and thermoelectric effects under high current densities and thermal gradients. Higher performance may be achieved for small-scale electronic devices, such as PCMs, by accounting for thermoelectric effects in device design.
ACKNOWLEDGMENTS
The devices were fabricated at the Cornell NanoScale Science & Technology Facility. SEM imaging was partially performed at the Harvard Center for NanoScale Systems. We thank Nathan Henry and Cicek Boztug for their help with design and fabrication of the microwires. We also thank the CNF staff for their support for the fabrication of the structures and Roger Ristau with the University of Connecticut Institute of Materials Science for TEM sample preparation and analysis. This work was supported by the National Science Foundation (ECCS 0702307, 0824171 and 0925973), the Department of Energy (DE-SC0005038) and the University of Connecticut Research Foundation.