I. INTRODUCTION
The X-ray diffraction community collects a great deal of data which consist of patterns with very sharp, intense peaks scattered over a background with a weak signal. The individual bins in these patterns consist of photon counts, and their statistical variation is well described by Poisson (counting) statistics. Such data sets may be collected either as a single, uniform scan of an instrument over the full angular range of interest, or as a set of shorter scans which cover the regions around the sharp peaks at high resolution, so that most of the data acquisition time is spent on “interesting” regions. Hybrid scans which cover the peaks at high resolution, and the whole pattern at a lower resolution, are particularly effective at reducing counting time while assuring precise peak information and a good understanding of the background. This paper presents a statistically rigorous set of procedures for manipulating such data sets, especially in the case in which the data involve very low counting rates, where the difference between exact Poisson statistics and the commonly-used Gaussian approximation is significant.
II. STATISTICAL BACKGROUND
For a Poisson-distributed variable which describes the counting of uncorrelated events at a fixed rate, the following well-known relations hold (Wikipedia, 2018) (where a quantity x in angle brackets 〈x〉 represents the mean value of the quantity):
 $$P(\mu, N) = \displaystyle{{\mu ^N} \over {N!}}e^{-\mu} $$
 $${\rm Var}(N,\mu )\equiv \langle{{\lpar {N-\mu} \rpar }^2} \rangle = \langle{N^2} \rangle -\mu ^2 = \mu, $$
where P(μ, N) is the Probability Distribution Function (PDF) of observing N events in some interval if the perfectly-known mean rate of events for this interval is μ, and Var(N, μ) is the expected variance of the number of events around this mean, which is also equal to the mean. The critical statement here is that μ is somehow known correctly, a priori. However, in a real measurement, all that is available is an observation of the number of counts N itself. The first issue to address is the determination of the relationship between an observed number of counts and an expected mean value μ. This has been addressed by Bayesian methods in papers such as Kirkpatrick and Young (Reference Kirkpatrick and Young2009), which conclude that, for an observation of N events in an interval, the most probable assignment of μ is μ = N + 1, and that the variance from Eq. (2) is also N + 1.
Another (more transparent) approach, which yields exactly the same result, is to directly consider the possibilities presented by an observation of N events. To accomplish this, we need to note some properties of P(μ, N):
 $$\mathop \sum \limits_{i = 0}^\infty P(\mu, i) = 1$$
 $$\int_0^\infty {P(\mu, N)\; {\rm d}\mu = 1} $$
 $$\eqalign{& \int_0^\infty {\mu ^mP(\mu, N)\; {\rm d}\mu = \displaystyle{{(m + N)!} \over {N!}}} \cr & \quad = (N + 1) \times \ldots \times (N + m).}$$
Equations (3) and (4) imply P(μ, N) is both a normalized PDF for the discrete variable N at fixed μ and for the continuous variable μ for a fixed N. Then, for a given number N of counts observed, we can consider these counts to have resulted from, with equal probability, a parent distribution with any possible value of μ. From this, we calculate the expectation value of μ and its variance. The assumption of equal probability is equivalent to a Bayesian approach having no prior information. Then,
 $$\eqalign{& \langle\mu \rangle = \int_0^\infty {\mu P(\mu, N)\; {\rm d}\mu = N + 1} \cr & \langle{\mu^2} \rangle -\langle\mu \rangle ^2 = \int_0^\infty {\mu ^2P(\mu, N){\rm d}\mu -{(N + 1)}^2} \cr & \!\qquad \quad \quad \quad = (N + 2)(N + 1)-(N + 1)^2 = N + 1.} $$
III. APPLICATION TO DATA
Equation (6), then, establishes that the variance of an observation of N counts is N + 1. As pointed out in Kirkpatrick and Young (Reference Kirkpatrick and Young2009), this is commonly used ad hoc to eliminate divide-by-zero conditions in statistical analyses in which a weight of 1/σ 2 is used in a fitting procedure, but it is formally correct to do this. Data from X-ray powder diffraction experiments are often stored as “xye” files, in which the first column is the detector angle, the second column is the counting rate, and the third column is the standard uncertainty on that counting rate. The previous section then yields rules for both creating and manipulating xye file data. First, in the creation of an xye entry, if one has N counts in a dwell time of τ, the columns would be set to
 $$\eqalign{y = &N/\tau \cr e = &\sqrt {N + 1} /\tau.} $$
If one is faced with already-created xye files, in which the more standard choice of y = N/τ and  $e = \sqrt N /\tau $ has been made, it is possible to approximately convert them to this standard. The problem lies in the bins with zero counts, which therefore are recorded with zero error. This makes it impossible to directly compute the dwell time for the empty bins. Assuming the data were taken with constant or smoothly varying count times, though, one can use the dwell time τ′ from a nearby non-empty bin with rate y′ and error e′, by computing τ′ = y′/e ′2 and then replacing the e value of the empty bin with e new = 1/τ′ = e ′2/y′. The e column of non-zero bins will be replaced with
 $$\eqalign{e_{{\rm new}} & = \displaystyle{{\sqrt {N + 1}} \over \tau} = \displaystyle{{\sqrt {{\lpar {y/e_{{\rm orig}}} \rpar }^2 + 1}} \over {y/e_{{\rm orig}}^2}} \cr & = \sqrt {e_{{\rm orig}}^2 + {\lpar {e_{{\rm orig}}^2 /y} \rpar }^2.}}$$
Note that the alternative of just dropping empty bins is statistically wrong; the empty bins have finite weight and contribute to any analysis.
After this, the more interesting question is how to combine bins in such data sets. The data are always treated as heteroskedastic, but the distributions are not really Gaussian. The usual method of computing the minimum-uncertainty weighted mean of two Gaussian-distributed quantities y 1 ± σ 1 and y 2 ± σ 2:
 $$y = \displaystyle{{y_1/\sigma _1^2 + y_2/\sigma _2^2} \over {1/\sigma _1^2 + 1/\sigma _2^2}} $$
is not really right, since these are Poisson variates, and not Gaussian. The correct solution to combine a set of M measurements recorded as y j and e j (j = 1…M) is to reconstruct the N j and τ j which are represented by the recorded values, and compute the total N and τ. This preserves the Poisson nature of the statistical distribution (since all that has been done is to regroup counts). One can solve Eq. (7) for each N and τ using an intermediate quantity α:
 $$\eqalign{\alpha _j\equiv\, &\left( {\displaystyle{{y_j} \over {e_j}}} \right)^2 =\, \displaystyle{{N_j^2} \over {N_j + 1}} \cr N_j =\, &\displaystyle{{\alpha _j \,+ \sqrt {\alpha _j^2 + 4\alpha _j}} \over 2} \cr \tau _j =\, &\displaystyle{{\sqrt {1 + N_j}} \over {e_j}}\;} $$
and the statistics of the M combined measurements are:
 $$\eqalign{y =\, &\displaystyle{{\mathop \sum \nolimits_{\,j = 1}^M {\rm} N_j} \over {\mathop \sum \nolimits_{\,j = 1}^M {\rm} \tau _j}} \cr e =\, &\displaystyle{{\sqrt {1 + \mathop \sum \nolimits_{\,j = 1}^M {\rm} N_j}} \over {\mathop \sum \nolimits_{\,j = 1}^M {\rm} \tau _j}}\;} $$
IV. ADAPTIVE REBINNING
Often, it is useful to take a data set which has regions with many bins with only a few counts, and accumulate the many low-count bins into a smaller number of bins with higher numbers of counts. This is not normally recommended for least-squares fitting procedures, assuming the weights are computed carefully, since any aggregation of data results in some loss of information. However, most of the aggregation is in regions with few counts, where there is not much information in the first place, and it may result in a large speed increase because of the reduction in the number of bins to analyze. For the purposes of plotting data sets, and for the presentation of results for distribution, rebinning can be very useful. If such rebinning is carried out in such a way as to assure a minimal statistical significance for each accumulated bin, rather than by just collecting fixed-width groups of bins together (which at least results in uncorrelated bins, but results in broadening of peaks in regions with plenty of counts), or (worse) by computing a running average (which produces correlated bins, most likely resulting in incorrect error estimates from fitting software), the resulting data set can preserve a great deal of information about the widths and positions of strong peaks, while creating points in the weak regions which have reduced y uncertainties at the expense of increased x uncertainties.
We present an algorithm here that rebins data from a set of xye values while reasonably preserving the shape of strong peaks, and strictly preserving statistics of the counts within bins and the first moments of peaks. It transforms an xye set into a new xye set. This set can be created from a single xye pattern, or from multiple patterns which have just been concatenated into a single array, and then sorted on x. There is no requirement on the uniqueness of x values, as long as they are non-decreasing. The notation below implicitly uses the conversions in Eq. (10). Although we represent the calculation of α j and N j as pointwise operations, if one is working in a computer language which permits direct array operations, these can be computed for the entire xye array in advance of the iterative part of the algorithm. We assume a computer language which includes lists of objects in one form or another (python lists, c++ std::vector, etc.), and in which the first element of a list is indexed as element 0, and the the ith element of the list z is written as z i. We use quantities in brackets {a, b, c, …} to represent a list of items. The pseudocode is written without the use of structured programming constructs, even though a “while” loop is likely the real implementation of the steps from 3 through 13 in a modern computer language. The “=” sign is a comparison operator; the “←” is assignment.
The input to the algorithm is M points of xye data, referenced as x j, y j, e j, α j, and N j (from Eq. (10)), and a minimum relative error ε for a bin to be considered sufficient. The tolerance in step 8 is just a small fraction of the typical bin spacing, so that combined data sets which may have very nearly equal x values do not get similar bins split across outgoing channels. The algorithm runs as follows:
1. create lists sn ← {0}, sτ ← {0}, sxn ← {0}
2. create data counter j ← 0 and current bin counter k ← 0
3. if j = M: go to step 13
4. sn k ← sn k + N j
5. sτ k ← sτ k + τ j
6. sxn k ← sxn k + x j N j
7. j ← j + 1
8. if j < M and x j − x j−1 < tolerance: go to step 3 (make sure nearly repeated x values all get summed into the same bin)
9. if sn k + 1 < 1/ε 2: go to step 3 to accumulate more data
10. append a 0 to lists sn, sτ, and sxn to start a new bin
11. k ← k + 1
12. go to step 3
13. eliminate any bins in all lists corresponding to bins for which sn j = 0. This can really only happen on the final bin if there are empty bins at the end of the incoming data sets.
14. compute x′ ← sxn/sn (operations on lists are carried out element-by-element).
15. compute y′ ← sn/sτ
16. compute
 ${e}^{\prime}\leftarrow \sqrt {sn + 1} /s\tau $

These final lists are the new xye data set. It is worth noting, though, this has thrown away one piece of statistical information. The new bins are unevenly spaced, and have an uncertainty on their x value, too, since they are aggregated from multiple original bins. A more complete version of this algorithm would generate 4 columns of output: x, x error, y, y error, and would include a summation of  $x_j^2 N_j$ to allow computation of the second moment of x which would feed into the x error. The incompatibility of this with common pattern fitting algorithms makes it less easy to use, and the benefits seem mostly weak, so in most cases, the algorithm in this section suffices.
V. SAMPLE RESULTS
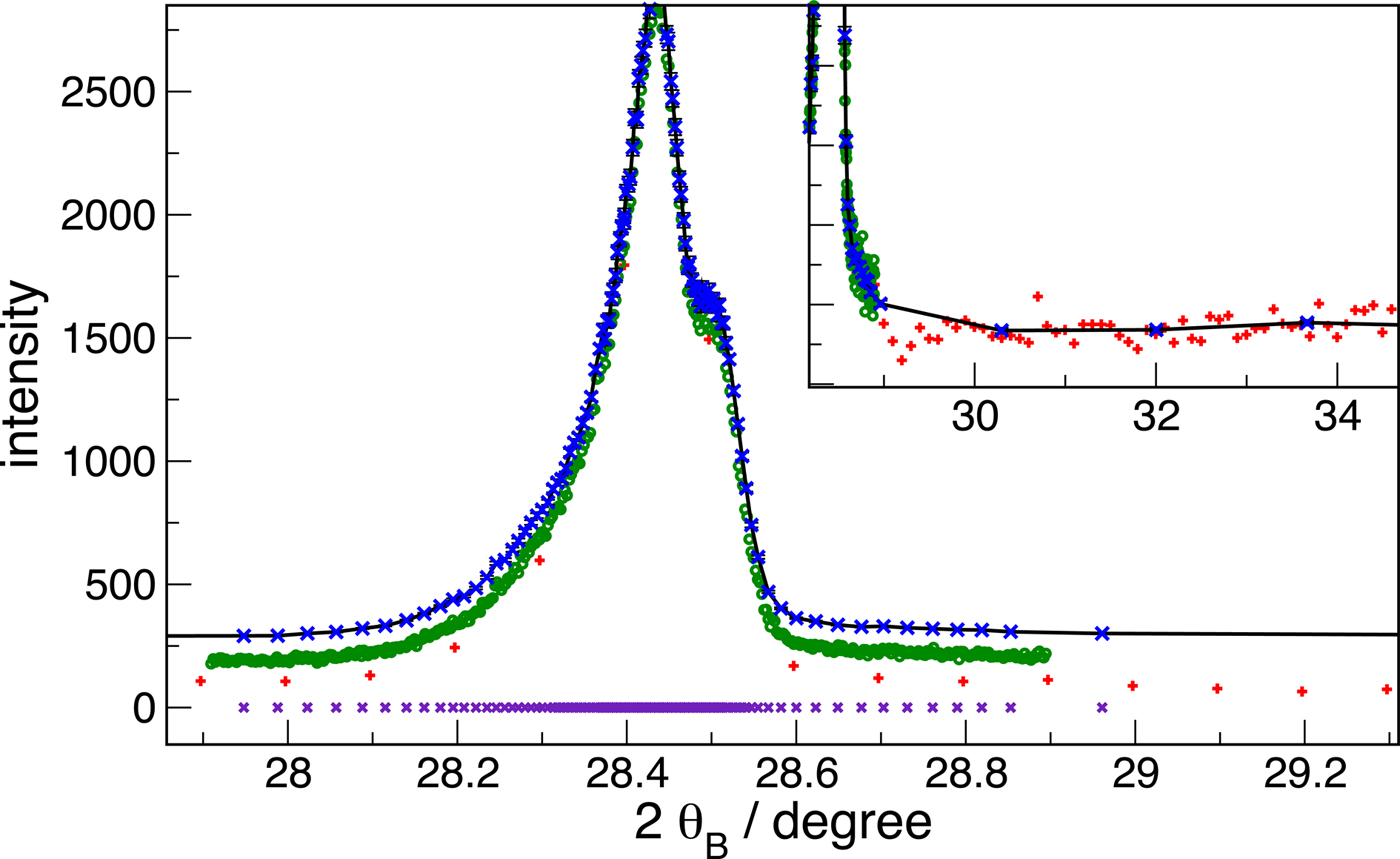
Figure 1 shows the result of this type of operation on data sets collected from the NIST Parallel Beam Diffractometer (PBD) (Mendenhall et al., Reference Mendenhall, Henins, Windover and Cline2016, Reference Mendenhall, Henins, Hudson, Szabo, Windover and Cline2017) equipped with a focusing mirror. The data consist of a coarse survey scan of diffraction of Cu radiation from a silicon powder (SRM660b, NIST, 2010) sample (red “ + ” signs), and a very fine scan over the peak to get details of the peak shape (green circles). The blue crosses are the result of concatenating and sorting these two sets, and rebinning with a  $\varepsilon = 2\% $ relative tolerance. The following characteristics are evident: (1) on top of the peak, the rebinned channels are in 1:1 correspondence with the raw data, since statistics are sufficient there that each channel satisfies the
 $\varepsilon = 2\% $ requirement; (2) as one moves down the side of the peak, the rebinned points move farther apart, since more channels are being aggregated to achieve the goal; (3) the variance of the blue crosses is much lower than the red (survey) data in the low-counts region, since the bins are highly aggregated. The total number of points in the source data sets, over the whole scan range (20°–140°) is about 6000, but only 640 remain in the rebinned set, yet very little information has been lost.
(Color online) Example of rebinned data from CuK α diffraction from silicon powder. Green circles, high-resolution on-peak scan. Red “ + ”, low-resolution survey scan. Blue crosses, rebinned combination showing variable bin spacing with  $\varepsilon = 2{\rm \%} $. The data sets are offset vertically for clarity. Violet crosses at the bottom are the rebinned set projected down to the x-axis, to make it easier to see the adaptive point spacing. The inset shows a vertically expanded region where the count rate is very low.

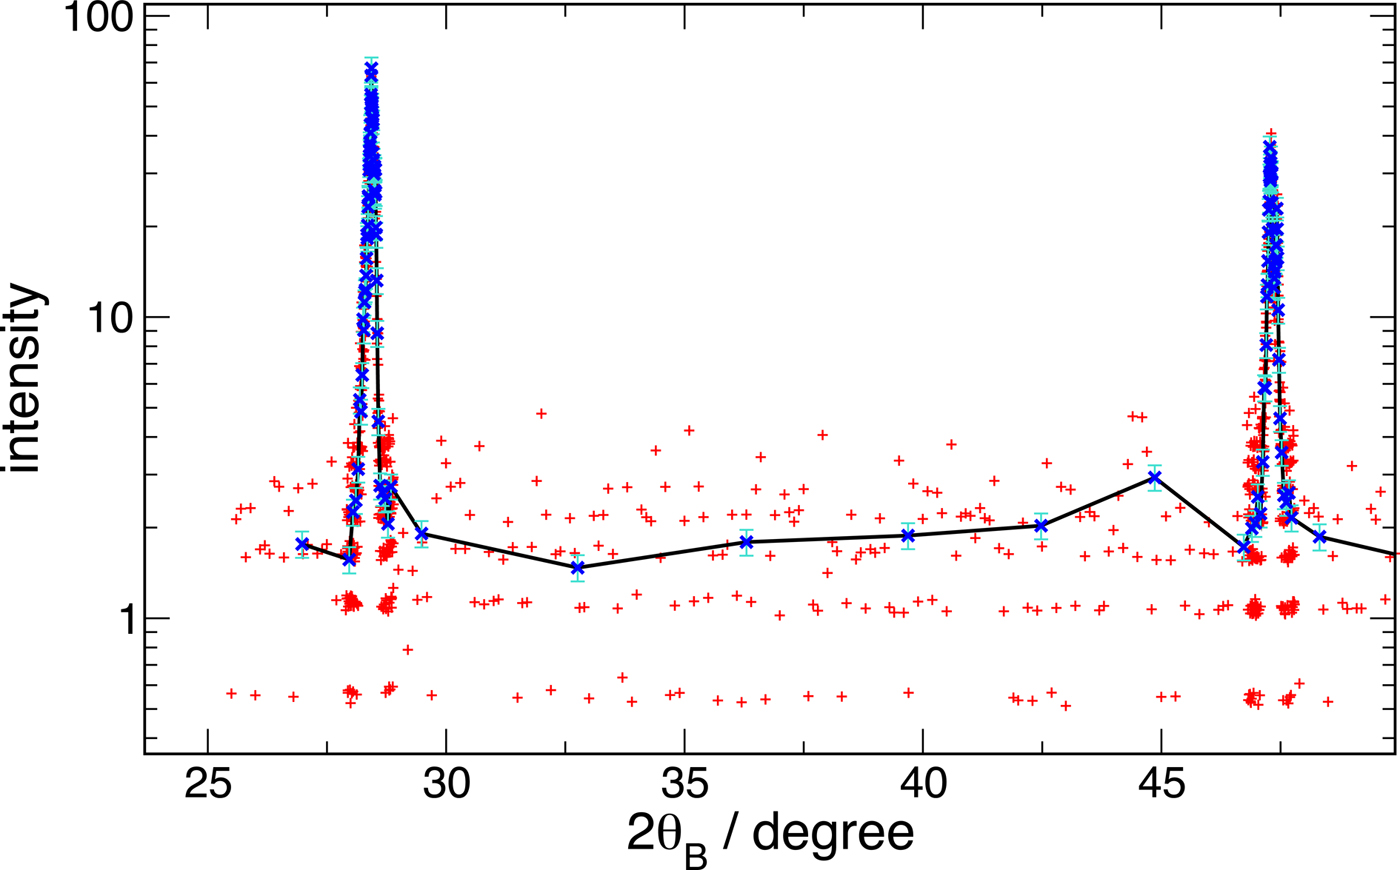
The utility of this procedure for preparation of readable graphic representations of data becomes particularly clear when data are being presented on a logarithmic vertical scale. In this case, the noise in low-count areas, especially if there are channels with no counts, results in a nearly unreadable baseline. Figure 2 shows this effect, with data synthesized from those of Figure 1 to simulate reduced counting statistics. The red crosses are widely scattered on the log scale, but the blue, rebinned result has a very easily determined level.
(Color online) Log-scale plotted data showing the benefit of rebinning to the readability of the baseline below peaks. Red “ + ” are semi-synthetic data; blue “x” with the line is rebinned. Error bars are 1σ of the aggregated data.

Although, in general, data rebinning is harmful to the analyses of data such as least-squares fitting, it is worthwhile to quantify the actual effect of such binning on such fits. The complete data set, from 2θ = 20° to 2θ = 140°, used as an example in Figure 1 has been adaptively rebinned into sets with  $\varepsilon = 10\% $,
 $\varepsilon = 5{\rm \%} $,
 $\varepsilon = 2{\rm \%} $, and
 $\varepsilon = 1{\rm \%} $ tolerances. These sets were then fitted using the Fundamental Parameters Approach (FPA) (Cheary and Coelho, Reference Cheary and Coelho1992; Cheary et al., Reference Cheary, Coelho and Cline2004; Mendenhall et al., Reference Mendenhall, Mullen and Cline2015) and a Pawley procedure (Pawley, Reference Pawley1980) using Topas5Footnote 1 (Bruker AXS, 2014) software. The fit parameters allowed to vary were the lattice parameter, the Lorentzian crystallite size broadening, and the apparent outgoing Soller slit width to fit the axial divergence, and are displayed in Table I. It is important to note that the same underlying data set is used in all cases, so the differences between the fits should be much less than the statistical error bars if the rebinning is valid. Only the set reduced to 176 points (less than
 $3{\rm \%} $ of the original size) is beginning to show changes to the fit that are statistically significant; in this set, many of the weaker peaks only have 2 or 3 points across the full width at half maximum. The fit times were the time for 200 iterations of the fitter, they vary significantly from run to run, and should only be taken as general guidance for speed. The difference between the almost-complete (
 $\varepsilon = 10{\rm \%} $ tolerance) and very sparse (
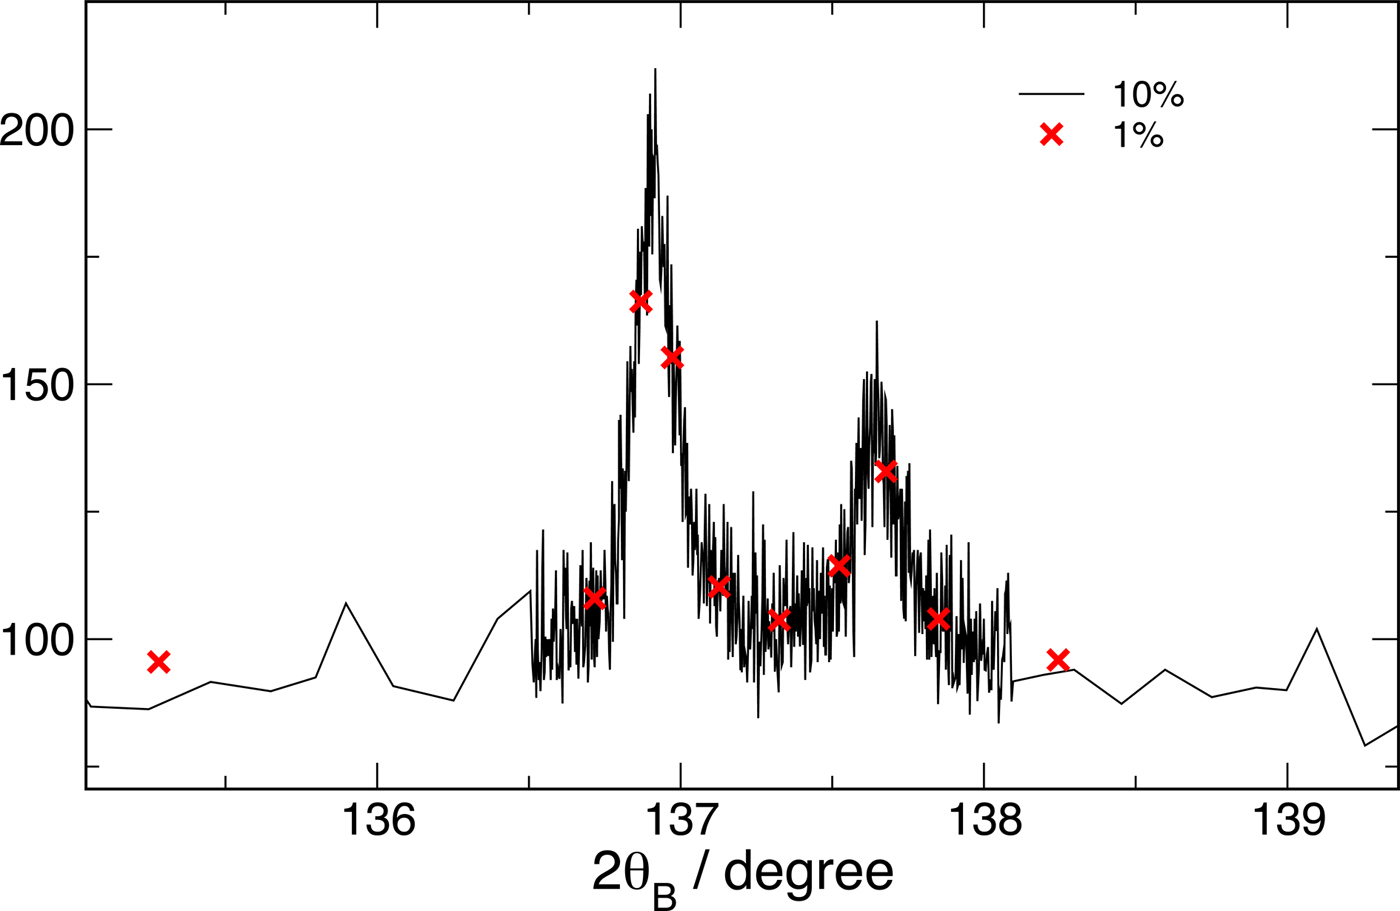
 $\varepsilon = 1{\rm \%} $ tolerance) data set is shown in Figure 3.
(Color online) Comparison of minimally aggregated data to highly aggregated data used for fits in Table I. This is a detail of a weak region of the entire angular range from 20° to 140°. The data labels are the tolerance used in the rebinning.

Results of fitting data set with varying adaptive rebinning tolerance ε.

Errors reported are purely statistical 1σ.
VI. CONCLUSION
A formal recognition of the differences between the errors associated with a Poisson distribution and those of a Gaussian distribution leads to some rules which allow manipulation of counting-statistics data sets in a manner that does not degrade the statistical information in them. In particular, the association of a variance of N + 1 with an observation of N counts allows uniform handling of statistics in systems that span the extremely-low pure-Poisson range up to the usual Gaussian limit. This allows simple aggregation of data from multiple sets, as well as adaptive adjustment of the size of counting bins to maintain statistical significance even in regions of very sparse counts. Although, in general, precision analysis of data sets should be carried out on minimally-preprocessed data, we demonstrate that using rebinning, within reason, does not perturb fitting results and can speed up fits because of the reduced number of data points. The data compression that results from adaptive rebinning may be very useful in building rapidly-searchable catalogs of patterns. This probably has its primary utility in patterns in which strong features are sparsely distributed over a largely featureless background, or data which are oversampled relative to the resolution required to describe the narrowest features.