Introduction
The cotton bollworm, Helicoverpa armigera (Hübner) (Lepidoptera: Noctuidae), is a major pest of cotton (Gossypium hirsutum L.) and several other agricultural crops in various parts of the world, including Australia (Reed & Pawar, Reference Reed, Pawar, Reed and Kumble1982; Fitt & Cotter, Reference Fitt, Cotter and Sharma2004; Wu & Guo, Reference Wu and Guo2005; Brévault et al., Reference Brévault, Nibouche, Achaleke and Carrière2012; Tay et al., Reference Tay, Soria, Walsh, Thomazoni, Silvie, Behere, Anderson and Downes2013). Transgenic (Bt) cotton, which includes toxins derived from the bacterium, Bacillus thuringiensis, has been used since the mid-1990s to control H. armigera (and other lepidopteran pests) and reduce dependence on insecticides (Fitt, Reference Fitt2000, Reference Fitt and Swanepoel2004, Reference Fitt, Romeis, Shelton and Kennedy2008; Shelton et al., Reference Shelton, Zhao and Roush2002; Cattaneo et al., Reference Cattaneo, Yafuso, Schmidt, Huang, Rahman, Olson, Ellers-Kirk, Orr, Marsh, Antilla, Dutilleul and Carrière2006). Some authors, using either trap catches of moths or direct counts of eggs and larvae on plants, have argued that the use of Bt crops (single Bt gene) has not only reduced damage by insect pests, including H. armigera, but also the abundance of the insects at landscape or greater scales (Carrière et al., Reference Carrière, Ellers-Kirk, Sisterson, Antilla, Whitlow, Dennehy and Tabashnik2003; Adamczyk & Hubbard, Reference Adamczyk and Hubbard2006; Wu et al., Reference Wu, Lu, Feng, Jiang and Zhao2008; Hutchison et al., Reference Hutchison, Burkness, Mitchell, Moon, Leslie, Fleisher, Abrahamson, Hamilton, Steffey, Gray, Hellmich, Kaster, Hunt, Wright, Pecinovsky, Rabaey, Flood and Raun2010; Gao et al., Reference Gao, Feng and Wu2010; Wan et al., Reference Wan, Huang, Tabashnik, Huang and Wu2012). However, the risk of Bt resistance arising in these insects, thus negating the pest management successes gained, is of concern in Australia and elsewhere (Fitt, Reference Fitt2000; Fitt & Cotter, Reference Fitt, Cotter and Sharma2004; Mahon et al., Reference Mahon, Olsen, Garsia and Young2007, Reference Mahon, Downes and James2012; Downes et al., Reference Downes, Mahon and Olsen2007, Reference Downes, Parker and Mahon2009, Reference Downes, Mahon, Rossiter, Kauter, Leven, Fitt and Baker2010a , Reference Downes, Parker and Mahon b ; Tabashnik, Reference Tabashnik2008; Tabashnik et al., Reference Tabashnik, Gassmann, Crowder and Carrière2008, Reference Tabashnik, Van Rensburg and Carrière2009, Reference Tabashnik, Brévault and Carrière2013). A rigorous understanding of the ecology of these insects is of course fundamental to establishing an effective Bt resistance strategy in Bt cropping landscapes.
Single Bt gene cotton (Ingard®, with Cry1Ac toxin) was first grown at commercial scale in Australia from 1996 to 2004, followed by two gene Bt cotton (Bollgard II®, with Cry1Ac and Cry2Ab) (2005 to the present time), to control both H. armigera and its close relative the native budworm, Helicoverpa punctigera (Wallengren) (Downes et al., Reference Downes, Mahon, Rossiter, Kauter, Leven, Fitt and Baker2010a ; Maas, Reference Maas2014). Bollgard 3® with Cry1Ac, Cry2Ab and VIP3A) is now planned for commercial release in the 2016/17 summer growing season (Downes & Mahon, Reference Downes and Mahon2012a , Reference Downes and Mahon b ). The use of Ingard® cotton was restricted to 30% of the total cotton crop (by area) in Australia as an industry-driven precautionary measure to limit the emergence of Bt resistance. H. armigera, in particular, had previously developed resistance to several insecticides, and Bt resistance seemed quite possible too (Zalucki et al., Reference Zalucki, Daglish, Firempong and Twine1986; Fitt, Reference Fitt1989, Reference Fitt2000; Forrester et al., Reference Forrester, Cahill, Bird and Layland1993). However, this cap on Bt cotton use was lifted for Bollgard II®, such that approximately 90% of cotton now grown in Australia has Bt genes included (Downes et al., Reference Downes, Mahon, Rossiter, Kauter, Leven, Fitt and Baker2010a ; Downes & Mahon, Reference Downes and Mahon2012a ; Maas, Reference Maas2014).
Additional elements of a Bt Resistance Management Plan (RMP) have been in operation in Australia since 1996. For example, the RMP requires that growers of Bt cotton also sow refuge crops, where there is no Bt exposure for the insects. These crops can be either pigeon pea, Cajanus cajan (L.), or conventional cotton. The number of hectares required for each refuge type is proportional to its capacity to produce moths (Baker et al., Reference Baker, Tann and Fitt2008; Baker & Tann, Reference Baker and Tann2014; Downes et al., Reference Downes, Mahon, Rossiter, Kauter, Leven, Fitt and Baker2010a , Reference Downes, Wilson, Knight, Kauter, Leven, Maas, Ceeney and Redfern2015). The argument is that large numbers of Bt susceptible moths will be produced in the mandatory refuges and mate with moths that emerge from Bt cotton potentially carrying Bt resistance genes, thereby reducing the risk of Bt resistance developing (Bt resistance is recessive) (Roush et al., Reference Roush, Fitt, Forrester, Daly, Zalucki, Drew and White1998; Downes et al., Reference Downes, Mahon, Rossiter, Kauter, Leven, Fitt and Baker2010a ). Bt susceptible moths will also be produced in other non-Bt crops (e.g. sorghum, Sorghum bicolor (L.), maize, Zea mays L., chickpea, Cicer arietinum L.) and native plants growing within the cotton production landscapes, and further afield, that are suitable host plants for H. armigera. These plants (commonly referred to as ‘unstructured’ refuges in the Australian cotton industry) will provide additional support to the resistance management strategy (Downes et al., Reference Downes, Mahon, Rossiter, Kauter, Leven, Fitt and Baker2010a ; Baker & Tann, Reference Baker and Tann2013), but are not formally part of the RMP. Refuge crops, both mandatory and unstructured, will offset any broad-scale reduction that Bt cotton might have on Helicoverpa numbers, but the extent to which this occurs is poorly understood, at least in Australia.
This paper reports the results of continuously monitoring the abundance of H. armigera in a grid of pheromone traps for 23 years (1992–2015) within a cotton (and other crop) production area (approximately 10 km radius) near Narrabri in Northern New South Wales, Australia. The study spanned the advent of both Ingard® and Bollgard II® cotton. The work particularly tested the hypothesis that the introduction of Bt cotton has reduced the abundance of H. armigera at broad-scale in Australia, as it has done elsewhere. However, answers to other questions, such as does local habitat structure influence the catch of H. armigera in individual traps, were also enabled by the work. Pheromone traps were set for H. punctigera, at the same sites reported here for H. armigera. Results for H. punctigera will be published separately (Baker & Tann, Reference Baker and TannIn Press).
Materials and methods
H. armigera moths were caught using a grid of 7–14 Agrisense™ canister pheromone traps, which was maintained continuously within about a 10 km radius near the Australian Cotton Research Institute (ACRI), Narrabri, in Northern New South Wales, Australia from July 1992 to June 2015 (fig. S1; Table S1). The traps were usually emptied weekly, with occasional slight variations in timing due to inclement weather and resultant access difficulties. Lures, specific for H. armigera, were changed monthly, and pesticide strips (dichlorvos) were changed bi-monthly. The traps were mounted on metal poles, approximately 1.5 m above the ground, and adjacent to agricultural fields. The traps only caught male moths. Trap sites were fixed, with the exception of Wire Lagoon/Merinda, which was shifted 500 m in 2010/11, because of ongoing access problems after heavy rainfall. From an initial 7 sites in 1992, the trapping effort was expanded to nine sites in 1994, 11 sites by 1999 and 14 sites by 2009.
Previous work (Baker et al., Reference Baker, Tann and Fitt2011) compared the catches of H. armigera moths, made over a decade, using pheromone and light traps in the vicinity of Narrabri. That work recognized a 1st generation of moths, which was caught between weeks 8 and 20 inclusive (weeks being counted from July 1), a 2nd generation caught between weeks 21 and 30, and 3rd plus additional generations caught between weeks 31 and 44 (referred to as 3rd+ hereafter). We use the same temporal categorization of generations here, except where we highlight individual years and note variations from such a pattern.
The spring and summer crops, that were grown in the two fields nearest to each trap, were recorded each year. These crops mostly included cotton (G. hirsutum L. – transgenic and conventional), soybean (Glycine max Merr.), sorghum (S. bicolor (L.)), wheat (Triticum aestivum L.) or wheat stubble and chickpea (C. arietinum L.). Often, one or both of the fields was in fallow. These were also recorded. In some cases, the trapping sites were bordered, on one side, by land that was not used for cropping (referred to here as verge). Verge was recorded instead of crop if greater in area than the second nearest crop. Verge was variable in nature and included, for example, patches of remnant native vegetation and weedy roadside vegetation. It was commonly used as stock routes.
Rainfall and temperature data were sourced from the Australian Government's Bureau of Meteorology website (http://www.bom.gov.au). Rainfall data were used for Narrabri (Mollee) (meteorological station number 53026; 30°26′S 149°68′E). Initially, temperature data were used for Narrabri at Narrabri West Post Office (station number 53030; 30°34′S 149°76′E), but with the closure of that station in 2002, data were subsequently used from the Narrabri Airport (station number 54038; 30°32′S 149°83′E).
Data for the hectares sown to different crops in the Namoi Valley region throughout 1992–2015 were provided by Neil Clark Business Intelligence (Bendigo, VIC) and Cotton Australia (Sydney, NSW). Many crops are grown in this region, but continuous records are only available for a few that are dominant in the region and of particular relevance as host plants for H. armigera (here we use cotton, sorghum, chickpea and canola, Brassica spp.).
Data analysis
Data were analysed using statistical methods in Statistix® (Statistix 10, Analytical Software; Tallahassee, FL, USA). Methods included general one-way analysis of variance (ANOVA), Multiple and Linear Regression (with data transformed to log (x) or log (x + 1) where appropriate to stabilize variances in the highly variable data), and Pearson's correlation coefficient (r) (with proportional data transformed to arcsine prior to analysis).
Results
Moth generations
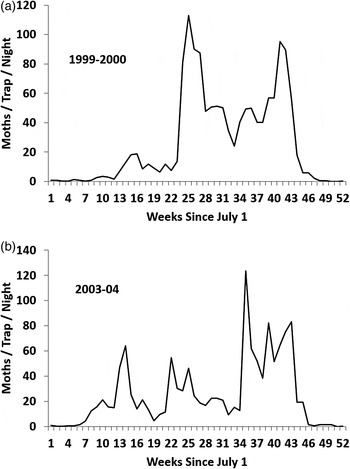
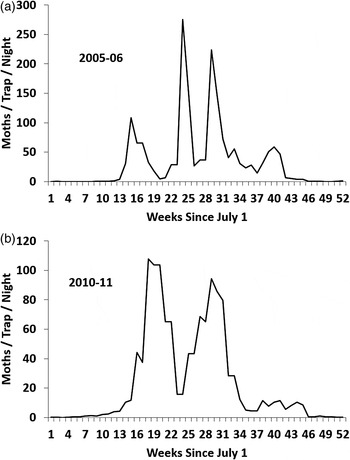
In most years, the 1st, 2nd and 3rd+ generations of moths were reasonably discernible within the timings identified (see Methods section: weeks 8–20, 21–30 and 31–44) (e.g. fig. 1a, b). However, the 3rd and later generations were often difficult to separate, and there was large variability between years in the abundance of moths in each generation. In a minority of years, the 2nd and 3rd+ generations were discrete, but occurred slightly earlier or later than expected (e.g. fig 2a, b; 3rd generation earlier than weeks 31–44; 2nd generation later than weeks 21–30, respectively).
Mean numbers of H. armigera moths caught each week near ACRI throughout (a) 1999–2000 and (b) 2003/04. Weeks are scored from July 1. Note the different scales used on the Y-axes.

Mean numbers of H. armigera moths caught each week near ACRI throughout (a) 2005/06 and (b) 2010/11. Weeks are scored from July 1. Note the different scales used on the Y-axes.

Trap catches in relation to local habitats
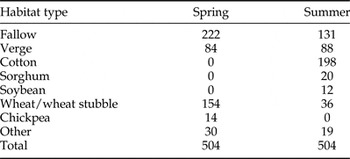
The most common habitats near the pheromone traps were fallow fields, wheat crops and verge during spring, and cotton crops, fallow fields and verge during summer (table 1). Cotton was unusually rare during 2007–2010 and 2014/15 (figs S2 & S3), when lack of assured water for irrigation limited plantings (Dowling, Reference Dowling2015, and earlier volumes in this series).
Frequency scores for habitat types near trapping sites (2 scores for each site, for each of spring and summer, throughout 1992–2015).

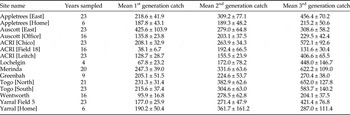
The average numbers of H. armigera moths caught in the pheromone traps set at the 15 separate sites varied markedly within each generation (table 2). However, some of these traps were set for more years than others. Including all such data in an analysis of variability between sites could create temporal bias. When we selected only those traps which were set for all, or very nearly all, years of the study (at least 20 of the 23 years; N = 8) (table 2), the numbers of 1st generation moths varied significantly between the trap sites (General One-Way ANOVA F = 3.35, P < 0.005), but no significant differences in catch could be detected between sites for the 2nd generation moths (F = 1.49, P > 0.05), nor the 3rd+ generation moths (F = 1.96, P > 0.05) (using total catch for each generation at each site in each season as the primary data; data transformed to log x for analysis). Amongst the eight traps which were set for at least 20 years, most 1st generation moths were caught at Auscott (East) and least were caught at ACRI (Leitch) (table 2). There was, however, no correlation between 1st generation moth catch at these eight sites and the overall proportions of local habitat nearby that were either fallow, wheat or verge (proportions based on aggregated data for field use near each site across all years of study (Pearson's r = −0.203, −0.008 and +0.157, P > 0.05 in all cases, for fallow, wheat and verge, respectively).
Trap sites near ACRI, numbers of years sampled and the mean numbers ( ± SE) of H. armigera moths caught at each site each year in the 1st generation (weeks 8–20), 2nd generation (weeks 21–30) and 3rd+ generation (weeks 31–44). GPS coordinates for each site are listed in Table S1.

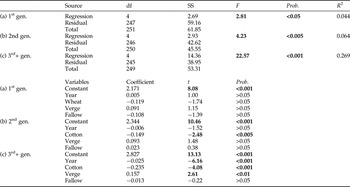
When the data were examined in finer detail (taking the catches of each moth generation and habitat details for each of the 15 traps separately in each year as the primary data), multiple regression analyses demonstrated firstly no effect of year for either 1st or 2nd generation moth catch, but the numbers of 3rd+ generation moths decreased through time (table 3). There was no significant effect of wheat or verge on the catch of 1st generation moths when they were present in at least one of the two fields adjacent to a trap. Cotton was negatively associated with the catch of 2nd and 3rd+ generation moths. Verge was positively associated with the 3rd+ generation catch. No influence of nearby fallow on the catch of H. armigera was observed throughout the study. Very large numbers of 1st generation moths were occasionally caught in the few traps in spring where chickpea was nearby (table 1) (up to 2340 in total in one trap in 2010, mean ± SE = 470.8 ± 180.1; this compares with 210.6 ± 16.1 for traps near wheat). In addition, the average numbers of moths that were caught in the few traps in summer where sorghum and soybean were nearby (table 1) were 218.3 ± 33.0 and 328.5 ± 96.1, for 2nd and 3rd generations respectively for sorghum and 258.9 ± 54.8 and 435.5 ± 128.1, for 2nd and 3rd generations respectively for soybean. These data compare with the 292.6 ± 20.0 and 504.5 ± 35.2 for 2nd and 3rd+ generations respectively caught near cotton.
Multiple regression outcomes from testing for relationships between total trap catches of 1st, 2nd and 3rd+ generations of H. armigera moths and year, as well as concurrent presence of wheat, verge, fallow and cotton in at least one nearby field at Narrabri, New South Wales.

Data transformed to log x + 1 for analysis. Numbers in bold highlight significance. Slight variations in df reflect occasional faulty traps, which had to be ignored.
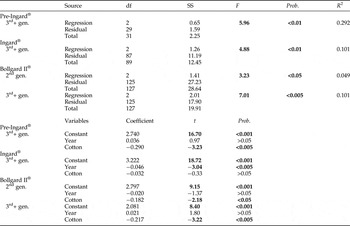
When the data for moth catches at each of the 15 sites were separated in time, into the three cotton production eras, i.e. (1) Pre-Ingard® (1992–1996), (2) Ingard® (1996–2005) and (3) Bollgard II® (2005–2015), negative relationships between moth numbers and the presence of cotton nearby were demonstrated through multiple regression (with year included as a factor) for both 2nd and 3rd+ generations during the Bollgard II® era, but not for either generation during the Ingard® era, and for only the 3rd+ generation during the Pre-Ingard® - era (table 4; data only shown where significant outcomes recorded).
Significant multiple regression outcomes from testing for relationships between total trap catches of 2nd and 3rd+ generations of H. armigera moths during the Pre-Ingard®, Ingard® and Bollgard II® eras and year, as well as the concurrent presence of cotton in at least one nearby field at Narrabri, NSW

Data transformed to log x + 1 for analysis. Numbers in bold highlight significance.
Long-term changes in trap catches at larger scale
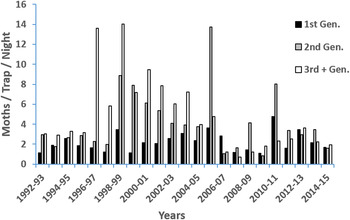
The numbers of moths caught in the traps varied between years (fig. 3) (F = 2.98, P < 0.0001, F = 11.53, P < 0.0001 and F = 12.36, P < 0.0001, for 1st, 2nd and 3rd+ generations, respectively) (total collections of moths at each trap site, within the prescribed time periods, taken as the primary data; data transformed to log x + 1 for analysis). There was, however, no discernible trend through time in the catches of 1st generation moths (e.g. no indication of a decline in numbers with the advent of Bt cotton: Linear Regression : Mean catch of 1st generation = 1.86 + 0.03 × YEAR; R 2 = 0.04, F = 0.97, P > 0.05) (where the average numbers of moths caught/trap/night, i.e. as depicted in fig. 3, were taken as the primary data and years were taken as 1–23). The catches of 2nd generation moths were more erratic (fig. 3), but there was also no temporal trend in the abundance of these moths throughout the study (e.g. Linear Regression : Mean catch of 2nd generation = 4.21–0.005 × YEAR ; R 2 = 0.0001 and F = 0.00, P > 0.05). In contrast, there was an obvious peak in the catches of 3rd+ generation moths between 1996 and 2006 (fig. 3), i.e. during the Ingard® cotton era (F = 17.67, P < 0.0001, where the mean catches each year, as displayed in fig. 3, were taken as the primary data and grouped into each of the three cotton eras; Tukey's comparison of means test indicated the catch during the Ingard® era was higher than in the other eras, Q = 3.58, P < 0.05).
Pheromone trap catches of male H. armigera moths near ACRI throughout 1992–2015. Data are separated into moths in the 1st generation (caught during weeks 8–20), 2nd generation (weeks 21–30) and 3rd+ generations (weeks 31–44), with weeks taken from 1 July.

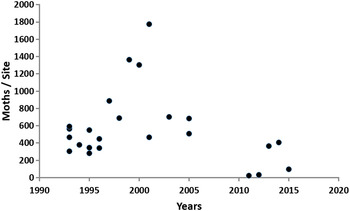
Evidence for temporal trends in moth catches was also sought where local habitat was the same for all traps. We used data associated with fallow fields in spring and cotton fields in summer, because they were the most common land usages at these times. There were 36 cases throughout the 23 years of study when the two fields near to individual traps were both fallow during spring, and 24 cases where both fields were used for cotton during summer. No temporal change was found in the abundance of 1st generation moths in the traps near fallow fields in spring, e.g. using linear regression (total catches of each generation of moths for each year in each of these traps used as primary data) (Catch of 1st Generation = 1.79 + 0.02 × YEAR; R 2 = 0.10, F = 3.68, P > 0.05; data transformed to log × for analysis), nor was there for the 2nd generation moths near cotton in summer (Catch of 2nd Generation = 2.50–0.019 × YEAR; R 2 = 0.15, F = 3.85, P > 0.05). However, there was significant pattern amongst the catches of 3rd+ generation moths near cotton in summer (fig. 4) (F = 16.34, P < 0.0001; again grouping the primary data as displayed in fig. 4, transformed to log x + 1, into the three cotton eras). Tukey's comparison of means test indicated no statistical difference between the catches during the Pre-Ingard® and Ingard® eras, but both of these were higher than the catch during the Bollgard II® era (Q = 3.57, P < 0.05).
Total numbers of 3rd+ generation H. armigera moths trapped at individual sites near ACRI between 1993 and 2015, where cotton was being grown in the two nearby fields.

In addition, the average numbers of 1st and 2nd generation moths caught in the traps were positively correlated (Pearson's r = 0.536, P < 0.01), but such was not the case between 2nd and 3rd+ generation moths (r = 0.368, P > 0.05), nor between 1st and 3rd+ generation moths (r = 0.136, P > 0.05) (where data for all years and traps were included, but data for years were treated separately, thus N = 23). In contrast, there was no correlation between the average numbers of 1st and 2nd generation moths caught in the traps (r = 0.501, P > 0.05), 2nd and 3rd+ generation moths (r = 0.505, P > 0.05) or 1st and 3rd+ generation moths (r = 0.331, P > 0.05) (where data for all years and traps were again included, but data for sites were treated separately; thus N = 15). Thus analysing the data in a temporal context (across years, N = 23) yielded a slightly different result than analysing it in a spatial context (across sites, N = 15). There was no correlation between the catch of 3rd+ generation moths in one year and the number of 1st generation moths in the next (r = − 0.162, P > 0.05).
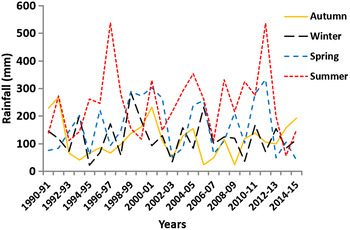
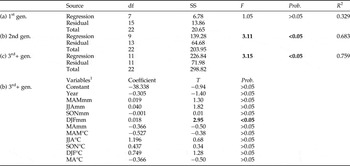
Rainfall varied greatly between years at Narrabri and was particularly high during the summers of 1996–1997 and 2011/12 (fig. 5), but there were no significant associations, detected by multiple regression, between local rainfalls and average trap catches of 1st and 2nd generation moths each year (fig. 3), where rainfalls were calculated (as relevant for the particular moth generations) for the (1) preceding autumn (March–May inclusive), (2) preceding winter (June–August), (3) spring (September–November), (4) summer (December–February) and finally (5) autumn at the end of the cotton season (March and April) (1–3 deemed appropriate for 1st gen., 1–4 for 2nd gen. and 1–5 for 3rd+ gen.) (table 5). However, a significant, but weak, positive association was found between summer rainfall and the catch of 3rd+ generation moths (table 5). For all three generational groupings, rainfall variables were analysed along with year as an additional factor.
Rainfalls (mm) recorded at Narrabri (Mollee) (Australian Bureau of Meteorology Station No: 53026). Data are provided for the autumn (March, April, May) and winter (June, July, August) preceding the moth activity season, spring (September, October, November) at the start of the moth activity season, and summer (December, January, February) at the end of the activity season. On a few occasions, when data were not available for this meteorological station, equivalent data were used from records at Narrabri Airport (Station No: 54308).

Multiple regression outcomes from testing for relationships between average trap catches of 1st, 2nd and 3rd+ generations of H. armigera moths and year, total rainfall (mm) and average maximum temperature (°C) at Narrabri, NSW from 1992 to 2015.

Numbers in bold highlight significance. Details for variables only provided where at least one was significant.
1 MAMmm = preceding autumn rainfall, JJAmm = preceding winter rainfall, SONmm = preceding spring rainfall, DJFmm = prevailing summer rainfall, MAmm = prevailing autumn rainfall; MAM°C = preceding autumn temperature, JJA°C = preceding winter temperature, SON°C = preceding spring temperature, DJF°C = prevailing summer temperature, MA°C = prevailing autumn temperature.
On the other hand, air temperatures at Narrabri varied little across the two decades of observation (fig. S4). The most notable extremes were a relatively cool season (spring–summer) in 2011/12 (mean maximum air temperature = 28.1°C) and a relatively warm season in 2013/14 (32.5°C). No significant associations were detected between temperatures and any generation of moths, using the same seasonal groupings as mentioned above for rainfall (table 5). That is not to say that trap catches and weather at finer temporal scales (e.g. weekly) were not related (such data not presented here).
Peak collections of individual generations were frequently too vague (e.g. fig. 1b) to enable analysis of the timings of generations in association with prevailing weather. It is worth noting however that in some seasons an apparent earliness was associated with warmer than average summer temperatures (e.g. 3rd generation in 2005/06) and an apparent lateness with colder than average winter temperatures (e.g. 1st and 2nd generations in 2010/11).
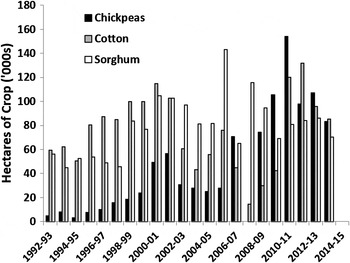
The areas (ha) sown to chickpea and canola (spring crops) and cotton and sorghum (summer crops) in the Narrabri, Gunnedah, Liverpool Plains and Walgett Statistical Local Areas (SLAs) within northern NSW (which surround the trapping grid near ACRI) varied markedly throughout 1992–2014 (fig 6, figs S5 & S6). Cotton hectares peaked between 1999 and 2002 and again in 2011–2013. Sorghum hectares were greater than cotton during the intervening years (2003–2010), when water for irrigation was less assured for farmers. Chickpea and canola hectares steadily increased throughout the study period. Cropping patterns were quite different between SLAs. Supplementary figs S5 & S6 illustrate this for the Narrabri and Gunnedah SLAs, where the greater predominance of cotton in the Narrabri SLA and sorghum in the Gunnedah SLA are evident, as is the differential use of chickpea and canola as spring crops in the two regions.
Hectares of chickpea, cotton and sorghum grown annually (1992–2015) in the Narrabri, Gunnedah, Liverpool Plains (Quirindi) and Walgett SLA (summed) of NSW. Data provided by Neil Clark Business Intelligence. No data were available for chickpeas in 2007/08, and canola is not included here because no data were available for several years in the SLA.

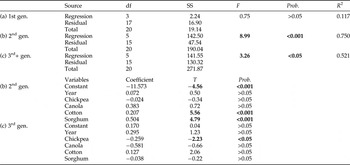
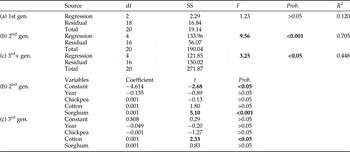
There were no significant associations, detected by multiple regression, between the catch of 1st generation moths (fig. 3) and the hectares of chickpea and canola grown in the Narrabri SLA, which immediately surrounded the ACRI trapping grid (data analysed along with year as an additional factor) (table 6). However, there were positive associations detected between the numbers of 2nd generation moths and the hectares of cotton and sorghum, and a negative association between the numbers of 3rd+ generation moths and hectares of chickpea (table 6).
Multiple regression outcomes from testing for relationships between average trap catches of 1st, 2nd and 3rd+ generations of H. armigera moths and year and annual total hectares of crops grown throughout the Narrabri SLA from 1992 to 2014.

Numbers in bold highlight significance. Details for variables only provided where overall regression was significant.
At a broader scale (the combined Narrabri and adjacent Gunnedah, Liverpool Plains and Walgett SLAs), there was no association between the catch of 1st generation moths and the hectares used for chickpea crops (table 7) (canola could not be tested for here, because data were unavailable for the Walgett SLA). There were, however, positive associations between the catch of 2nd generation moths and hectares of sorghum, and between the catch of 3rd+ generation moths and hectares of cotton (table 7).
Multiple regression outcomes from testing for relationships between average trap catches of 1st, 2nd and 3rd+ generations of H. armigera moths and year and annual total hectares of crops grown throughout the Narrabri, Gunnedah, Liverpool Plains and Walgett SLA from 1992 to 2014.

Numbers in bold highlight significance. Details for variables only provided where overall regression was significant.
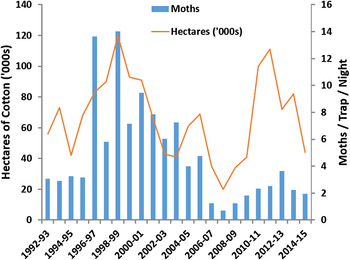
Cotton Australia (C.A.) maintains an alternative database for cotton production, in particular for the Namoi Valley. This region (which combines two sub-regions, the Upper and Lower Namoi Valleys) is slightly different from the four SLAs (in total) listed above. In the C.A. database (which contained data for one more year, 2014/15), the area (ha) sown to cotton in the Namoi Valley peaked in 1998–1999 and 2011/12, with a trough in 2008, which corresponded with the end of the drought in the region (fig. 7). The relationship between the numbers of 3rd+ generation moths and the hectares of cotton grown was stronger during the Pre-Ingard® and Ingard® eras (up to 2005) (r = 0.627, P < 0.05, N = 13) compared with during the Bollgard II® era (post 2005) (r = 0.551, P > 0.05, N = 10).
Numbers of 3rd+ generation H. armigera moths trapped each year near ACRI and hectares of cotton sown in the Namoi Valley from 1992 to 20015. Cotton data provided by Cotton Australia.

Discussion
Previous research in the USA and China (Carrière et al., Reference Carrière, Ellers-Kirk, Sisterson, Antilla, Whitlow, Dennehy and Tabashnik2003; Wu et al., Reference Wu, Lu, Feng, Jiang and Zhao2008; Gao et al., Reference Gao, Feng and Wu2010; Wan et al., Reference Wan, Huang, Tabashnik, Huang and Wu2012) has shown that the abundance of both the pink bollworm, Pectinophora gossypiella, and H. armigera, which has a broader host range than P gossypiella, can be suppressed at landscape and greater scale by the planting of single Bt (Cry1Ac) gene cotton. However, in Eastern Australia, such patterns did not occur; indeed, the abundance of H. armigera across the trapping grid established near Narrabri increased during the deployment of single gene, Ingard®= cotton (1996–2004). But in the following years, with the introduction of two Bt gene cotton, Bollgard II®, a decrease in abundance does appear to have occurred, at least in the moth generations at the end of the summer growing season. There were far fewer of these moths trapped in recent years than would have been expected, given the large amount of cotton grown.
Carrière et al. (Reference Carrière, Ellers-Kirk, Sisterson, Antilla, Whitlow, Dennehy and Tabashnik2003) and Wan et al. (Reference Wan, Huang, Tabashnik, Huang and Wu2012) suggested that approximately 65% of the total cotton crop needs to be Bt in order to suppress numbers of P. gossypiella at broad spatial scale in the USA and China. In Australia, Ingard® cotton was capped at 30% of the total cotton crop, but Bollgard II® cotton was not, and Bt cotton quickly expanded to include nearly all cotton planted (Downes & Mahon, Reference Downes and Mahon2012a ; Wilson et al., Reference Wilson, Downes, Khan, Whitehouse, Baker, Grundy and Maas2013). The delayed reduction of insect numbers in Australia is therefore crudely in line with what was predicted for P. gossypiella. In addition, poor expression of the Cry1Ac gene in late season Ingard® cotton has been reported (Fitt, Reference Fitt2000; Olsen et al., Reference Olsen, Daly, Holt and Finnegan2005). Better expression of the second gene, Cry2Ab, throughout the season in Bollgard II® cotton (Greenplate et al., Reference Greenplate, Mullins, Penn, Dahm, Reich, Osborn, Rahn, Ruschke and Shappley2003) also provided a more effective product for insect control. Furthermore, natural enemies of Helicoverpa have increased in recent years, presumably in response to the reduced use of broad spectrum insecticides within cotton production regions (e.g. pupal parasitoids, Baker & Tann, Reference Baker and Tann2014), thus providing yet another pest suppressive mechanism. Sprays of nuclear polyhedrosis virus products for the control of Helicoverpa have also become much more common in recent years within mixed cropping landscapes in Eastern Australia, both in spring and summer, e.g. on sorghum, chickpea, canola and maize (Anthony Hawes, AgBiTech, Toowoomba, QLD, pers. commun., 2015). Such a trend could also contribute to the observed broad-scale suppression of H. armigera numbers. Overall, the numbers of moths in all generations of H. armigera are now comparable with what they were in the 1990s prior to the advent of Bt cotton, when much greater amounts of insecticide were being used in cotton landscapes (Fitt & Cotter, Reference Fitt, Cotter and Sharma2004; Wilson et al., Reference Wilson, Downes, Khan, Whitehouse, Baker, Grundy and Maas2013).
Analysis of catch data at the level of individual traps illustrated the effect nearby habitat types could have on moth numbers, and complimented patterns observed at greater spatial scales. In particular, when the data were partitioned into the different cotton eras, a negative association was demonstrated between the numbers of 2nd and 3rd+ generation moths and the presence of cotton nearby during the Bollgard II® era, but such was not the case during the Ingard® era. A negative association was also found between 3rd+ generation moths and cotton nearby during the Pre-Ingard® era. Perhaps the latter was a response to the heavy insecticide use in cotton crops at that time. Whether or not Bollgard II® is simply acting as a population sink or it has also become less attractive to moths than before, thus further reducing the local moth catch, remains unclear. However, Zalucki et al. (Reference Zalucki, Cunningham, Downes, Ward, Lange, Meissle, Schellhorn and Zalucki2012) have argued, from laboratory studies at least, that there has been no shift in the attractiveness of cotton to H. armigera for oviposition since the advent of Bt cotton in Australia.
As a whole, the numbers of 3rd+ generation (and to a lesser extent 2nd generation) H. armigera moths caught in pheromone traps near Narrabri throughout the study were positively associated with the amount of cotton grown in the surrounding region. In addition, the numbers of 2nd generation (but not 3rd+ generation) moths were positively associated with the amount of sorghum grown throughout the study. No associations with cropping levels were apparent for 1st generation moths. The flowers of a variety of crop plants, including cotton and sorghum, are particularly attractive to Helicoverpa spp. for oviposition (Zalucki et al., Reference Zalucki, Daglish, Firempong and Twine1986; Firempong & Zalucki, Reference Firempong and Zalucki1990; Fitt & Cotter, Reference Fitt, Cotter and Sharma2004). H. armigera prefers to oviposit on sorghum relative to cotton (Fitt, Reference Fitt1989; Jallow & Zalucki, Reference Jallow and Zalucki1996), but cotton is attractive to H. armigera for much longer in the field than sorghum, the attractiveness of the latter host only being able to support a single moth generation (Fitt & Cotter, Reference Fitt, Cotter and Sharma2004). Whilst variation in sowing dates, and hence flowering times, could complicate matters, these differences in attractiveness of the two crops may be sufficient to explain the observed associations between 2nd generation moths and sorghum availability and 3rd+ generation moths and cotton, at the landscape scale.
In the years before transgenic cotton, Wardhaugh et al. (Reference Wardhaugh, Room and Greenup1980), Wilson (Reference Wilson1983) and Fitt (Reference Fitt1989) considered sorghum particularly important in generating dense populations of H. armigera within landscapes near Narrabri, in part because of its high carrying capacity for the pest and infrequent insecticide applications. They suggested that sorghum provided an important source of H. armigera which could subsequently infest nearby cotton crops. However, Maelzer & Zalucki (Reference Maelzer and Zalucki1999) obtained negative relationships between the numbers of both 2nd and 3rd generation H. armigera moths caught in light traps set at ACRI during the 1970s and 1980s and the amount of sorghum grown nearby (in contrast they found positive correlations for maize and lucerne, but provided no information for cotton). Maelzer & Zalucki (Reference Maelzer and Zalucki1999) suggested their negative result for sorghum could have been due either to heavy insecticide use or high mortality due to disease. Our result, a positive link between sorghum hectares and the numbers of 2nd generation moths, is more in line with the early authors (unfortunately our database was inadequate to test for associations between moth numbers and hectares of maize and lucerne).
There was only limited indication that the numbers of moths in consecutive generations within seasons were correlated, and thus poor predictive power of what was to come. This was in contrast to Maelzer & Zalucki (Reference Maelzer and Zalucki1999) who were able to show a clear positive relationship between the 1st and 2nd generations using light traps set at ACRI during the 1970s and 1980s. Presumably, variations in survival (related to e.g. natural enemies, weather, insecticide use and plant host availability) disrupted such associations in our case. There was also no correlation between the late generations of moths in one season and the early generation in the next (Maelzer & Zalucki, Reference Maelzer and Zalucki1999 found likewise). Baker & Tann (Reference Baker and TannIn Press) did, however, report a significant correlation between the numbers of 3rd+ generation moths caught in one season and the numbers of 1st generation moths caught in the next season for H. punctigera near Narrabri. Baker & Tann (Reference Baker and TannIn Press) suggested that the correlation for H. punctigera could indicate local overwintering, which has historically been thought unlikely. H. armigera clearly overwinters in the cropping region (Wilson et al., Reference Wilson, Lewis and Cunningham1979; Fitt & Daly, Reference Fitt and Daly1990). Perhaps the movement of H. armigera moths into the Narrabri region in spring and/or the movement of moths out of the region in late summer are large enough to mask evidence of overwintering being displayed via inter-seasonal correlations.
Maelzer & Zalucki (Reference Maelzer and Zalucki1999) reported positive associations between preceding winter rainfall and the abundance of H. armigera moths in light traps at Narrabri. They suggested such rainfall probably enhanced the growth of H. armigera’s early season host plants. Maelzer & Zalucki (Reference Maelzer and Zalucki1999) also reported negative relationships between spring rainfall and subsequent moth catches. In a separate paper, Maelzer et al. (Reference Maelzer, Zalucki and Laughlin1996) suggested that heavy spring rainfall could dislodge eggs and larvae of H. punctigera from host plants, somewhat in contrast to the finding of Fitt et al. (Reference Fitt, Gregg, Zalucki and Twine1990) that dry spring weather reduced the abundance of Helicoverpa. However, we were only able to demonstrate a positive relationship between summer rainfall and the abundance of 3rd+ generation moths. The difference between our results re rainfall effects and those of Maelzer & Zalucki (Reference Maelzer and Zalucki1999) might be explained, at least in part, by the range in weather experienced during the two studies. Unlike in our study, and that of Fitt et al. (Reference Fitt, Gregg, Zalucki and Twine1990), Maelzer et al. (Reference Maelzer, Zalucki and Laughlin1996) and Maelzer & Zalucki (Reference Maelzer and Zalucki1999) worked with data that did not include any drought years.
The numbers of 2nd generation moth catches were unusually high in 2005/06 and 2010/11. These exceptions can, at least in part, be explained by an earlier than usual occurrence of 3rd+ generation moths in 2005/06 (thus some 3rd + moths were scored within weeks 21–30 that year) and a later than usual occurrence of 1st generation moths in 2010/11 (similarly scored within weeks 21–30) (fig. 2). Reasons for such generational drift are not clear, but spring temperatures in 2010 were the coldest recorded during the study. Such could perhaps help explain the slower development of H. armigera that year. An alternative explanation might lie in the influence of sorghum on the landscape. This crop can occasionally produce vast numbers of H. armigera (Fitt, Reference Fitt1989; Baker et al., Reference Baker, Tann and Fitt2008). Many sorghum crops were grown in the broader region surrounding the trapping grid during 2005/06 (fig 6 & fig. S5). Chickpea was also particularly common in the spring of 2010/11, which may have also enhanced numbers then.
Zalucki (Reference Zalucki2015) suggested that it is difficult to demonstrate temporal trends in the abundance/pest status of H. armigera and H. punctigera because their seasonal dynamics are complex, driven by combinations of weather factors, migration and various crop types and their management. Our 23-year study of the numbers of H. armigera in pheromone traps, and a concurrent monitoring of H. punctigera (Baker & Tann, Reference Baker and TannIn Press) identified some major temporal changes in abundance and provided further insight into the influences of weather and cropping influences on the two species. Zalucki (Reference Zalucki2015) combined the abundance of H. armigera and H. punctigera (recorded in light traps at ACRI) in his paper, which creates extra confusion. H. armigera and H. punctigera have very different ecologies, which Zalucki (Reference Zalucki2015) noted. The former species is mostly confined to the eastern cropping regions of Australia, whilst the latter is recruited more each spring from inland desert regions (Fitt & Cotter, Reference Fitt, Cotter and Sharma2004). The dynamics of H. armigera and H. punctigera can change in quite different ways and need to be treated separately. For example, whilst the numbers of H. armigera surged in the pheromone traps at the start of the Ingard® era (this study), those of H. punctigera did not (Baker & Tann, Reference Baker and TannIn Press).
Zalucki & Furlong (Reference Zalucki and Furlong2005) and Zalucki (Reference Zalucki2015) also suggested that the advent of Bt cotton may have reduced the abundance of Helicoverpa spp. at landscape scale in the Namoi Valley, as evidenced by reduced insecticide use and resultant increases in natural enemy numbers, but they noted that such coincided with a decline in climatic suitability (most notably rainfall) during the Bt cotton era they considered (for 1996–2002). These concurrent drivers of Helicoverpa spp. abundance thus confounded conclusions that these previous authors could draw. Our study monitored the numbers of Helicoverpa spp. throughout a longer period of time, including trap catches set after recent drought when cotton rebounded (albeit temporarily!) and pre 1996, i.e. before the advent of Bt cotton, thus enabling recognition of initial responses to the transgenic crop.
Supplementary material
The supplementary material for this article can be found at http://dx.doi.org/10.1017/S0007485316000912
Acknowledgements
The work was funded by research grants from the Cotton Research and Development Corporation, Australia. The authors would like to thank Sarina Macfadyen for helpful comments on a draft manuscript, and Melinda Haley (Neil Clark Business Intelligence), Greg Kauter and Nicola Cottee (Cotton Australia) for providing data on crop plantings. The authors particularly thank Gary Fitt for establishing the trapping grid upon which we built.