Introduction
Poor intrauterine growth is associated with increased risk of metabolic and cardiovascular disease later in life;Reference Fall, Osmond and Barker 1 – Reference Curhan, Chertow and Willett 4 accelerated growth during childhood amplifies these risks.Reference Eriksson, Forsen, Tuomilehto, Osmond and Barker 5 , Reference Barker, Bull, Osmond and Simmonds 6 One potentially powerful amplifier is excess adiposity, which often accompanies the accelerated growth following early growth restriction and which mediates disease via multiple pathways.Reference de Ferranti and Mozaffarian 7 Obesity reduces protein and transcript levels of adiponectin,Reference Arita, Kihara and Ouchi 8 , Reference Engeli, Feldpausch and Gorzelniak 9 a powerful adipokine known to enhance insulin sensitivity and fat oxidation as well as to counteract inflammatory and oxidative stressors. Leptin dysregulation in obese states includes resistance to leptin's central appetite suppressing actions while mediating obesity-related central sympathetic activation with attendant adverse cardiovascular impacts.Reference Kalil and Haynes 10 Increased macrophage infiltration into adipose tissue (AT), with systemic release of proinflammatory adipokines [e.g., tumor necrosis factor (TNF) α, ILReference Barker, Bull, Osmond and Simmonds 6 ], promote generalized tissue inflammation and cardiovascular injury.Reference Weisberg, McCann and Desai 11 Lastly, the obese state is characterized by increased lipolysis in intra-abdominal adipose tissue (ABD-AT), setting off a cascade of elevated circulating free fatty acids, multi-organ lipid overload and secondary metabolic impairments that include hepatic and skeletal muscle insulin resistance.Reference Gallagher, Leroith and Karnieli 12
A second proposed pathway for developmentally linked increase in cardiometabolic risk in later life is programmed dysregulation of glucocorticoid homeostasis, which may also reduce insulin sensitivity and impair cardiovascular function through the adverse actions of cortisol (see reviews: ClarkReference Clark 13 and ReynoldsReference Reynolds 14 ).
In a recent paper in this journal, we describe growth patterns and body composition of microswine offspring exposed to perinatal maternal protein restriction (MPR).Reference DuPriest, Kupfer and Lin 15 Pregnant sows were randomized to either 14% protein (control normal protein) or 1% protein (low protein) diets during the last quarter of gestation and first 2 weeks of lactation. The postnatal diet extension of MPR encompasses the major period of adipogenesis in swine, which occurs later in pigs than in more precocial species. Born with only ∼1–2% body fat, piglets require 4 weeks to accrue the 12–15% fat present in human newborns.Reference Widdowson 16 – Reference Manners and McCrea 18 Piglets were weaned at 4 weeks of age to normal growth chow, and followed serially to 3–5 months of age. We foundReference DuPriest, Kupfer and Lin 15 that low-protein offspring (LPO) have reduced fetal and early postnatal growth rates, followed by accelerated prepubertal body growth: accelerated in absolute terms for length (cm/week) but only in relative terms for weight (g/kg body weight/week). By dual-energy X-ray absorptiometry (DEXA) scan at 11 weeks of age (late in the accelerated growth phase), LPO had low-normal % body fat and frankly low body fat:length ratio, while lean tissue was more effectively preserved. Overall, LPO at 11 weeks remained thin (low weight:length) as a result of the accelerated linear growth together with normal absolute gain of both fat and lean tissue mass during prepubertal development. Despite absence of obesity in LPO by every measure, the seven-fold increase in fat mass from 6 to 11 weeks of age in LPO significantly exceeded the five-fold increase in controls. We hypothesized that, even in the absence of overt obesity, the relatively rapid accrual of AT during prepubertal growth could have long-lasting metabolic effects mimicking obesity.
In the present study, we thus asked whether the rapid accrual of fat tissue during prepubertal development might mimic the known effects of diet-induced or genetic forms of obesity on adipocyte structure and function, despite the absence of AT excess. These effects include adipocyte hypertrophy, hyperleptinemia, hypoadiponectinemia with reduced adiponectin gene expression and elevated markers of inflammation (see reviews: de Ferranti and MozaffarinReference de Ferranti and Mozaffarian 7 and Engeli et al.Reference Engeli, Feldpausch and Gorzelniak 9 ). Therefore, we tested adipocyte size, AT gene expression (adiponectin and TNF-α), circulating leptin levels and glucose homeostasis in the same offspring described in the recent study. Additionally, we tested whether alterations in the glucocorticoid system were present. Our results demonstrate sex-specific alterations of adipocyte structure, function and adipokine regulation in these non-obese juvenile microswine offspring exposed to perinatal MPR-induced asymmetric growth restriction followed by accelerated prepubertal growth.
Methods
Ethical approval
Experiments were approved by the OHSU Institutional Animal Care and Use Committee under protocol no. A439 (June 2005). Requirements to justify utilization of animal models were fully met and approved; efforts to reduce animal numbers and to refine procedures to minimize pain and distress were also described in detail and approved.
Animal care and experimental design
The data described in this study were derived from the same animals described in a recent paper in this journal,Reference DuPriest, Kupfer and Lin 15 as well as in several other studies.Reference Denisenko, Lin and Louey 19 – Reference DuPriest, Kupfer and Lin 21 Brief general methods and those specific to this study are reported here; for details, see the recent paper.
Time-bred Yucatan microswine sows were maintained from gestation day (GD) 80 out of 113 in the OHSU Animal Care Facility under standardized humidity and temperature, and a 12:12 h light:dark cycle. Pregnant sows were randomized to either a control diet (14% protein/75% carbohydrate) or an isocaloric low-protein diet (1% protein/88% carbohydrate) applied during the last fourth of gestation plus 2 weeks postnatally. At 2 weeks, all sows were returned to a normal diet. Offspring to be studied as juveniles were weaned at 4 weeks to a standard, commercially available juvenile piglet ‘grower’ diet (Purina Mills Lab Porcine Diet Grower; 20% w/w protein, 4% w/w fat, the latter representing 8.6% of calories). Separate litters were generated in the same manner with offspring sacrificed at near-term fetal (GD 113 out of 115) or neonatal (2 weeks postnatal) stages for study of selected outcomes, including plasma cortisol, leptin, insulin and glucose levels. All viable, non-runted piglets were used in this study; there were no differences in number of offspring per litter or sex ratios of offspring based on maternal diet (for details, see DuPriest et al.Reference DuPriest, Kupfer and Lin 15 ). N varies by assay due to technical reasons; these are listed in tables and figure legends as appropriate.
Tissue, plasma and urine collection
Juvenile piglets [n = 16 normal-protein offspring (NPO; 9 males, 7 females), n = 17 LPO (10 males, 7 females); 4 NPO litters, 5 LPO litters] were placed in metabolic cages for 48 h at age 11–12 weeks. Urine collected from 24 to 48 h was centrifuged to clear debris and the cleared urine stored at −20°C until use. Over 14–22 weeks of age, sets of four juveniles each underwent a 3-week study protocol including placement of venous catheters under isoflurane anesthesia (2.0–2.5% isoflurane, occasionally up to 3.0% during the first minutes of induction, with an oxygen flow rate of 2.0 l/min) and collection of venous blood in ethylenediaminetetraacetic acid (EDTA) or sodium heparin from conscious pigs; plasma was stored at −80°C until analysis. After 1–2 weeks recovery, organs, plasma and tissues were harvested under isoflurane anesthesia. Subcutaneous adipose tissue (SC-AT) from the ventral abdomen and ABD-AT from the lateral interior abdominal wall were quickly harvested, snap-frozen in liquid nitrogen, and stored at −80°C until use. Separate aliquots of ATs were fixed in formalin, then paraffin embedded. Neonatal offspring studied at 2–3 weeks of age underwent a similar procedure for blood collection; since pigs develop AT primarily postnatally, AT was too sparse to collect in NPO and LPO neonates.Reference Widdowson 16 , Reference Widdowson 17
To obtain samples from near-term fetal animals, pregnant sows at 113 days of gestation were anesthetized by inhaled isoflurane (dose as described above). Piglets were delivered by Cesarean section one at a time and quickly sacrificed by exsanguination via cardiac puncture. Blood was collected into EDTA- or heparin-containing tubes, or without anticoagulant as described above. As with neonates, AT was insufficient for sampling in fetal piglets.
Adipocyte size measurements
Two randomly selected formalin-fixed paraffin-embedded ABD-AT blocks and two SC-AT blocks from each animal were cut in 5-μm sections and two non-adjacent slides per block were then stained with hematoxylin. Digital images were captured from a random field in each of four quadrants per section using a Leica microscope with 20× objective and charge coupled device camera. Images were analyzed using Image-Pro Plus (Media Cybernetics, Silver Spring, MD, USA) software. Cell areas (μm2) were measured and averaged for each section; section averages were then averaged within blocks, then across blocks to obtain a single average for each fat depot per animal. All analysis procedures were performed by an individual blinded to the maternal diet and sex of the animal.
Plasma analysis
The Coat-A-Count Cortisol RIA kit (Siemens Medical Solutions Diagnostics, Los Angeles, CA, USA) was used to assay plasma (sodium heparin) and urine cortisol in juvenile offspring. Cortisol was extracted from urine samples with dichloromethane prior to assay according to kit instructions. For urine samples, concentrations were multiplied by 24-h volume to yield excretion rate in nmol per day. Urine excretion rates were normalized to lean body mass at 11 weeks. Within-assay coefficient of variability (CV) was 2.45% and between-assay CV was 4.24%. The assay is highly specific for cortisol, with only 0.98% cross-reactivity with cortisone according to kit manual (the assay does cross-react with prednisolone, but this is relevant only in patients given this therapy); the assay range is 27.6–1380 nmol/l, and linearity in the assay range exceeds 92% in all measurements provided by the manufacturer.
Plasma samples collected in EDTA and obtained under anesthesia were analyzed for leptin concentration using the Multi-Species Leptin Radioimmunoassay Kit (Millipore, Inc., Billerica, MA, USA; formerly Linco Research, St Charles, MO, USA) according to the kit instructions; values are reported in human equivalents (HE). Intra-assay CV was 6.5%; interassay CV was 5.8%. The specificity of the assay for porcine leptin is 67% (compared with 100% for human leptin with the same kit) according to manufacturer; the assay range is 1.0–50 ng/ml HE, and linearity in the assay range exceeds 94% in all measurements provided by the manufacturer.
Heparinized plasma samples were analyzed for insulin concentration using the Porcine Insulin RIA kit (Millipore, Inc; formerly Linco Research; used for juvenile offspring) or Human Insulin Specific RIA kit (Millipore, Inc., used for near-term fetal and 2-week neonatal offspring) according to kit instructions. Intra-assay CV for Porcine Insulin RIA was 9.7%; all measurements were performed in a single assay. Intra-assay CV for Human Insulin RIA was 2.4%; all measurements were performed in a single assay. The specificity of both assays was 100% according to the manufacturer; assay ranges were from 2 to 200 μU/ml; linearity in the assay range exceeded 86%. Insulin values were Ln transformed prior to analysis. Quantitative insulin sensitivity check index (QUICKI) values were calculated as 1/[(log fasting plasma insulin) + (log fasting plasma glucose)].Reference Katz, Nambi and Mather 22 Plasma glucose samples were measured by the OHSU Clinical Lab.
Real-time polymerase chain reaction (PCR)
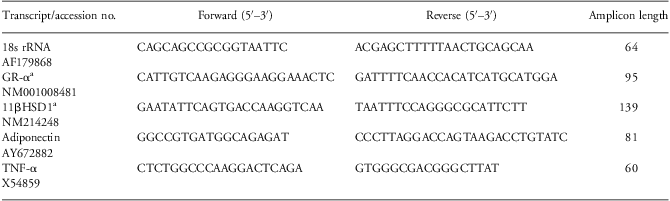
Snap-frozen tissue samples were homogenized in TRIzol (Invitrogen Corporation, Carlsbad, CA, USA), and total ribonucleic acid (RNA) was extracted according to manufacturer instructions. RNA was treated with DNase I (Invitrogen), then reversed transcribed using random hexamer primers (Operon Biotechnologies, Huntsville, AL, USA) and SuperScript II reverse transcriptase (Invitrogen). Resulting cDNA was analyzed in triplicate using the SYBR Green method. Gene-specific primers to swine adiponectin, TNF-α and 18s ribosomal ribonucleic acid (rRNA) were designed using Primer Express software (Applied Biosystems, Foster City, CA, USA). Primers for glucocorticoid receptor (GR)-α and 11β hydroxysteroid dehydrogenase (HSD1) were adapted for swine, based on those used in human studies.Reference Wake, Rask and Livingstone 23 All primers were synthesized by Operon Biotechnologies; see Table 1 for sequences. All amplicon identities were confirmed by visualizing appropriately sized single bands on agarose gels and also by cloning into pGEM-T-Easy vector via cloning system I Kit (Promega) and sequencing using SP6 primer. Amplification reactions were run on an ABI Prism 7500 (Applied Biosystems) with the following protocol: 50°C for 2 min, 95°C for 10 min, then 40 cycles of 90°C for 15 s and 60°C for 60 s. Relative gene expression was calculated by the standard curve method using serial dilutions of a pool of a large subset of samples, and normalized to endogenous controls (18s rRNA). Ct values of 18s rRNA per microgram of RNA were not affected by maternal diet in juvenile offspring (3–5 months).
Real-time PCR primer sequences

PCR, polymerase chain reaction; rRNA, ribosomal ribonucleic acid; GR, glucocorticoid receptor; HSD, hydroxysteroid dehydrogenase; TNF, tumor necrosis factor.
aPrimer sequences for GR-α and 11βHSD1 were adapted for the pig from previously described human primers.Reference Wake, Rask and Livingstone 23
Statistical methods
For each parameter in juveniles, covariates were identified by stepwise regression analysis (SPSS 16.0 for Windows, SPSS Inc., Chicago, IL, USA) using body weight at harvest, age at harvest, and, where relevant, % body fat at 11 weeks (by DEXAReference DuPriest, Kupfer and Lin 15 ). Adipocyte size (area in μm2) was analyzed by pooling average cell areas across each slide, then averaging across slides to obtain one mean value for each fat depot per animal. For ABD-AT, using % body fat at 11 weeks and body weight at harvestReference DuPriest, Kupfer and Lin 15 as covariates in a General Linear Model, values were analyzed using maternal diet and sex as factors. For real-time PCR assays, results are shown as a ratio of gene-of-interest to endogenous control (18s rRNA). These ratios were Ln transformed, then analyzed by analysis of variance (ANOVA) using maternal diet, sex and AT depot (ABD-AT v. SC-AT) as factors. Ln-transformed plasma leptin and insulin values, as well as raw plasma glucose, plasma cortisol and QUICKI values were analyzed within each age group using maternal diet and sex as factors. Data are presented as means ± s.e.m. For all statistical tests, a P-value < 0.05 was considered significant.
Results
Adipocyte size and gene expression in juvenile microswine
After relatively accelerated fat mass accrual over 6–11 weeks (as separately reportedReference DuPriest, Kupfer and Lin 15 ), LPO at 11 weeks nonetheless remained thin, showing persistently lower body weight, low-normal % body fat by DEXA scanning and significantly reduced fat mass:body length ratio. We therefore addressed whether this rapid fat accumulation affected adipocyte size and gene expression despite absence of obesity.
Physiologic determinants of adipocyte size in juveniles: % body fat and body weight relationships
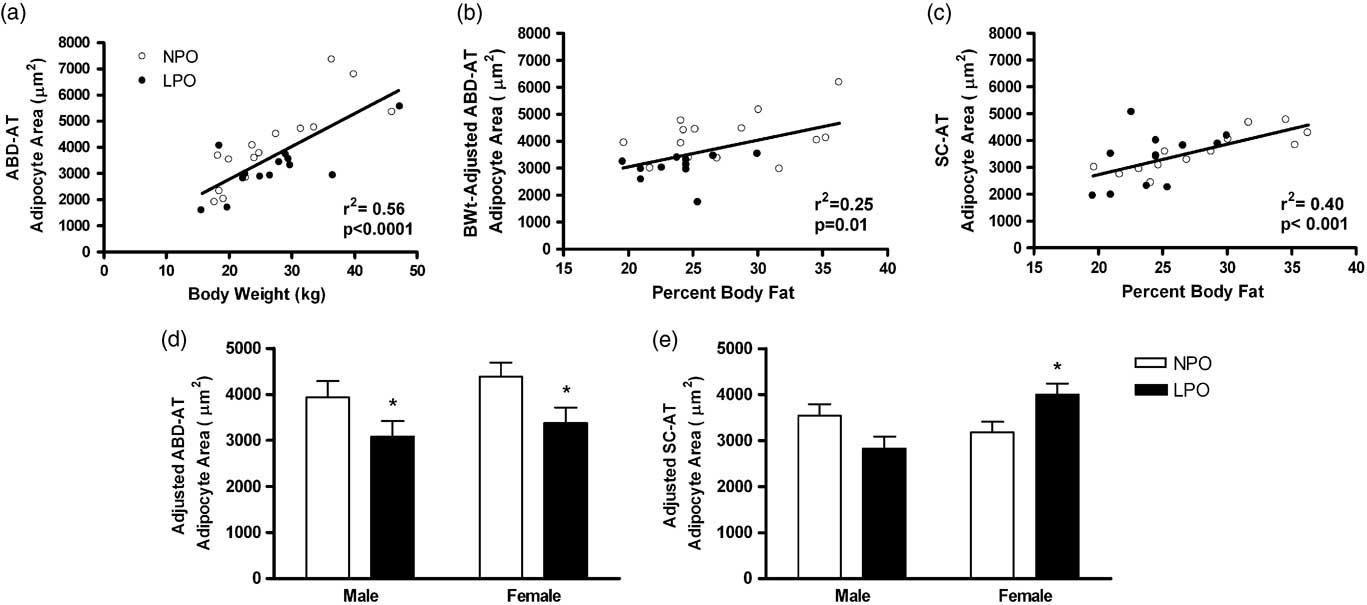
In all juveniles (n = 6 male NPO, 9 female NPO, 8–9 male LPO, 7 female LPO), ABD-AT adipocyte size was directly related to body weight at harvest (r 2 = 0.56, P < 0.0001; Fig. 1a), and also to % body fat at 11 weeks (r 2 = 0.33, P = 0.002; data not shown). Following adjustment for body weight at harvest, ABD-AT adipocyte size retained a significant relationship with % body fat (r 2 = 0.25, P < 0.01; Fig. 1b), indicating an independent effect that was confirmed by stepwise regression analysis using both terms (full corrected model r 2 = 0.67, P < 0.0001). In juvenile SC-AT, adipocyte size was directly related only to % body fat at 11 weeks (r 2 = 0.40, P < 0.001; Fig. 1c). When examined separately, NPO and LPO exhibited similar relationships. To control for these confounding effects, body weight and/or % body fat were included as covariates in the analysis of MPR and sex effects on adipocyte size. Results are presented as the covariate-adjusted values generated within the ANOVA unless otherwise stated. For adipocyte size and gene expression, ‘adjusted’ ABD-AT values are adjusted for % body fat and body weight at harvest; ‘adjusted’ SC-AT values are adjusted only for % body fat.
Adipocyte size in intra-abdominal adipose tissue (ABD-AT) and subcutaneous adipose tissue (SC-AT). Physiological determinants of adipocyte size are shown in panels a, b and c; panels d and e show effects of maternal diet on adipocyte size after adjusting for relationships shown in a, b and c. (a) Relationship between body weight at harvest and ABD-AT adipocyte size (i.e. mean cross-sectional area, in μm2). (b) Relationship between body weight-adjusted ABD-AT adipocyte size and % body fat at 11 weeks. (c) Relationship between % body fat at 11 weeks and SC-AT adipocyte size. (d) ABD-AT adipocyte size, adjusted for body weight at harvest and % body fat adjusted. (e) SC-AT adipocyte size, adjusted for % body fat. Data in panels d and e are shown as means ± s.e.m. White bars, normal-protein offspring (NPO; n = 14; 5 males, 9 females); black bars, low-protein offspring (LPO; n = 12; 6 males, 6 females). Maternal diet, *P < 0.02.

Maternal diet effects on adipocyte size
In ABD-AT, adjusted adipocyte size was reduced ∼22% in LPO compared with NPO, with no sex differences observed (adjusted values: 3227 ± 242 μm2 in LPO v. 4159 ± 209 μm2 in NPO; P =0.011; Fig. 1d). In SC-AT, adjusted adipocyte size was increased in female LPO (P = 0.05), but normal in male LPO (Fig. 1e), each as compared with sex-matched NPO controls.
Maternal diet effects on the relationships of AT gene expression with % body fat and body weight
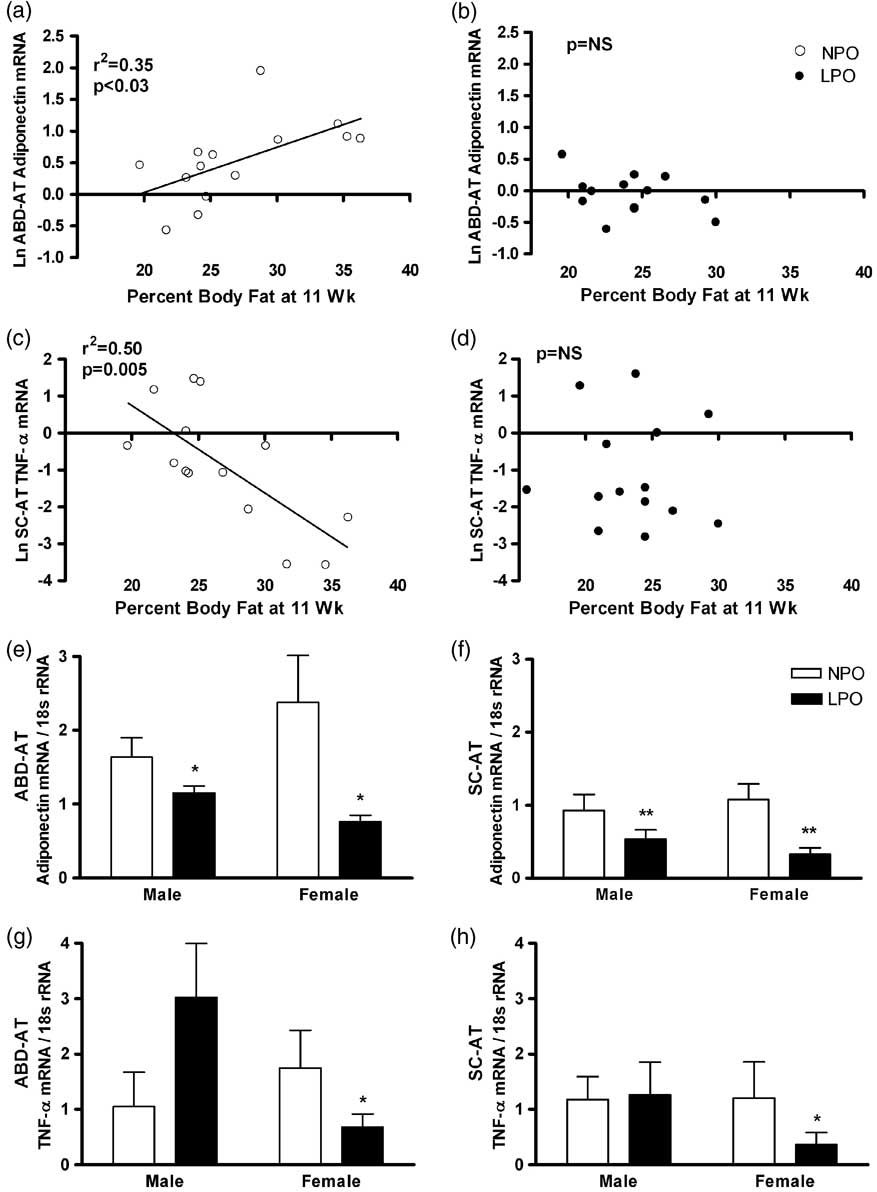
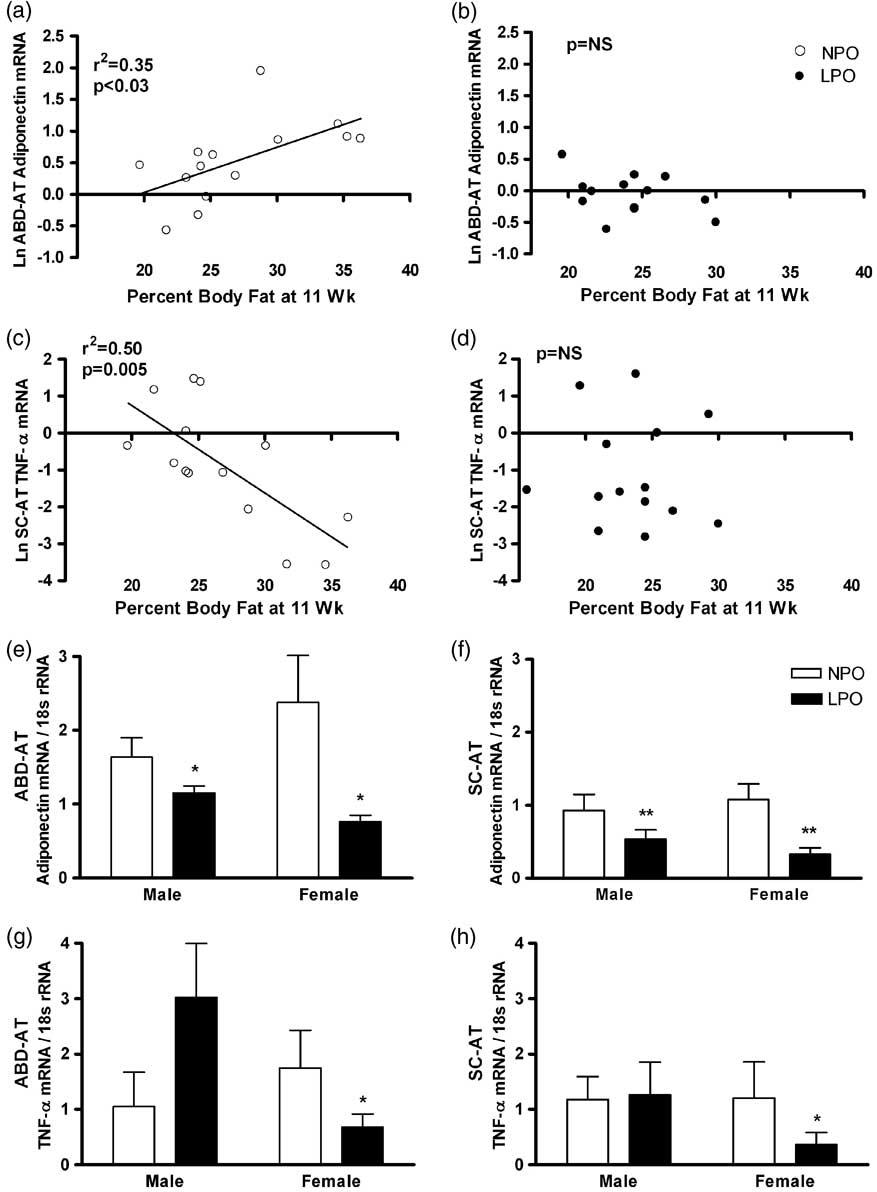
Ln-transformed adiponectin mRNA levels in ABD-AT were directly related to % body fat at 11 weeks in NPO (r 2 = 0.35, P = 0.03; Fig. 2a); however, there was no such relationship in LPO (Fig. 2b). In SC-AT, Ln-transformed adiponectin mRNA levels were weakly related to % body fat when NPO and LPO data were combined (r 2 = 0.22, P = 0.01; data not shown); however, no relationship was observed in either group alone. Ln-transformed adiponectin mRNA levels were not related to body weight at harvest in either AT depot.
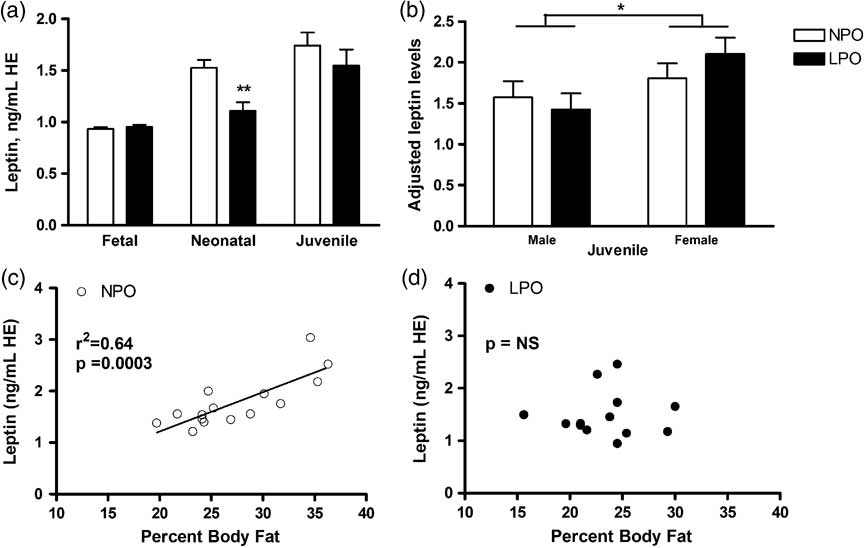
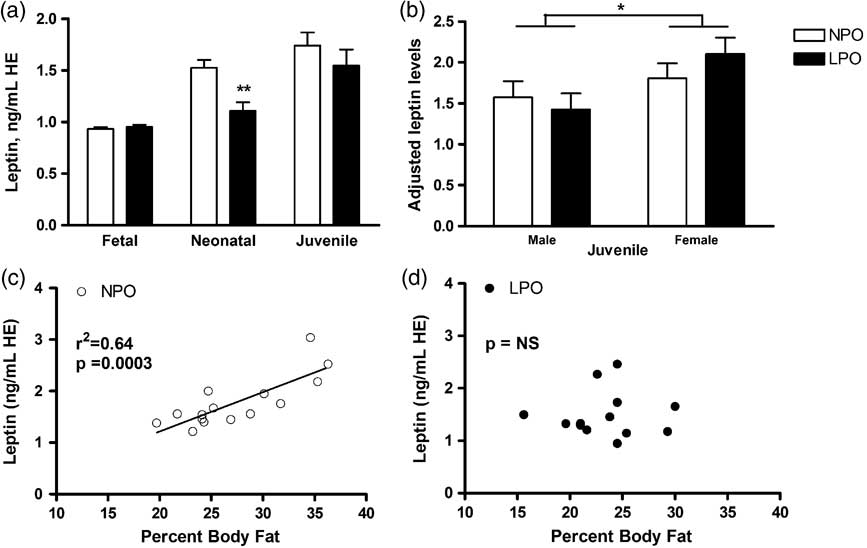
Fasting plasma leptin concentrations in fetal, neonatal and juvenile offspring. Fasting plasma leptin levels in near-term fetal offspring [gestational day 113 out of 115; n = 13 normal-protein offspring (NPO); 14 low-protein offspring (LPO)]; 2-week-old neonatal offspring (n = 9 NPO; 8 LPO); and juvenile offspring (n = 16 NPO; 17 LPO) are shown as means ± s.e.m. (a). Plasma leptin levels (adjusted for % body fat) are shown for juvenile male (n = 7 NPO; 10 LPO) and female offspring (n = 7 NPO; 7 LPO) as means ± s.e.m. (b). White bars, NPO; black bars, LPO. Sex, *P < 0.05; maternal diet, **P < 0.005. Relationships between % body fat and plasma leptin are shown for NPO (c, open circles) or for LPO (d, black circles). HE, human equivalents.
Unexpectedly, Ln-transformed TNF-α mRNA levels in SC-AT were inversely related to % body fat at 11 weeks in NPO (r 2 = 0.50, P = 0.005; Fig. 2c); LPO did not exhibit any correlation (Fig. 2d). TNF-α mRNA levels in SC-AT were unrelated to body weight at harvest, and TNF-α mRNA levels in ABD-AT were unrelated to either body weight at harvest or % body fat at 11 weeks.
Maternal diet effects on AT gene expression
Adiponectin mRNA in juvenile LPO was lower in both fat depots and in both sexes v. NPO (P < 0.001 in sex-combined analysis; Fig. 2e and 2f). However, the reduction in LPO females (69 ± 5%) was significantly greater than the reduction observed in males (36 ± 10%; P = 0.02 for sex by diet interaction). TNF-α mRNA was significantly lower in female LPO (P = 0.03), but statistically unchanged in male LPO compared with sex-matched NPO in both fat depots (Fig. 2g and 2h). Both adiponectin and TNF-α mRNA levels in ABD-AT were higher than in SC-AT (P < 0.001 for each; Fig. 2e–2h). Neither adjusted ABD-AT adipocyte size nor adjusted SC-AT adipocyte size was correlated with mRNA levels of adiponectin or TNF-α in either AT depot.
Metabolic indices in near-term fetal, neonatal and juvenile microswine
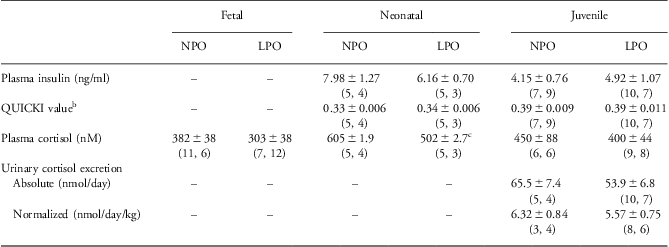
Circulating markers of metabolic function were assessed in NPO and LPO at three stages of development: near-term fetal (GD 113 out of 115), neonatal (2 weeks postnatal) and juvenile (3–5 months postnatal); see Table 2 for N and sex distributions for each age group.
Plasma and urine metabolic indicesFootnote a

NPO, normal-protein offspring; LPO, low-protein offspring; QUICK, quantitative insulin sensitivity check index.
a Values are shown as means ± S.E.M. with n shown as (male, female) below.
b QUICKI is calculated as 1/[(log fasting plasma insulin) + log (fasting plasma glucose)].
c P < 0.05 compared with 2-week-old NPO.
Plasma leptin
In near-term fetal offspring, no differences in plasma leptin levels were observed in LPO v. NPO. At 2 weeks of age, still during MPR, plasma leptin levels were reduced in LPO compared with NPO (P = 0.004; Fig. 3a). In juveniles (NPO and LPO combined), plasma leptin levels were directly related to % body fat at 11 weeks (r 2 = 0.239, P = 0.007). However, when NPO and LPO were analyzed separately, only NPO exhibited a significant relationship between plasma leptin and % body fat (r 2 = 0.640, P = 0.0003; Fig. 3c); LPO did not show any relationship (Fig. 3d). With or without adjustment for % body fat, plasma leptin levels in juvenile LPO showed no difference compared with NPO. Overall, juvenile females had higher leptin levels than juvenile males (P = 0.04; Fig. 3b). After pooling NPO and LPO, plasma leptin levels were positively correlated with unadjusted adipocyte size in ABD-AT (r 2 = 0.16, P = 0.034) and in SC-AT (r 2 = 0.26, P = 0.008). However, leptin was not related to adjusted adipocyte sizes in either ABD-AT or SC-AT.
Adipose tissue adiponectin and tumor necrosis factor (TNF)-α messenger ribonucleic acid (mRNA) expression in intra-abdominal adipose tissue (ABD-AT) and subcutaneous adipose tissue (SC-AT) in juvenile offspring. Relationship between % body fat at 11 weeks and ABD-AT adiponectin or TNF-α mRNA levels is shown for normal-protein offspring (NPO) (a, open circles) or low-protein offspring (LPO) (b, black circles). Relationship between % body fat at 11 weeks and SC-AT TNF-α mRNA levels is shown for NPO (c, open circles) or LPO (d, black circles). Adiponectin mRNA levels in ABD-AT (e) and SC-AT (f); and TNF-α mRNA levels in ABD-AT (g) and SC-AT (h) are normalized to 18s ribosomal ribonucleic acid (rRNA) and shown as means ± s.e.m. White bars, NPO (n = 15; 6 males, 9 females); black bars, LPO (n = 16; 9 males, 7 females). Maternal diet, *P = 0.03; maternal diet, **P < 0.002.
Glucose homeostasis
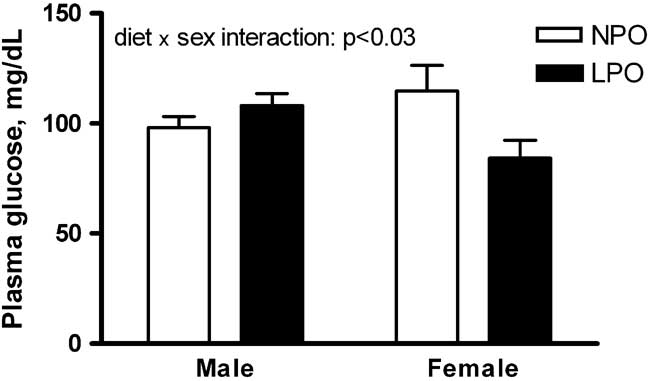
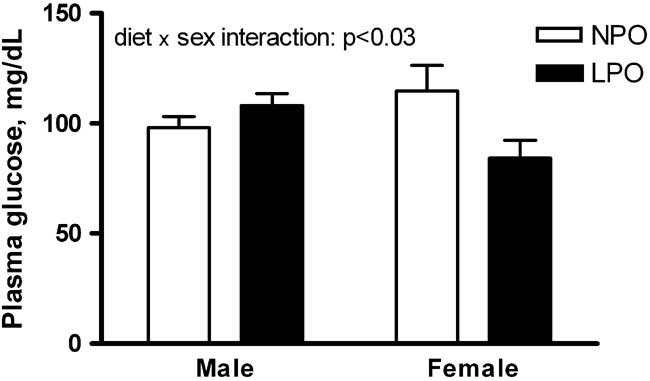
In juveniles, fasting plasma glucose levels were higher in male LPO, but lower in female LPO, compared with sex-matched controls, though within-sex comparisons were not significant (maternal diet by sex interaction, P = 0.03; Fig. 4). Juvenile LPO of both sexes had unchanged fasting plasma insulin levels (Table 2). Similarly, QUICKI values, an index of insulin sensitivity, were unchanged in juvenile male and female LPO (Table 2). Glucose levels in near-term fetal and neonatal offspring, as well as plasma insulin levels and QUICKI values in neonatal offspring, were not affected by either maternal diet or sex (Table 2; insulin levels were not determined in near-term fetal offspring.)
Plasma glucose levels in juvenile offspring. Fasting plasma glucose levels in juveniles are shown as means ± s.e.m. White bars, normal-protein offspring (NPO; n = 16; 7 males, 9 females); black bars, low-protein offspring (LPO; n = 17; 10 males, 7 females). Maternal diet by sex interaction, *P < 0.03.
Indices of glucocorticoid system activity in fetal, neonatal and juvenile microswine
Plasma and tissue parameters related to glucocorticoid function were studied in subsets of offspring. (See Table 2 for n and sex distribution for each plasma or urine analysis.)
Plasma cortisol and urinary cortisol excretion
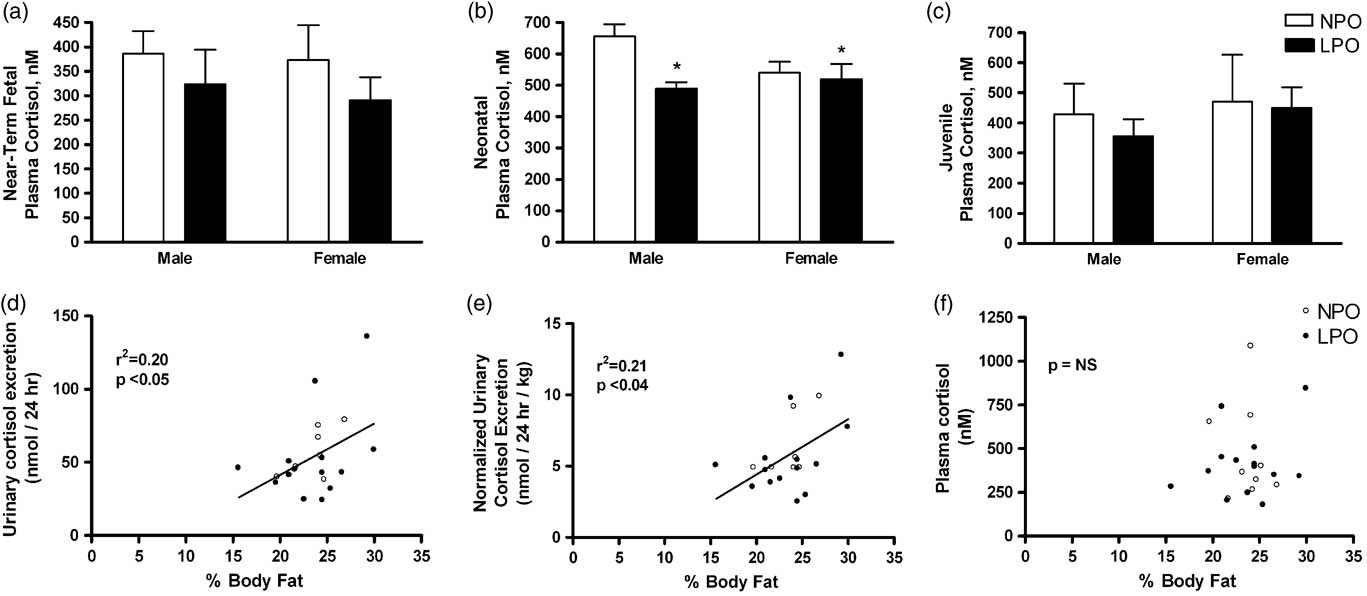
In 2-week-old neonatal LPO during MPR, plasma cortisol was lower than in NPO with no significant sex differences observed (Fig. 5b and Table 2). There was a general trend toward decreased plasma cortisol levels in LPO offspring of all ages, but this decrease was significant only in the 2-week neonates during MPR (Fig. 5a and Table 2).
Plasma cortisol and urinary cortisol excretion in fetal, neonatal and juvenile offspring. Fasting plasma cortisol levels (nM) in near-term fetal [a; n = 11 normal-protein offspring (NPO) males, 5 NPO females, 7 low-protein offspring (LPO) males, 12 LPO females], 2-week-old neonatal (b; n = 5 NPO males, 4 NPO females, 4 LPO males and 3 LPO females) and juvenile (c; n = 5 NPO males, 5 NPO females, 9 LPO males, 9 LPO females) pigs are shown as means ± s.e.m. White bars, NPO; black bars, LPO. Maternal diet, *P < 0.05 with no significant sex by diet interaction. Correlations between 24-h urinary cortisol excretion and % body fat are shown for absolute values (nmol/day, d) and for cortisol excretion normalized to lean body mass at 11 weeks (nmol/day/kg, e). The scatter plot showing lack of correlation between plasma cortisol level (nM) and % body fat is also shown (f).
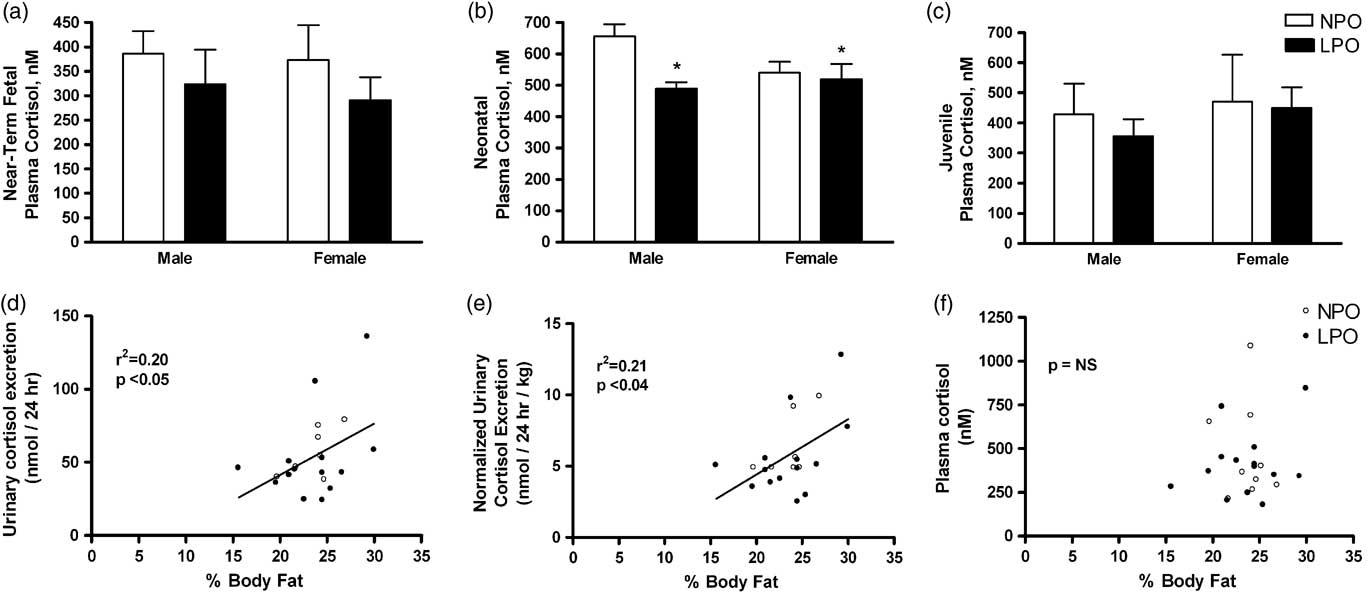
In juvenile offspring, 24-h urinary cortisol excretion, both absolute (nmol/day) and normalized to lean mass (nmol/day/kg), was similar between LPO and NPO (Table 2). A weak positive correlation was observed between 24-h cortisol excretion and % body fat at 11 weeks (r 2 = 0.20, P < 0.05; Fig. 5d), which remained significant after adjusting for lean body mass (r 2 = 0.21, P < 0.04; Fig. 5e). No correlation was observed between plasma cortisol level and % body fat (Fig. 5f).
AT glucocorticoid system components in juvenile offspring subset
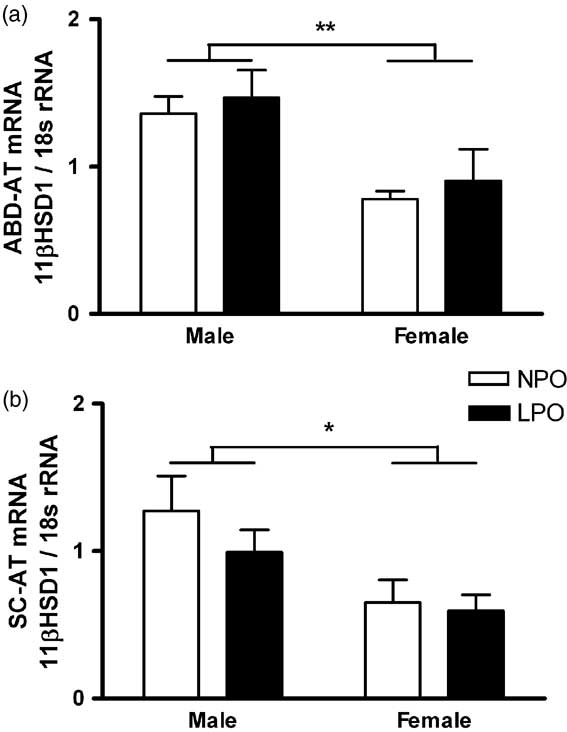
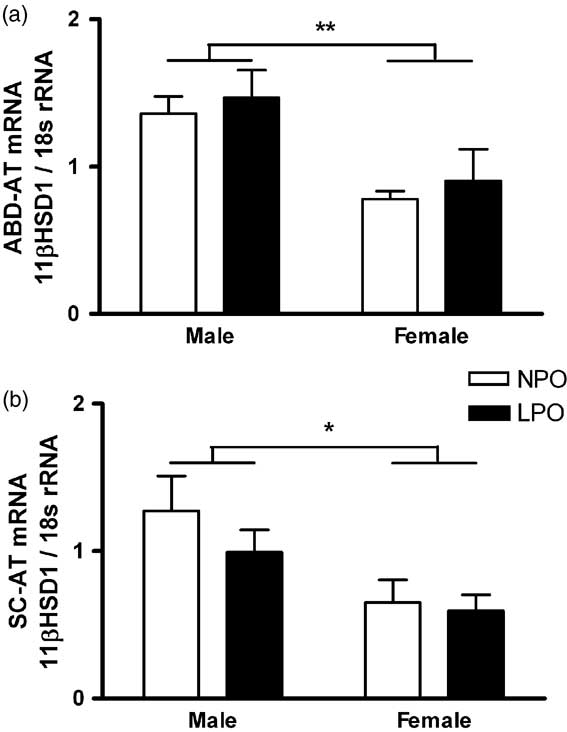
In juvenile ABD-AT and SC-AT, MPR had no effect on mRNA levels of 11βHSD1 or GR-α. Females (n = 5 NPO, n = 7 LPO) had lower 11βHSD1 mRNA levels compared with males (n = 5 NPO, n = 9 LPO) in both ABD-AT (Fig. 6a; P = 0.002) and SC-AT (Fig. 6b; P = 0.02).
Adipose tissue 11β hydroxysteroid dehydrogenase (HSD1) messenger ribonucleic acid (mRNA) levels in juvenile offspring. Levels of mRNA for 11βHSD1 are shown for intra-abdominal adipose tissue (ABD-AT) (a) and subcutaneous adipose tissue (SC-AT) (b) as means ± s.e.m. of values normalized to 18s ribosomal ribonucleic acid (rRNA). White bars, normal-protein offspring (NPO; n = 10; 5 males, 5 females); black bars, low-protein offspring (LPO; n = 16; 9 males, 7 females). Sex, **P < 0.002; sex, *P < 0.02.
Discussion
Growth during prenatal and postnatal life has been shown to influence risk of cardiovascular and metabolic disease later in life,Reference Fall, Osmond and Barker 1 – Reference Curhan, Chertow and Willett 4 but the mechanisms involved are not yet clear. In the present study, we generated asymmetric growth restriction in microswine offspring using perinatal isocaloric MPR applied from 0.75 gestation through 2 weeks postnatally. The postnatal MPR extension encompasses the major period of adipogenesis in swine. We show that, despite absence of obesity,Reference DuPriest, Kupfer and Lin 15 AT structure and function are nevertheless altered during the late prepubertal period following perinatal MPR and the subsequent accelerated growth. Major findings in LPO include depot- and sex-specific changes in adipocyte size, most prominently reduced adipocyte size in abdominal fat depots; depot-independent reductions in adiponectin mRNA levels (69 ± 5% reduction in LPO females, 36 ± 10% in LPO males) independently of adipocyte size; altered relationships between % body fat and adipokines; and early signs of sex-dependent glucose homeostasis dysregulation.
Swine are suited for study of cardiometabolic disease because of their close physiological, anatomical and genomic similarities to humans.Reference Spurlock and Gabler 24 , Reference Wernersson, Schierup and Jorgensen 25 One important difference is the lack of brown AT in swine,Reference Trayhurn, Temple and Van 26 partially attributed to deletion of exons 3–5 in the gene for uncoupling protein (UCP)1 with loss of UCP1 function.Reference Berg, Gustafson and Andersson 27 Another distinction between swine and humans is the relatively late development of white AT in swine: piglets are born with only ∼1–2% body fat,Reference Widdowson 16 , Reference Widdowson 17 requiring 3–4 weeks to acquire the 12–15% body fat typical of the human newborn.Reference Manners and McCrea 18 Our postnatal extension of MPR was designed to encompass this important phase of adipogenesis.
The juvenile LPO described in this study were previously reported to exhibit rapid accrual of both fat and lean tissues over ages 6–11 weeks, as evidenced by low tissue masses at 6 weeks, and normal tissue masses at 11 weeks.Reference DuPriest, Kupfer and Lin 15 The absence of obesity may in part reflect the relatively low-fat postweaning diet consumed by the offspring, which could mitigate or delay programmed obesity. In a study of human children, obese subjects displayed an earlier and more rapid increase in adipocyte size and adipocyte number.Reference Knittle, Timmers, Ginsberg-Fellner, Brown and Katz 28 We therefore asked whether, despite absence of excess adiposity, the relatively rapid accrual of AT in LPO (approximately seven-fold increase v. five-fold in NPOReference DuPriest, Kupfer and Lin 15 ) would yield adipocyte hypertrophy, as was observed in a study of low-birthweight mice with subsequent catch-up growth,Reference Isganaitis, Jimenez-Chillaron and Woo 29 and/or altered adipokine regulation.
We first confirmed in all pigs that both % body fat and body weight were significant physiologic influences modulating ABD-AT adipocyte size, whereas only % body fat influenced SC-AT adipocyte size. This is supported by human data showing that, in adult SC-AT, adipocyte size is correlated with total and % body fat.Reference Chumlea, Roche, Siervogel, Knittle and Webb 30 Unexpectedly, despite adjustment for these physiologic relationships, and despite the greater fold-increase in LPO fat mass,Reference DuPriest, Kupfer and Lin 15 the still lighter, thinner juvenile LPO were found to have smaller adipocytes in abdominal AT, rather than the predicted adipocyte hypertrophy. This observation, together with the overall normal % body fat, is compatible with an increase in adipocyte number in LPO ABD-AT. However, because we could not quantify ABD-AT volume independently of total truncal fat by DEXA scanning, we cannot estimate adipocyte number. Nonetheless, adipocyte size was clearly reduced in LPO ABD-AT in both sexes. Moreover, the impact of MPR is depot specific: maternal diet did not affect SC-AT adipocyte size in LPO males, and caused mild SC-AT adipocyte hypertrophy in LPO females. Our ABD-AT data mirror findings in a rat MPR study, which showed decreased adipocyte size in offspring epididymal (visceral) fat pads following maternal low protein diet.Reference Ozanne, Dorling, Wang and Petry 31
We further investigated whether rapid fat accrual in juvenile LPO induces key metabolic changes that typically accompany fat gain, that is, low adiponectin transcription, increased TNF-α transcription and high plasma leptin levels (see review: de Ferranti and MozaffarianReference de Ferranti and Mozaffarian 7 ). In diet-induced and genetic obesity studies, which compare normal v. obese states in adults, adiponectin protein and transcript levelsReference Engeli, Feldpausch and Gorzelniak 9 decrease with increasing adipocyte size.Reference Yamauchi, Kamon and Waki 32 Based on the reduced ABD-AT adipocyte size observed in LPO, one might expect increased adiponectin transcript levels, specifically in the ABD-AT depot. However, these non-obese juvenile LPO had reduced adiponectin mRNA levels in both ABD-AT and SC-AT depots without relationship to adipocyte size and in the absence of inflammatory markers, a pattern distinct from that observed in acquired obesity. This suggests that MPR and/or the consequent accelerated prepubertal growth program persistent changes in some unidentified regulator of adiponectin transcription and/or its mRNA stability. We were unable to measure adiponectin protein levels; however, in both human obesityReference Qiao, Lee, Kinney, Yoo and Shao 33 and rodent obesity models,Reference Engeli, Feldpausch and Gorzelniak 9 adiponectin transcript and protein levels are reduced in parallel, suggesting a transcriptional mechanism for hypoadiponectinemia.
Adiponectin transcription can be suppressed by multiple mediators, including insulin,Reference Fasshauer, Klein, Neumann, Eszlinger and Paschke 34 interleukin-6,Reference Fasshauer, Kralisch and Klier 35 TNF-α,Reference Tilg and Moschen 36 angiotensin II,Reference Iwai, Kanno and Tomono 37 sympathetic nervous activityReference Imai, Katagiri and Yamada 38 and increased fat mass.Reference Arita, Kihara and Ouchi 8 In juvenile LPO reported here, we have excluded increased basal insulin level, decreased insulin sensitivity, increased TNF-α and increased fat massReference DuPriest, Kupfer and Lin 15 as driving factors for suppressing adiponectin mRNA. Recent feeding studies in mice genetically prone to obesity showed that increased energy intake (calories), but not fat intake or fat mass per se, reduced adiponectin gene transcription, possibly via peroxisome proliferator-activated receptor α.Reference Qiao, Lee, Kinney, Yoo and Shao 33 In the recent manuscript, we show either low (female) or normal (male) total energy intake in LPO; however, since feed intake per gram of body weight is increased, we cannot exclude a potential role of relatively increased calorie intakeReference DuPriest, Kupfer and Lin 15 in suppression of adiponectin mRNA. If this proves relevant, it suggests a novel and potentially powerful mechanism by which accelerated growth enhances cardiovascular/metabolic disease risk following nutritional programming.
Evidence for a role of adiponectin in nutritionally programmed metabolic dysfunction in humans is still controversial. Circulating adiponectin has been shown in studies of children born small for gestational age (SGA) to be either lowReference Meral, Cekmez and Pirgon 39 – Reference Jaquet, Deghmoun, Chevenne, Czernichow and Levy-Marchal 44 or high,Reference Ibanez, Lopez-Bermejo and Diaz 45 , Reference Challa, Evagelidou and Cholevas 46 although effects may be gender- and/or age specific.Reference Ibanez, Sebastiani and Lopez-Bermejo 47 , Reference Iniguez, Soto and Avila 48 On the other hand, regardless of starting level of adiponectin in SGA children early on, ‘catch-up’ growth is inversely related to adiponectin levels later in childhood.Reference Cianfarani, Martinez and Maiorana 43 , Reference Ibanez, Lopez-Bermejo and Diaz 49 – Reference Lopez-Bermejo, Casano-Sancho and Fernandez-Real 53 The effect of SGA to reduce adiponectin levels persists into adulthood, even without full catch-up growth.Reference Jaquet, Deghmoun, Chevenne, Czernichow and Levy-Marchal 54 This supports the prior suggestion that excess energy intake may suppress adiponectin transcription and potentially explain the propensity of accelerated growth to exacerbate later life disease.
Adipokine relationships with % body fat were disrupted in LPO as compared with controls. Interestingly, in control pigs, the inverse relationship between % body fat and adiponectin levels typically observed in diet-induced or genetic obesityReference Arita, Kihara and Ouchi 8 was not present; instead, a positive relationship between these factors was seen in ABD-AT of NPO controls. This may reflect the normal physiologic relationship in the still-developing AT of non-obese juveniles. The inverse relationship previously reported has been largely based on comparing normal and obese subjects who are fully mature, in contrast to the growing pigs studied in this study. In any case, it is clear that LPO lack this normal relationship. Moreover, whereas juvenile NPO did exhibit the expected positive relationships between % body fat and, respectively, plasma leptin levels and SC-AT TNF-α mRNA levels, these relationships were again disrupted in LPO, suggesting a generalized disturbance in the regulation of adipocyte function. In support of the dysregulated adipokine/body fat relationships, microarray of visceral fat of rat offspring exposed to MPR showed reduced transcription of 48 inflammation-related genes despite increased visceral adiposity.Reference Guan, Arany and van Beek 55
AT dysfunction in adults is associated with dysregulated glucose homeostasis and insulin resistance. Our study showed no disruption in insulin production or sensitivity, but plasma glucose levels were altered in a sex-dependent manner. Given that the animals were studied as prepubertal juveniles while on a low-fat diet, it is not surprising that pancreatic function and insulin target tissue sensitivity are still intact. In support of this, a recent study of aged female sheep showed dysregulated glucose homeostasis upon short-term high calorie intake, but not on a normal diet.Reference George, Zhang and Tuersunjiang 56 The altered glucose homeostasis observed in males, together with the reduced adiponectin gene expression, support the potential for development of insulin resistance in adulthood with its attendant risks of hypertension and Type II diabetes mellitus.
Because of the frequently observed disruption in the hypothalamic–pituitary–adrenal (HPA) axis or its peripheral components following maternal proteinReference Bertram, Trowern, Copin, Jackson and Whorwood 57 – Reference McMullen and Langley-Evans 63 or nutrient restriction,Reference Edwards and McMillen 64 – Reference Symonds, Gopalakrishnan and Bispham 67 we also tested whether late gestation/early lactation MPR affects glucocorticoid homeostasis in the microswine MPR model. Plasma cortisol levels were low at 2 weeks in LPO, but this effect did not persist. No other changes in glucocorticoid production or activity were observed, in contrast to what has been observed in many studies in other speciesReference Langley-Evans 58 , Reference McMullen and Langley-Evans 62 , Reference Phillips, Walker and Reynolds 68 – Reference Klemcke, Lunstra, Brown-Borg, Borg and Christenson 70 and in spontaneous low-birthweight pigs.Reference Poore and Fowden 71 We believe this difference is due to the timing of exposure: the critical window of development of the HPA axis may have closed in swine prior to our application of MPR. Alternatively or additionally, swine may respond differently to stress than rodents do, as suggested by Weaver et al. Reference Weaver, Aherne, Meaney, Schaefer and Dixon 72 in their study on neonatal handling of young boars, and these differences may yield different results depending on which HPA axis measurements were performed.
The data reported here support the concept that perinatal MPR in microswine, with its associated early asymmetric growth restriction and programmed acceleration of prepubertal growth over 6–11 weeks of age, leads to altered adipose structure and gene expression, as well as to functional dysregulation of adipokines independently of the development of obesity or adipocyte hypertrophy. Specifically, MPR and/or accelerated postweaning growth cause(s) reduced ABD-AT adipocyte size, reduced adiponectin mRNA levels and disrupted relationships between % body fat and the adipokines adiponectin, leptin and TNF-α, in each case by mechanisms distinct from those operating in human or rodent forms of obesity. MPR may program the reduction of adiponectin mRNA levels while exerting depot-specific effects on adipocyte size regulation and disconnecting adipocyte leptin and adiponectin from body fat cues. Adiponectin has favorable effects in multiple tissues, that together optimize energy homeostasis, whereas adiponectin deficits contribute to the multiorgan dysfunction associated with metabolic syndrome. Because of these metabolically favorable actions of adiponectin, we propose that a programmed dysregulation of adipocytes, including reduction of adiponectin mRNA, may constitute an important link between early-life nutrient deprivation and later risk of cardiovascular and metabolic disease.
Acknowledgments
Work was supported by NIH/NICHD 1P01 HD34430, R01 HD042570, Medical Research Foundation of Oregon, and the Eagles Foundation of Spokane, WA. EA DuPriest was supported by American Heart Association Pacific Mountain Affiliate Predoctoral Fellowship Award no. 0415530Z and by the Oregon Health & Science University Tartar Trust Fellowship.