


1 Introduction
Recent work in political science has clarified and formalized the challenges in generalizing the treatment effect from an experimental sample to a target population (e.g., Egami and Hartman Reference Egami and Hartman2023; Findley, Kikuta, and Denly Reference Findley, Kikuta and Denly2021). However, many existing statistical approaches focus explicitly on generalizing the intent-to-treat (ITT) effect, ignoring the presence of noncompliance in both the experiment and the target population (e.g., Cole and Stuart Reference Cole and Stuart2010; Egami and Hartman Reference Egami and Hartman2023; Hartman et al. Reference Hartman, Grieve, Ramsahai and Sekhon2015; Hotz, Imbens, and Mortimer Reference Hotz, Imbens and Mortimer2005; Huang et al. Reference Huang, Egami, Hartman and Miratrix2023; Kern et al. Reference Kern, Stuart, Hill and Green2016; Zhang, Huang, and Imai Reference Zhang, Huang and Imai2024). In practice, political scientists are often interested in understanding the impact of interventions across individuals who actually comply with the treatment. As such, a more policy-relevant interest is the target complier average causal effect (T-CACE), which considers the generalized impact of a treatment across the subset of individuals who would comply. Unfortunately, in the presence of noncompliance, standard assumptions used to generalize treatment effects are no longer sufficient to identify the T-CACE (Dahabreh, Robertson, and Hernán Reference Dahabreh, Robertson and Hernán2022).
In this article, we introduce a framework for political scientists to generalize the complier average causal effect (CACE), also commonly referred to as the local average treatment effect (LATE; Imbens and Angrist Reference Imbens and Angrist1994), from a study sample to a target population. The problem presents a unique challenge, as non-compliers are generally unidentifiable in both the study sample and the target population. Furthermore, individuals who are likely to select into an experimental study may also be more likely to comply, resulting in differential rates of compliance between the experiment and the target population. We propose an instrumental variable (IV) approach (Angrist, Imbens, and Rubin Reference Angrist, Imbens and Rubin1996) to address the problem of generalizing noncompliance. We invoke a population-level exclusion restriction, which allows us to identify the T-CACE as the ratio of the conditional expectation of the difference in outcomes to the conditional expectation of the difference in treatment received, both evaluated in the target population. Our identification strategy is distinct from a concurrent study by Clark et al. (Reference Clark, Rott, Hodges and Huling2024), who introduce principal ignorability assumptions to identify the T-CACE.Footnote 1
From our identification result, we propose a family of weighted estimators that consistently recover the T-CACE and derive their asymptotic properties. We also propose a multiply robust estimator that allows researchers to leverage outcome models in the estimation stage. Notably, our identification strategy and estimators are applicable to both randomized controlled trials (RCTs) and observational studies.
We then provide several extensions of the framework to address practical considerations that arise in political science. First, we provide ways for researchers to integrate partial, or proxy, information about compliance across the target population into the estimation procedure. Second, we introduce an optimization-based sensitivity analysis framework to evaluate the robustness of the estimators in the presence of unmeasured confounding (e.g., Aronow and Lee Reference Aronow and Lee2013; Huang Reference Huang2024; Huang and McCartan Reference Huang and McCartan2025; Rosenbaum Reference Rosenbaum1987; Zhao, Small, and Bhattacharya Reference Zhao, Small and Bhattacharya2019). Finally, we extend existing IV tests for researchers to evaluate the validity of the instrument used in this generalizability context.
The article is organized as follows. Section 2 introduces the notational framework and formally defines the T-CACE. Section 3 examines the assumptions required to derive the identification results. Section 4 proposes the weighted estimator, the weighted least squares estimator and the multiply robust estimator, along with their asymptotic statistical properties. Section 5 discusses practical considerations on how to incorporate additional compliance information and evaluate potential violations of key assumptions. Section 6 evaluates the performance of the proposed estimators in a simulation study. Section 7 applies the proposed methods to a dataset from a canvassing study that employs techniques designed to reduce exclusionary attitudes. Section 8 concludes the article.
1.1 Motivating example: Deep canvassing to reduce exclusionary attitudes
To illustrate the proposed methodological framework, we introduce a motivating example on generalizing the impact of deep canvassing on reducing exclusionary attitudes, as originally studied in Kalla and Broockman (Reference Kalla and Broockman2020).Footnote 2 Deep canvassing is used to persuade individuals regarding their underlying political beliefs. Deep canvassing employs non-judgmental narrative exchange and interpersonal conversation to persuade others by sharing personal experiences and listening without judgment (e.g., Chen et al. Reference Chen, Kalla, Le, Nakamura-Sakai, Sekhon and Wang2026; Kalla and Broockman Reference Kalla and Broockman2020; Offer-Westort et al. Reference Offer-Westort, Liu, Feamster, Garg, Hoang and Hosamane2026).
We focus on the randomized experiment from Kalla and Broockman (Reference Kalla and Broockman2020), where the authors study whether deep canvassing can effectively reduce prejudice against unauthorized immigrants in a series of field experiments. Initially, 217,600 registered voters were recruited by mail. Of these, 7,870 responded and were randomly assigned to one of three groups: 2,624 to persuasion with narrative exchange, 2,623 to persuasion without narrative exchange and 2,623 to a control group.Footnote 3 Voters were randomly assigned at the household level, ensuring that voters who completed the pre-survey within the same household were always assigned to the same treatment. Assignment was conducted within matched blocks of households. Following Kalla and Broockman (Reference Kalla and Broockman2020), we define compliance as the setting in which canvassers indicated that they engaged in an effective conversation with the participants.
One week after the conversations between the canvassers and the participants, 1,079 participants were reached to complete a follow-up survey, corresponding to an attrition rate of
$79.4\%$
 . From this survey, an overall index measuring support for immigration-related policies and unauthorized immigrants was constructed and used as the experiment’s outcome variable. Kalla and Broockman (Reference Kalla and Broockman2020) reported a within-sample ITT effect of 8.8
$\%$
 increase in support for unauthorized immigrants and a CACE of 13.2
$\%$
 increase, indicating that deep canvassing effectively reduced prejudice amongst individuals who selected into the experiment and successfully completed the follow-up survey. A policy-relevant question is whether we would expect the impact of deep canvassing to be just as effective across compliers who did not complete the follow-up survey or select into the experiment. In what follows, we propose a suite of methods to address this question.
2 Background
We define a study sample with n units, where each unit is drawn i.i.d. from an infinite super-population. Let
$Z_i \in \{0, 1\}$
 denote the assigned treatment to each unit, where
$Z_i = 1$
 implies that unit i is assigned to treatment and
$Z_i = 0$
 for control. Let
$D_i$
 be an indicator of treatment received, where
$D_i=1$
 if the unit i received treatment and
$D_i=0$
 if the unit i did not receive the treatment. We can similarly write the observed treatment received indicator as
$D_i := D_i(1) Z_i + D_i(0) (1-Z_i)$
 , where
$D_i(1)$
 and
$D_i(0)$
 represent the potential treatment received under treatment and control, respectively. Define the potential outcomes under treatment and control as
$Y_i(1)$
 and
$Y_i(0)$
 , respectively. Finally, we define an indicator
$C_i \in \{0,1\}$
 for whether an individual complies with treatment assignment (i.e.,
$D_i(1) = 1$
 and
$D_i(0) = 0$
 ).
We define a target population of interest, with N units, where each unit is drawn i.i.d. at random from an infinite super-population. Let
$S_i$
 be the indicator such that
$S_i = 1$
 indicates that the unit i is in the study sample, while
$S_i = 0$
 indicates that the unit i is in the target population. We assume that for all units in the study sample and the target population, we have observed a set of pre-treatment covariates
$X_i \in \mathcal {X}.$
 However, across the target population, we do not have access to treatment assignment, treatment received or outcome information. We emphasize that this framework addresses generalizability within a common underlying super-population. It is not directly applicable to transportability across distinct populations or settings, which would require additional assumptions linking the treatment-effect and compliance processes across populations.
Throughout the article, we will denote p as the density of continuous random variables and
${\mathbb {P}}$
 as the probability of an event or the probability mass function of a discrete random variable. We denote
${\mathcal {S}}$
 as the index set of the experimental units:
${\mathcal {S}} := \{i: S_i = 1\}$
 and
${\mathcal {T}}$
 as the index set of the target units:
${\mathcal {T}} := \{i: S_i = 0\}.$

To begin, we assume that within the study sample, treatment assignment is conditionally ignorable.
Assumption 1 Treatment ignorability

Assumption 1 will hold by construction in settings when researchers conduct a randomized experiment. In observational settings, Assumption 1 assumes that, given a set of pre-treatment covariates X, the treatment assignment and the potential outcomes are conditionally ignorable.
Under Assumption 1, we can identify the ITT effect within the study:

Existing literature in external validity has largely focused on generalizing the ITT effect (e.g., Buchanan et al. Reference Buchanan2018; Cole and Stuart Reference Cole and Stuart2010; Egami and Hartman Reference Egami and Hartman2023; Hartman et al. Reference Hartman, Grieve, Ramsahai and Sekhon2015; Huang et al. Reference Huang, Egami, Hartman and Miratrix2023; Ross et al. Reference Ross, Díaz, Pitts, Stuart and Rudolph2026), where the target estimand is the ITT across the target population:

Identifying the ITT effect across the target population often relies on an assumption of mean exchangeability of selection and treatment effect heterogeneity.
Assumption 2 Mean exchangeability of selection and treatment effect heterogeneity

Existing methods include reweighting the data in the study sample to balance the distribution of the target population (e.g., Buchanan et al. Reference Buchanan2018; Cole and Stuart Reference Cole and Stuart2010) or modeling the treatment effect heterogeneity and projecting to the target population (e.g., Kern et al. Reference Kern, Stuart, Hill and Green2016).
In settings where there is perfect compliance (i.e., everyone who is encouraged to take the treatment receives the treatment), the generalized ITT effect will be equivalent to the average treatment effect. However, in settings when there is noncompliance, a more relevant estimand of interest is the average treatment effect across compliers—that is, individuals who would receive the treatment if encouraged:

Much of the existing literature has focused on identifying and estimating the within-study CACE (e.g., Angrist et al. Reference Angrist, Imbens and Rubin1996; Aronow and Green Reference Aronow and Green2013; Ding and Lu Reference Ding and Lu2017; Feller, Mealli, and Miratrix Reference Feller, Mealli and Miratrix2017; Jo Reference Jo2002; Jo and Stuart Reference Jo and Stuart2009; Sovey and Green Reference Sovey and Green2011). In particular, Angrist and Fernandez-Val (Reference Angrist and Fernandez-Val2010), Aronow and Carnegie (Reference Aronow and Carnegie2013), Mogstad, Santos, and Torgovitsky (Reference Mogstad, Santos and Torgovitsky2018) and Gulotty and Yu (Reference Gulotty and Yu2025) examine how the IV estimate can be generalized to other subgroups or causal estimands within the study sample. However, limited work exists on generalizing the CACE to a target population. In addition to having to account for selection bias, researchers must additionally account for the fact that the selection bias from entering a particular study is likely confounded with the propensity for compliance. It is this particular setting that we focus on in the article.
Most closely related to our proposed framework are Rudolph and van der Laan (Reference Rudolph and van der Laan2017) and Clark et al. (Reference Clark, Rott, Hodges and Huling2024). Rudolph and van der Laan (Reference Rudolph and van der Laan2017) propose targeted maximum likelihood estimators (TMLEs) for transported encouragement-design effects, including the T-CACE. Their setting differs from ours in the observed data structure and identification problem. In their setup, treatment assignment and treatment received are observed in the target population, while the outcome is missing. In contrast, we assume that researchers only have access to pre-treatment covariates across the target population. Clark et al. (Reference Clark, Rott, Hodges and Huling2024) adopt a different set of identification assumptions (i.e., principal ignorability), which we compare in detail through simulation studies in Section F.2 of the Supplementary Material.
Our framework is also related to the economics literature on marginal treatment effects (MTEs) and policy-relevant treatment effects (PRTEs; Blandhol et al. Reference Blandhol, Bonney, Mogstad and Torgovitsky2022; Heckman and Vytlacil Reference Heckman and Vytlacil2001, Reference Heckman and Vytlacil2005; Mogstad and Torgovitsky Reference Mogstad and Torgovitsky2018, Reference Mogstad and Torgovitsky2024; Shea and Torgovitsky Reference Shea and Torgovitsky2023). This literature represents CACE and other PRTEs as weighted averages of marginal treatment response (MTR) functions, allowing researchers to extrapolate away from the compliers and therefore examine the robustness of CACE by expanding or contracting the complier subpopulations. Our goal is different. We study a two-population generalizability problem in which extrapolating from study-sample compliers to other latent complier groups within the same population would not address the central challenge: the target population may differ from the study sample in both its covariate distribution and compliance process and may contain only pre-treatment covariates. Applied researchers should use our method when the goal is to estimate the CACE in a target population that differs from the study sample. MTE and PRTE methods are more appropriate for studying how treatment effects vary across individuals with different likelihoods of receiving the treatment or under alternative treatment policies, within a given study.
3 Identifying the target complier average causal effect
This section outlines the necessary conditions for deriving the identification results for
 Our identification result builds on existing IV approaches. Informally, we leverage the randomization of treatment assignment within the study as an instrument for treatment received. Within the context of an experimental setting, exogeneity of treatment assignment can be directly controlled by design. We then introduce a new assumption, which allows researchers to generalize the information about the instrument from the study to the target population.
We invoke standard assumptions from IVs.
Assumption 3 Monotonicity and valid instrument
Assume monotonicity and that the treatment encouragement Z is a valid instrument. More formally,
-
(a) Monotonicity (i.e., no defiers):
$$ \begin{align*}{\mathbb{P}}\left(D(1) < D(0)\right) = 0.\end{align*} $$
-
(b) Exclusion restriction: $Y(z,D(z)) = Y(z',D(z'))$
for all
$z,z'$
such that
$D(z) = D(z').$
-
(c) Instrument relevance:
$$ \begin{align*}\mathbb{E}\left[D(1) - D(0) \,|\, S = 0\right] \neq 0.\\[-30pt]\end{align*} $$


Assumption 3(a) effectively rules out the existence of defiers (i.e., individuals who receive the treatment when assigned to control and refuse it when assigned to treatment) in both the study sample and the target population. In the context of the canvassing via persuasion example, this implies that individuals who are never visited by a canvasser would not engage in a conversation with one. Following Imbens and Angrist (Reference Imbens and Angrist1994), Assumption 3(a) should be read as a sign-uniformity restriction on the choice response to the instrument. This condition is needed so that the target Wald ratio in Theorem 3.1 is interpreted as a T-CACE rather than a net contrast of compliers and defiers. Assumption 3(b) states that the instrument Z can only affect the outcome through D—in other words, the outcome only depends on whether treatment is received, not treatment assignment. This allows us to simplify the potential outcomes to be a function of just D. Assumption 3(c) says that the expected difference in potential treatment received is nonzero.
In the context of persuasion through canvassing, Assumption 3(b) implies that being assigned to a persuasion influences the attitude of a voter only through the act of persuasion itself, without any other direct effect. Assumption 3(c) implies that there is a nonzero probability that an individual in the target population whose receipt of the persuasion intervention depends on whether they were assigned to it. We note that Assumption 3(a) and (b) must hold at the population level, meaning they apply to both the study sample and target population. In Section 5, we discuss guidelines for sharp tests of Assumption 3 (Kitagawa Reference Kitagawa2015; Mourifié and Wan Reference Mourifié and Wan2017; Yu Reference Yu2025). Following Deaton (Reference Deaton2010), Swanson and Hernán (Reference Swanson and Hernán2014) and Swanson et al. (Reference Swanson, Hernán, Miller, Robins and Richardson2018), we view these diagnostic procedures as falsification, rather than as mechanical validation of the identifying assumptions.
Assumption 4 Mean exchangeability of the first stage

Assumption 4 implies that conditioned on pre-treatment covariates, the average difference in treatment received is the same across the study sample and the target population.
Assumptions 2 and 4 together imply the conditional exchangeability of compliance between the study sample and the target population. This means that conditioned on a set of covariates X, the latent compliance patterns across both the study sample and the target population will be identical. In the context of the motivating example, this assumes that individuals with the same demographic information and pre-intervention support for immigration are willing to engage in conversation with a canvasser with the same probability, regardless of if they are in the study sample or the target population. Crucially, the mean exchangeability assumption assumes away a fixed effect on the probability of compliance from selecting into the study sample.
These mean exchangeability assumptions are most plausible when researchers have access to a rich set of covariates that can plausibly account for potential confounding from selecting into the sample. Unlike standard generalizability contexts, the pre-treatment covariates X not only must capture potential treatment effect heterogeneity, but also account for potential heterogeneity in treatment receipt. In other words, the mean exchangeability assumptions are most credible in settings when the covariates are prognostic of both treatment effect heterogeneity, as well as variation in treatment receipt. To help researchers evaluate the sensitivity of their estimates to potential violations in the exchangeability assumptions, we propose a sensitivity analysis in Section 5.
Alternative approaches have used principal stratification to identify the T-CACE (e.g., Clark et al. Reference Clark, Rott, Hodges and Huling2024; Ottoboni and Poulos Reference Ottoboni and Poulos2020). However, these approaches require researchers to model the compliance patterns. In contrast, our approach leverages the exogeneity from a randomized instrument within the study to account for the compliance patterns, which is more feasible in many contexts. For example, in the deep canvassing study, principal stratification requires that, conditional on pre-treatment covariates, compliers and non-compliers exhibit the same treatment effect. However, non-compliers—those who refuse to engage in a full conversation with the canvassers—may also be more resistant to persuasion, suggesting a violation of this assumption. Given that the pre-treatment covariates capture only limited demographic information, it is unrealistic to expect the assumptions underlying principal stratification to hold. In contrast, because the experimenters have full control over the RCT, the treatment assignment is likely to serve as a valid IV.
With Assumptions 1–4, we can directly identify
 .
Theorem 3.1 Causal identification for T-CACE
Let
$\mu _{yz}(x) := \mathbb {E}\left [Y {\,|\,} Z = z, S=1, X=x\right ]$
 and
$\mu _{dz}(x) := \mathbb {E}\left [D {\,|\,} Z = z, S=1, X=x\right ].$
 Under Assumptions 1–4, the T-CACE can be identified as


Equation (1) arises from leveraging the validity of the instrument across the target population (i.e., Assumption 3). This allows us to rewrite
 as a Wald ratio across the target population. Equation (2) arises from mean exchangeability of treatment effect heterogeneity (i.e., Assumption 2) and mean exchangeability of the first stage (i.e., Assumption 4). The identification result can be interpreted as a weighted version of the traditional IV estimator, adjusting for distributional differences in X across the study sample and the target population.
The identification result in Theorem 1 highlights that researchers should, when possible, collect covariates that are prognostic of both selection into the study and compliance. We consider a reweighting approach that adjusts for the differences in covariate distributions between the two populations. Specifically, we reweight the observed data in the study sample to match the covariate distribution of the target population. This enables consistent estimation of the T-CACE, even when the covariate distributions differ substantially. In the next section, we formalize this approach and introduce a family of estimators of T-CACE.
4 Estimating the T-CACE
In the following section, we leverage the identification results from Theorem 1 to introduce a class of estimators to estimate the T-CACE. We propose three estimators: (1) a weighting-based estimator, which allows researchers to adjust for the distributional differences across the study sample and target population; (2) a weighted least squares estimator, which allows researchers to offset potential efficiency loss from weighting by using an agnostic outcome model to explain variation within the study sample; and (3) a multiply robust estimator, which allows researchers to augment a traditional weighting estimator with a treatment effect heterogeneity model. We demonstrate that all proposed estimators are consistent for T-CACE and derive their asymptotic distributions.
For all of the estimation approaches, we require overlap in both the treatment assignment as well as the sample selection process.
Assumption 5 Overlap
The following relationships hold almost surely:

Assumption 5 is a technical condition necessary for the validity of most IPW methods (Rosenbaum and Rubin Reference Rosenbaum and Rubin1983) and ensures that each unit has a nonzero probability of being selected into the study sample and assigned to the treatment group within that population. Recent research has proposed various methods to either assess robustness to violations of overlap or mitigate such violations. For details, see Huang (Reference Huang2025), Li, Thomas, and Li (Reference Li, Thomas and Li2019) and Crump et al. (Reference Crump, Joseph Hotz, Imbens and Mitnik2009). This assumption is most likely to be violated when the experimental sample is drawn after a screening process of the target population or there is a contextual shift between the experimental sample and the target population (geographical regions, institutional differences, etc.; Huang Reference Huang2025). Consider, for example, a cash transfer experiment (e.g., the Youth Opportunities Program in Northern Uganda, as studied in Blattman et al. Reference Blattman, Green, Julian Jamison, Lehmann and Annan2016, Egami and Hartman Reference Egami and Hartman2021 and Huang Reference Huang2025). The cash-transfer treatment is randomized only among groups that submitted applications and passed screening. Uninformed unemployed adults outside that application process would therefore have zero probability of inclusion in the experimental sample (Huang Reference Huang2025). This concern is less direct in our canvassing application because participants were not screened through any application process.
4.1 Weighted estimator
The identification result in Theorem 1 expresses the T-CACE as a ratio of two terms: (1) the generalized ITT effect and (2) the generalized first stage. In this section, we construct a weighted estimator for
 by deriving separate weighted estimators for both the numerator and the denominator. We show that the weighted estimator is a consistent estimator of the T-CACE and derive its asymptotic distribution.
We begin by defining the following weights:

where
$\mathbb {P}(S=0|X)/{\mathbb {P}(S=1|X)}$
 accounts for distribution shifts in the observed covariates between the study sample and the target population, and
$\mathbb {P}(Z=z|S=1, X)$
 accounts for imbalance in the treatment and control groups. In the context of an RCT, the probability of treatment is known by the researcher. The weights in Equation (3) are equivalent to the standard generalization weights introduced in Cole and Stuart (Reference Cole and Stuart2010). A common approach to estimating the weights is to estimate a propensity score model for the underlying sample selection process. Alternatively, researchers can employ balancing approaches, which directly target the distributional differences in the underlying covariates without directly fitting a parametric model (e.g., Hainmueller Reference Hainmueller2012; Imai and Ratkovic Reference Imai and Ratkovic2014).
We define the re-weighted ITT effect as

where
$\widehat w_1(X_i)$
 and
$\widehat w_0(X_i)$
 are estimates of the true generalization weights in Equation (3). This is the standard weighted estimator used in the generalizability literature, which ignores noncompliance.
We also define the weighted estimator for the treatment received:

$\widehat {\tau }_{w}^{D}$
 is analogous to
$\widehat {\tau }_{w}^{Y}$
 in that both share the same weights to account for the distribution shift. However,
$\widehat {\tau }_{w}^{D}$
 pertains to treatment received rather than the outcome. Notably,
$\widehat {\tau }_{w}^{D}$
 effectively estimates the denominator of the identification result of Theorem 1.
The weighted estimator of
 is given by the ratio of these two quantities:

If the estimated weights
$\widehat w_1(X)$
 and
$\widehat w_0(X)$
 are correctly specified, then the weighted estimator is a consistent estimator for
 .
Theorem 4.1 Consistency of the weighted estimator
Assume that
$\mathbb {P}(S = 1) = \frac {n}{n+N}$
 is fixed, so that the ratio between n and N remains constant as
$n \to \infty $
 and
$N \to \infty $
 . Assume
$\sup _{x \in \mathcal {X}} \left |\widehat {w}_1(x) - w_1(x)\right | = o_p(1)$
 and
$\sup _{x \in \mathcal {X}} \left |\widehat {w}_0(x) - w_0(x)\right | = o_p(1).$
 Then, under Assumptions 1–4,

Proof See Section C.2 of the Supplementary Material for a detailed proof.
The fixed ratio condition is used only as an asymptotic device and ensures that as the study sample grows toward infinity, the corresponding target population size also grows toward infinity. In settings when researchers are interested in finite-population settings, we refer readers to Li and Ding (Reference Li and Ding2017). To characterize the asymptotic distribution of the weighted estimator, we begin by first assuming that the selection model and the treatment assignment model are known. Then, the weighted estimator will be asymptotically normally distributed.
Theorem 4.2 Asymptotic distribution of the weighted estimator
Assume the selection model (i.e.,
$\mathbb {P}(S = 1 \,|\, X)$
 ) and the treatment assignment model (i.e.,
$\mathbb {P}(Z = 1 \,|\, S=1, X)$
 ) are both known. Let
$g(\cdot ):\mathbb {R}^6\rightarrow \mathbb {R}$
 be defined as
$g(\theta ) = (\frac {\theta _1}{\theta _3} - \frac {\theta _2}{\theta _4})/(\frac {\theta _5}{\theta _3} - \frac {\theta _6}{\theta _4}).$
 Denote
$\nabla g$
 as its gradient vector. Then, under the same assumptions as Theorem 2 and the regularity conditions
$\mathbb {E} \left [w_z(X)^2 Y^2\right ] < \infty ,$


where we define the covariance matrix
$\Sigma _{\theta ^*}$
 in (C.8) of Section C.3 of the Supplementary Material.
Proof See Section C.3 of the Supplementary Material for a detailed proof.
The result of Theorem 3 follows from establishing the asymptotic normality of each component of
$\widehat {\tau }_{w}$
 by leveraging the theory of estimating equations. In particular, we write
$\widehat {\tau }_{w}$
 as the function g of an M-estimator (Huber Reference Huber1992) and then apply the Delta method to g. The covariance matrix,
$\Sigma _{\theta ^*},$
 though unknown, can be consistently estimated using its empirical counterpart (see Section D of the Supplementary Material for details).
In practice, researchers do not know the true probability of selecting into the study sample. In Section A of the Supplementary Material, we provide a similar result for settings in which the probability of selection is estimated. In practice, we can construct Wald-type confidence intervals for
 by replacing the covariance matrix in Theorem 3 with its empirical counterpart. The details of the construction of the empirical sandwich-type variance estimator and the Wald-type confidence intervals are given in Section D of the Supplementary Material.
4.2 Weighted least squares
While Section 4.1 introduces an estimator that allows us to consistently recover the T-CACE, a well-known drawback to weighted estimators is the potential efficiency loss that occurs from reweighting (Huang et al. Reference Huang, Egami, Hartman and Miratrix2023; Miratrix et al. Reference Miratrix, Sekhon, Theodoridis and Campos2018). This concern is exacerbated in the IV setting, where the combination of reweighting as well as a potentially weak instrument can result in large amounts of variance inflation (Hartman and Huang Reference Hartman and Huang2024). To combat some of the losses in efficiency, we propose a weighted least squares approach to estimating the T-CACE.
More formally, we define the covariate-adjusted weighted least squares estimator as

where
$\widehat {\tau }^{Y}_{\text {wls}}$
 and
$\widehat {\tau }^{D}_{\text {wls}}$
 are given by

Intuitively, the weighted least squares estimator reweights the residual variance of the outcome and treatment received, after controlling for covariates X. If the pre-treatment covariates X are predictive of Y and
$D,$
 incorporating X into the model will reduce the weighted sample residual variance, leading to a more precise estimate. Furthermore, while the estimated weights depend on covariates that are measured across both the study sample and the target population, the regression uses only observations across the study sample. Using the weighted least squares approach allows researchers to leverage additional covariates, measured across just the study sample, to help improve efficiency.
We can view the standard weighted estimator
$\widehat {\tau }_{w}$
 as a special case of
$\widehat {\tau }_{\text {wls}},$
 in which no covariates X are included except for the intercept. We show in Theorem A.2 in the Supplementary Material that, under the same conditions as the weighted estimator,
$\widehat {\tau }_{\text {wls}}$
 will be a consistent estimator and will be asymptotically normally distributed.
4.3 Multiply robust estimator
We now propose a multiply robust estimator that allows researchers to simultaneously model the sample selection process, as well as both the treatment effect heterogeneity and the treatment received. We demonstrate that the proposed multiply robust estimators remain consistent for T-CACE as long as either the sample selection model is correctly specified or both the outcome and treatment received models are correctly specified (Robins, Rotnitzky, and Zhao Reference Robins, Rotnitzky and Zhao1994).
To construct the multiply robust estimator, we augment both
$\widehat {\tau }_{w}^{Y}$
 and
$\widehat {\tau }_{w}^{D}$
 with outcome-based estimators for both Y and D. As such, the multiply robust estimator will be defined as the ratio of the two augmented models. More specifically, the multiply robust estimator for T-CACE is defined as

where the numerator is an augmented weighted estimator for the ITT and is defined as

and the denominator is an augmented weighted estimator for the treatment received:

where
$\widehat {\mu }_{yz}(X)$
 is an estimator of
$\mathbb {E}[Y {\,|\,} Z = z, S=1, X=x]$
 , and
$\widehat {\mu }_{dz}(X)$
 is an estimator of
$\mathbb {E}[D {\,|\,} Z = z, S=1, X=x]. \widehat \mu _{yz}(X)$
 and
$\widehat \mu _{dz}(X)$
 represent additional nuisance functions that researchers must estimate. In practice, researchers can use linear regression, or more flexible, black-box approaches (e.g., Athey and Wager Reference Athey and Wager2019; Chernozhukov et al. Reference Chernozhukov, Chetverikov, Demirer, Duflo, Hansen, Newey and Robins2018; Huang, Tang, and Kenney Reference Huang, Tang and Kenney2025; Liu, Chen, and Wong Reference Liu, Chen and Wong2024; Rudolph and van der Laan Reference Rudolph and van der Laan2017) to construct estimates of
$\widehat \mu _{yz}(X)$
 and
$\widehat \mu _{dz}(X)$
 .
The proposed multiply robust estimator will be a consistent estimator of the T-CACE, so long as the weights for the sample selection process are correctly specified, or both the outcome and treatment received models are correctly specified. We provide the formal theoretical properties of
$\widehat \tau _{mr}$
 in Section C.7 of the Supplementary Material.
5 Practical considerations
In the following section, we consider several extensions of the framework to address practical challenges. First, we provide ways for researchers to integrate partial, or proxy, information about compliance across the target population into the estimation procedure. Second, we introduce a sensitivity analysis framework to evaluate the robustness of the estimators when the underlying mean exchangeability assumptions are violated. Finally, we extend existing IV tests for researchers to evaluate the validity of the instrument used in this generalizability context.
5.1 Incorporating partial compliance information from target population
Throughout Sections 3 and 4, we have assumed that researchers have minimal knowledge of the compliance patterns in the target population. As a result, they can only utilize compliance information from the study sample. In practice, researchers often have additional information about compliance in the target population. For example, in door-to-door canvassing studies, an organization’s administrative records may indicate which residents in the target area responded to previous survey attempts. Similarly, in a medical setting, electronic health records may indicate whether patients have historically followed certain treatment regimens.
In this section, we consider two settings: (1) researchers have observed compliance status for a subset of individuals in the target population and (2) researchers have access to a proxy measure of compliance for individuals across the target population.
Case 1: Observed compliance status for a subset of units. In some settings, researchers can directly observe the compliance status for a subset of individuals in the target population. For example, some participants assigned to the treatment group during the experiment fail to complete the follow-up survey. As such, the outcome in the units is not observed; however, we do know whether or not they complied with the treatment.
To estimate the T-CACE for the non-follow-up group, we leverage the partially observed compliance information to construct a variant of
$\widehat \tau _w$
 :

By incorporating information about treatment received across the target population,
$\widehat {\tau }_{\text {w-pc}}$
 simplifies the form of
$\widehat {\tau }_{w}.$
 In particular,
$\widehat {\tau }_{w}^{D}$
 is replaced with the fraction of compliers among the treated individuals in the target population. Under this framework,
$\widehat {\tau }_{\text {w-pc}}$
 consistently recovers the T-CACE without requiring mean exchangeability in the first stage (i.e., Assumption 4), provided that there are no always-takers and treatment assignment is completely random. For the formal assumptions and proof, refer to Assumption E.1 and Theorem E.2 in the Supplementary Material.
Case 2: Proxy measure of compliance. We now consider a setting in which researchers do not have a direct measure of compliance across the target population, but instead have a proxy measure of whether or not individuals may comply. For example, consider a medical trial in which researchers wish to evaluate the efficacy of flu vaccination. While researchers would not have access to an individual’s compliance for this year’s flu vaccination, they could have a measure of whether or not individuals took the flu shot in previous years. While we cannot directly generalize compliance patterns using the proxy measure of compliance to our current study without further assumptions, we can use the proxy measure as a way to evaluate the validity of our underlying identifying assumptions.
More formally, let
$\widetilde C$
 represent a proxy measure of compliance. Assuming no always takers, we can directly compute
${\mathbb {P}}(\widetilde C = 1 \,|\, S = 0).$
 For example, this could represent the proportion of compliers based on the previous year’s vaccine behavior. We can then compare
${\mathbb {P}}(\widetilde C = 1 \,|\, S = 0)$
 to our estimate of the overall proportion of compliers in the target population, represented by
$\mathbb {E}_{X {\,|\,} S=0}[\mu _{d1}(X)-\mu _{d0}(X)].$
 While a large discrepancy between the two does not necessarily imply the violation of the underlying identifying assumptions, it does serve as a potential signal that the underlying pre-treatment covariates X may not be sufficiently generalizing the underlying compliance patterns.
5.2 Sensitivity analysis
In order to identify the T-CACE, we introduced two different mean exchangeability assumptions (i.e., Assumptions 2 and 4). In practice, this can be a tenuous assumption to leverage, as the set of covariates researchers tend to have access to across both the study sample and the target population can be relatively limited. Furthermore, it can be implausible to evaluate whether these assumptions hold in practice. In this section, we propose a sensitivity analysis framework for researchers to evaluate the underlying sensitivity in their T-CACE estimates to potential omitted variables.
To begin, we define a latent or unmeasured covariate U such that, if researchers additionally accounted for U, mean exchangeability of both treatment effect heterogeneity and the first stage would hold.
Assumption 6 Mean exchangeability of selection and treatment effect heterogeneity with unmeasured confounders

Similarly, we assume the same for the treatment received.
Assumption 7 Mean exchangeability of the first stage with unmeasured confounders

Assumptions 6 and 7 do not aid in constructing a weighted estimator for identifying T-CACE, as the correct weights cannot be estimated due to the unobserved
$U.$
 In what follows, we propose a sensitivity analysis procedure to assess the robustness of the weighted estimators to the presence of an omitted U. For simplicity, we focus on the weighted estimator, although the procedure can be easily extended to the weighted least squares estimator. Throughout the section, we assume that Assumptions 6 and 7 hold.
To begin, define the oracle weights as

The magnitude of the gap between the estimable weights (
$w_z(X)$
 ) and the oracle weights will depend directly on how imbalanced U is between the study sample and target population (Huang and Pimentel Reference Huang and Pimentel2025). When there is a greater degree of imbalance in U between the study sample and the target population, the difference between
$w_z(X)$
 and
$w^*_z(X,U)$
 will be larger. The bias in the overall T-CACE estimate will depend on how the imbalance in U is related to both the treatment effect heterogeneity as well as the first stage (i.e., differences in treatment received—
$D(1) - D(0)$
 ).
Following Zhao et al. (Reference Zhao, Small and Bhattacharya2019), we assume that the gap between the oracle weights and the estimable weights can be constrained by some constant
$\Gamma \geq 1$
 .
Assumption 8 Marginal sensitivity model
For some constant
$\Gamma \geq 1$
 ,

The marginal sensitivity model assumes that the worst-case error from omitting U in the weights can be bounded (Nie, Imbens, and Wager Reference Nie, Imbens and Wager2021; Zhao et al. Reference Zhao, Small and Bhattacharya2019). A larger
$\Gamma $
 implies a greater degree of potential confounding. For a fixed
$\Gamma $
 value, we can bound the range of possible values of the T-CACE by minimizing and maximizing the estimand with respect to the oracle weights
$w^*$
 over
$\varepsilon (\Gamma )$
 . This is a high-dimensional non-convex optimization problem, which is NP-hard and computationally intractable (Snoek et al. Reference Snoek2015). We instead solve a computationally tractable problem that provides a conservative bound of the original problem. See Section E.3 of the Supplementary Material for details on the estimation problem.
In practice, we recommend researchers recompute the range of possible T-CACE estimates for increasing
$\Gamma \geq 1$
 values to find the threshold
$\Gamma ^*$
 value that results in an interval that includes zero. This implies that for a
$\Gamma = \Gamma ^*$
 value, the unmeasured confounders U could be sufficiently strong to result in a statistically insignificant T-CACE. A relatively small
$\Gamma ^*$
 (i.e., close to 1) implies that the estimated T-CACE is highly sensitive to potential omitted variables. We provide a benchmarking approach in Section H.1 of the Supplementary Material, which allows researchers to use observed covariate data to calibrate plausible
$\Gamma $
 values.
5.3 Evaluating validity of the IV
The sensitivity analysis proposed in the previous section allows researchers to consider potential violations in the mean exchangeability assumptions. To help researchers evaluate the other necessary assumptions (i.e., Assumption 3), we extend existing IV tests for the external validity context. More specifically, there is a growing literature (e.g., Kitagawa Reference Kitagawa2015; Mourifié and Wan Reference Mourifié and Wan2017; Yu Reference Yu2025) on evaluating instrument validity. We focus specifically on an approach proposed by Kitagawa (Reference Kitagawa2015), which derives a testable observable implication that holds when the IV is valid in the study sample and shows that this implication is sharp—that is, no other feature of the study-sample data can provide additional information for ruling out invalid instruments. In Section G.2 of the Supplementary Material, we provide a sample assignment ignorability condition under which the study-sample observable implications can be transported to the target population. Under this condition, we apply the approach in Kitagawa (Reference Kitagawa2015) to test Assumption 3. We then discuss directions for researchers in cases where these tests fail in Section G.3 of the Supplementary Material. We emphasize that the proposed IV tests are falsification tests, in the sense that they can provide evidence that an IV is not valid; however, failure to reject the tests should not be interpreted as evidence that the IV is valid.
6 Simulation study
We now illustrate the performance of the proposed estimators in a series of simulations. We show that when mean exchangeability of treatment effect heterogeneity and mean exchangeability of the first stage hold, all three proposed weighted estimators will be consistent estimators for the T-CACE. Furthermore, our proposed variance estimators provide nominal coverage across the different simulation settings. Compared to the weighted estimator, the WLS and the multiply robust estimators exhibit lower variance, demonstrating their potential utility in practice for efficiently estimating the T-CACE.
6.1 Simulation set-up
We provide an overview of the simulation set-up, with details in Section F.1 of the Supplementary Material. We generate the sample selection indicator as
$S_i{\,|\,} X_i \sim \text {Bernoulli}\left \{\sigma \left (r' \cdot \sum _{j=1}^{10}X^{j}_i\right )\right \},$
 where
$r'$
 is a hyperparameter that controls the ratio of the study sample size to the combined size of the study sample and target population, and the covariates X follow a Uniform distribution (i.e.,
$X_i \in \mathbb {R}^{10}$
 , where
$X^{j}_i \overset {i.i.d.} {\sim } \text {Unif}(-0.3, 0.5)$
 for
$j \in \{1, \ldots , 10\}$
 ). For each
$n + N \in \{1,500, 5000, 10000\},$
 we set
$r' \in \{1, 0.2, -0.4, -1.5\},$
 so that the ratio of the study sample size to the combined size of the study sample and target population is approximately
$0.71, 0.55, 0.40$
 and
$0.23$
 . We generate the compliance type
$C_i$
 for each unit i from a multinomial logit model on
$X_i$
 .
Finally, the outcome is a linear combination of the treatment received, the covariates and interaction terms:

Throughout this section, we consider a completely randomized treatment indicator
$Z_i \sim \text {Bernoulli}(0.5)$
 . We consider an observational setting in Section F.3 of the Supplementary Material. For each pair of
$(n + N, r')$
 , we estimate the following estimators: the weighted estimator
$\widehat {\tau }_{w},$
 the WLS estimator
$\widehat {\tau }_{\text {wls}},$
 the multiply robust estimator
$\widehat {\tau }_{\text {mr}}$
 and the weighted ITT estimator that does not account for compliance (i.e.,
$\widehat {\tau }_{w}^Y$
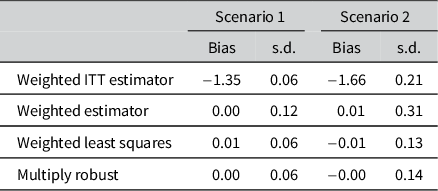
 ). We repeat each scenario for 1,000 total iterations. Table 1 displays the results for the four estimators when
$N + n = 5,000$
 , under two settings where
$n/(n + N) \approx 0.71$
 or
$n/(n + N) \approx 0.23$
 .
The bias and standard deviations of the weighted estimator, WLS estimator, multiply robust estimator and the weighted ITT estimator

Table 1 Long description
We compare the bias/standard deviations of the weighted ITT estimator, weighted T-CACE estimator, weighted least squares T-CACE estimator, and a multiply robust estimator. The weighted ITT estimator is biased, while the other 3 are unbiased across the simulations. We see that WLS and multiply robust perform comparably and provide some efficiency improvements over just weighting.
Note: The results are based on 1,000 trials with a total sample size of
$N + n = 5,000$
 . Scenario 1 represents
$n/(n + N) \approx 0.71$
 , while scenario 2 corresponds to
$n/(n + N) \approx 0.23$
 .
6.2 Simulation results
Overall, we see that the mean errors of
$\widehat {\tau }_{w}, \widehat {\tau }_{\text {wls}}$
 and
$\widehat {\tau }_{\text {mr}}$
 are negligible, highlighting the consistency of the underlying estimators. The weighted ITT estimator that does not account for compliance is biased downward, suggesting that the causal effect is stronger among the compliers in the target population. Furthermore, the WLS and multiply robust estimators exhibit substantially smaller variances than the weighted estimator.
Finally, we evaluate the performance of the different estimators under more complex settings. Section F.2 of the Supplementary Material compares the performance of the principal stratification estimators defined in Theorem 2 of Clark et al. (Reference Clark, Rott, Hodges and Huling2024) with the WLS estimators. We find that in scenarios where principal ignorability is violated due to unmeasured confounders affecting both treatment received and outcome, the WLS estimator remains robust as the dimensionality of the unobserved variables increases, while the principal stratification estimator suffers from systematic bias. In Section F.3 of the Supplementary Material, we conduct extensive experiments under the setting of an observational study. We further evaluate the proposed sensitivity analysis framework in Section F.4 of the Supplementary Material.
7 Empirical application: Reducing exclusionary attitudes through deep canvassing
We now return to the motivating example of reducing exclusionary attitudes through deep canvassing. We consider two different settings. The first generalizes the CACE to participants who failed to complete the follow-up survey, but initially opted into the experiment. The second considers generalizing to the set of voters who did not opt into the experiment to begin with. Since voters were randomized at the household level, we adjust the variance estimator to account for within-household dependence (see Section H.2 of the Supplementary Material for details).
7.1 Setting 1: Generalizing to participants who did not take the follow-up survey
We begin by generalizing the results to the set of participants who did not take the follow-up survey. While we have a measure of compliance for some of the individuals in the target group, we do not have access to their outcomes. For each voter, we have access to 33 total pre-treatment covariates that include demographic information, such as age, gender, past electoral participation as well as 25 survey items measuring immigrant-related opinions prior to treatment. We apply our weighted estimator and WLS estimator to generalize the CACE from the study sample to these participants.
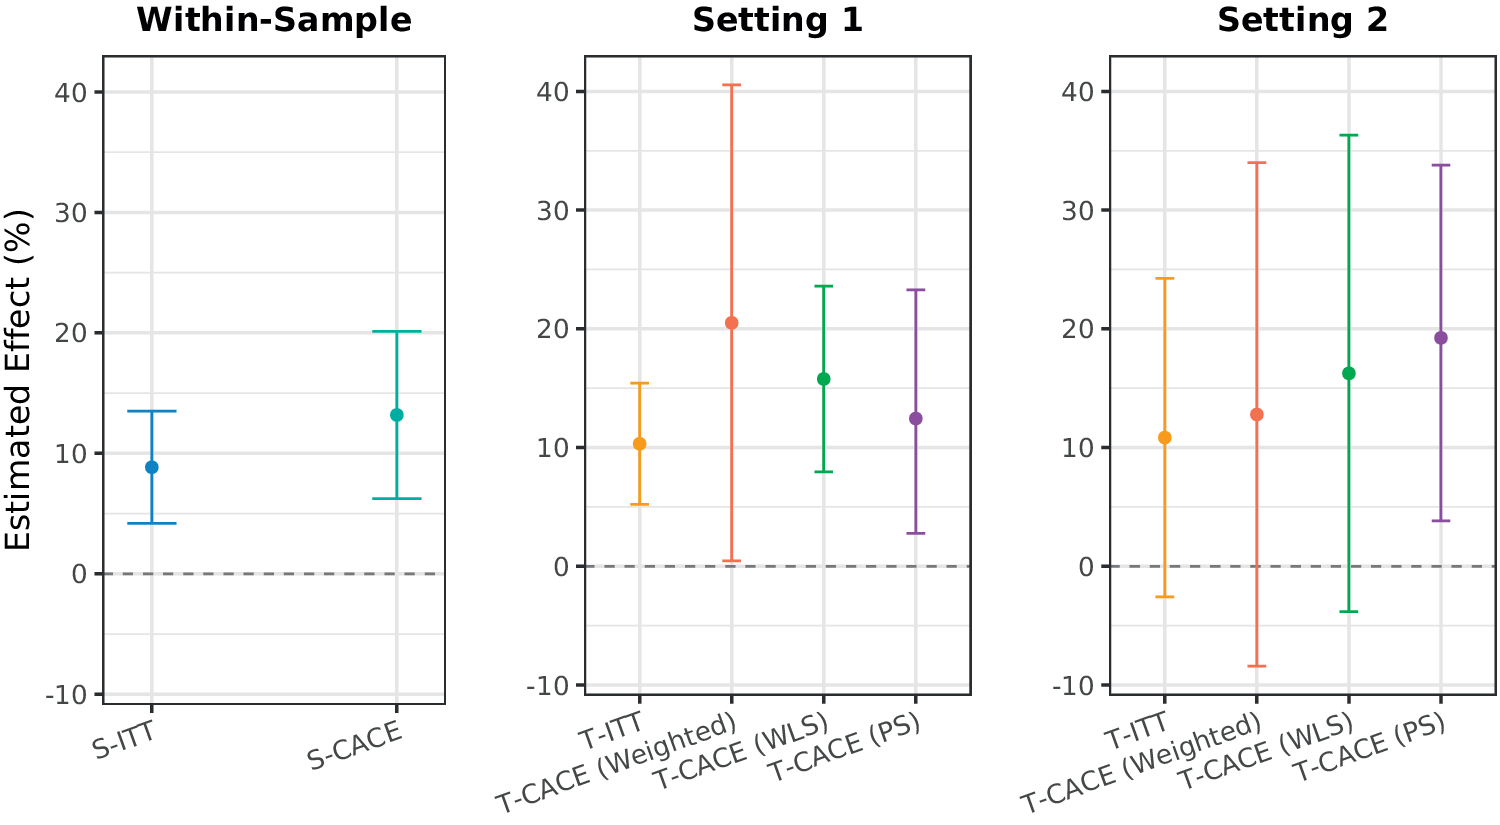
The estimated T-CACEs range from 12% to 20%. Notably, the results for the weighted and WLS T-CACE estimators are statistically significant at the 5% level. We also include the principal stratification estimator (weighted [PS]) introduced in Section F.2 of the Supplementary Material, which is based on the principal ignorability assumption. It provides a comparable estimate to our methods:
$(12.4\%; [2.8, 23.3]).$
 Taken together, these estimates provide robust evidence that deep canvassing positively influenced the target index, with some variation in magnitude across estimation methods. The generalized CACE in this context is larger than the generalized ITT
$(10.3\%; [5.2, 15.4])$
 and comparable to the within-sample CACE estimate
$(13.2\%; [6.2,20.1]).$
 This suggests that the estimated treatment effect on support for unauthorized immigrants from deep canvassing generalizes well to the population of individuals who failed to participate in the follow-up survey.
7.2 Setting 2: Generalizing to voters who did not participate in the experiment
We now consider the harder task of generalizing to the set of individuals who did not respond to the initial recruitment survey. This consists of 209,730 registered voters. Unlike the first setting, we are restricted to basic demographics, as the individuals who did not participate in the experiment failed to complete the baseline survey. As a result, we can only adjust for age, gender, location and past electoral participation history.
In contrast to the first setting, we find that, except for the PS estimator, T-CACE estimates are all statistically insignificant at the 5% level. We conclude that among the 209,730 voters who did not participate in the experiment, the impact of deep canvassing remains unclear at the 5% significance level. The larger intervals are likely due to the greater degree of imbalance between the study sample’s units and the target. This is in line with what we would expect intuitively, as there likely is a greater degree of distribution shift between individuals who did not participate at all in the experiment than those who initially participated, but failed to participate in the follow-up survey (i.e., Setting 1).
Figure 1 summarizes the results for these two settings, as well as the estimated within-sample effects, with numerical results in Table 7 in Section H.2 of the Supplementary Material. We provide an illustration of the sensitivity analysis in Section H.1 of the Supplementary Material.
Plot of various estimates and 95% confidence intervals for the deep canvassing application. The leftmost panel shows the within-sample effects. The middle panel displays results for participants who did not take the follow-up survey. The rightmost panel presents estimates for participants who did not participate in the experiment at all. We use the prefix “S-” to denote within-sample estimates and “T-” to denote the corresponding target quantities of interest.

Figure 1 Long description
The left-most panel shows the within-sample effects. The middle panel displays results for participants who did not take the follow-up survey. The right-most panel presents estimates for participants who did not participate in the experiment at all. Depending on the estimator used, the estimated T-CACE's vary in magnitude.
8 Conclusion
In this article, we address the critical challenge of generalizing the CACE from a study sample to a target population. Our contributions are threefold. First, we derive the identifying assumptions to identify the T-CACE using IVs. Second, we propose a set of estimators that allow researchers to efficiently estimate the T-CACE. We extend the framework to consider settings in which researchers have access to auxiliary compliance information across the target population. Finally, we introduce a sensitivity analysis to evaluate the robustness of the T-CACE estimators to potential violations in the underlying identification assumptions. We apply our results to a deep canvassing experiment and show that there is statistical evidence that the efficacy of deep canvassing on reducing prejudice generalizes to the set of individuals who could not be reached in a follow-up survey.
There are several interesting avenues of future research. First, Clark et al. (Reference Clark, Rott, Hodges and Huling2024) introduce an alternative set of identification assumptions using principal ignorability, which requires that researchers can feasibly model the compliance pattern across both the study sample and the target population. In contrast, our article has largely focused on an IV approach. Future work could consider how to reason about the plausibility of both sets of assumptions in practice.
Second, in settings when there are high rates of noncompliance, treatment assignment will become a weak instrument (e.g., Hartman and Huang Reference Hartman and Huang2024), which results in large amounts of efficiency loss, even in estimating the within-sample CACE. Concerns about weak instruments are amplified in generalization contexts, where reweighting the study sample can result in further efficiency loss (e.g., Miratrix et al. Reference Miratrix, Sekhon, Theodoridis and Campos2018). An interesting avenue of future work could consider how to mitigate concerns about weak instruments, specifically in the context of generalizing the CACE.
Finally, the proposed framework is designed for generalizability and should not be applied directly to transportability problems involving distinct underlying populations or settings. Extending the identification and estimation framework to such transportability settings represents an important direction for future research.
Acknowledgments
The authors would like to thank Erin Hartman, Emily Flanagan and participants at the American Causal Inference Conference for helpful feedback.
Data availability statement
The data and code required to reproduce the analyses in this article, with the exception of the third-party deep-canvassing data of Kalla and Broockman (Reference Kalla and Broockman2020) (which cannot be redistributed under its Harvard Dataverse terms of use and must be obtained directly from https://doi.org/10.7910/DVN/8BFYQO), are available at the Political Analysis Dataverse within the Harvard Dataverse Network: https://doi.org/10.7910/DVN/WTAJKI (Chen and Huang Reference Chen and Huang2026).
Author contributions
Z.C. and M.H. designed the research, performed the research, analyzed the data and wrote the article.
Competing interests
The authors declare none.
Ethical standards
The research meets all ethical guidelines, including adherence to the legal requirements of the study country.
Supplementary material
The supplementary material for this article can be found at https://doi.org/10.1017/pan.2026.10063.


 Open access

