INTRODUCTION
Killer whales (Orcinus orcus, Linnaeus 1758) occupy high trophic levels in marine ecosystems (Jefferson et al., Reference Jefferson, Stacey and Baird1991), preying on a diverse range of species including fish, cephalopods, sea turtles, seabirds and marine mammals (Forney & Wade, Reference Forney, Wade, Estes, Demaster, Doak, Williams and Brownell2006). While this broad prey range is reflected in generalist diets of some killer whales, for example, in waters off Hawaii (Baird et al., Reference Baird, McSweeney, Bane, Barlow, Salden, Antoine, LeDuc and Webster2006), New Zealand (Visser, Reference Visser2000) and South Africa (Best et al., Reference Best, Meÿer and Lockyer2010), several killer whale populations worldwide comprise distinct ecotypes or forms with more restricted prey preferences (Ford et al., Reference Ford, Ellis, Barrett-Lennard, Morton, Palm and Balcomb1998; Saulitis et al., Reference Saulitis, Matkin, Barrett-Lennard, Heise and Ellis2000; Pitman & Ensor, Reference Pitman and Ensor2003; Burdin et al., Reference Burdin, Hoyt, Sato, Tarasyan and Filatova2004; Foote et al., Reference Foote, Newton, Piertney, Willerslev and Gilbert2009; Ford et al., Reference Ford, Ellis, Matkin, Wetklo, Barrett-Lennard and Withler2011). As apex predators, killer whales can potentially exert important top-down regulation on prey populations (e.g. Estes et al., Reference Estes, Tinker, Williams and Doak1998, but see Kuker & Barrett-Lennard, Reference Kuker and Barrett-Lennard2010), and conversely, highly specialized foraging leading to dependence on a narrow range of prey can introduce bottom-up control on killer whale population dynamics (Ford et al., Reference Ford, Ellis, Olesiuk and Balcomb2010). Understanding killer whale foraging behaviour is, therefore, essential to understanding structure and function of marine ecosystems in which they occur.
In the Eastern Canadian Arctic (ECA), where killer whales occur seasonally during the open-water period from July to September, killer whales have been documented feeding on narwhal (Monodon monoceros), beluga (Delphinapterus leucas) and bowhead (Balaena mysticetus) whales, as well as several seal species (Reeves & Mitchell, Reference Reeves and Mitchell1988; Higdon et al., Reference Higdon, Hauser and Ferguson2011). Although marine mammals have been the only confirmed prey of killer whales in the ECA (Higdon et al., Reference Higdon, Hauser and Ferguson2011; Ferguson et al., Reference Ferguson, Higdon and Westdal2012a), evidence suggests killer whales in Davis Strait off western Greenland also forage on fish (Heide-Jorgensen, Reference Heide-Jørgensen1988; Laidre et al., Reference Laidre, Heide-Jorgensen and Orr2006). In adjacent regions of the north-west Atlantic (NWA), killer whales off the coast of Newfoundland and Labrador have been documented pursuing or feeding on both marine mammals and fish, including humpback (Megaptera novaeangliae) and minke whales (Balaenoptera acutorostrata), beluga, white-beaked dolphins (Lagenorhynchus albirostris), seals, seabirds and herring and tuna (Sergeant & Fisher, Reference Sergeant and Fisher1957; Whitehead & Glass, Reference Whitehead and Glass1985; Lawson et al., Reference Lawson, Stevens and Snow2008).
Although the broad prey range taken by whales across the ECA and NWA suggests they may be generalist predators, assessment of the degree of individual diet specialization within this population(s) is impeded by a lack of individual foraging records over time. Increasingly, stable isotope (SI) analysis of dentine layers in marine mammal teeth is being used to reconstruct chronological diet records over periods not possible through direct observation. Dentine is laid down in discrete annual growth layer groups (GLGs) consisting of inorganic (hydroxyapatite) and organic (mainly collagen) components derived from diet (Hobson & Sease, Reference Hobson and Sease1998; Walker & Macko, Reference Walker and Macko1999). Post-depositional alteration of dentine does not occur (Bloom & Fawcett, Reference Bloom and Fawcett1975), so dentine GLGs represent a lifelong chronological archive along the axis of tooth growth.
Isotopic analysis of sequentially sampled dentine GLGs in marine mammal teeth has revealed ontogenetic distribution and diet patterns (e.g. Hobson & Sease, Reference Hobson and Sease1998; Mendes et al., Reference Mendes, Newton, Reid, Zuur and Pierce2007a, Reference Mendes, Newton, Reid, Frantzis and Pierceb; Martin et al., Reference Martin, Bentaleb, Steelandt and Guinet2011; Riofrío-Lazo et al., Reference Riofrío-Lazo, Aurioles-Gamboa and Le Boeuf2012), as well as individual diet preferences (e.g. Newsome et al., Reference Newsome, Etnier, Monson and Fogel2009). Trophic position can be inferred from nitrogen isotope composition (δ15N), owing to metabolic fractionation causing consistent 15N enrichment in consumer tissue relative to prey (DeNiro & Epstein, Reference DeNiro and Epstein1981). Incorporation of dietary carbon into consumer tissue occurs with less isotopic fractionation (DeNiro & Epstein, Reference DeNiro and Epstein1978), such that more conservative carbon isotope composition (δ13C) across trophic levels primarily reflects underlying biogeochemical processes at the base of the food web. Foraging patterns of marine predators over several spatial scales have been inferred from tissue δ13C values (Cherel & Hobson, Reference Cherel and Hobson2007; Mendes et al., Reference Mendes, Newton, Reid, Zuur and Pierce2007a), which can reflect differences between benthic vs pelagic (France, Reference France1995) and coastal vs offshore (Walker et al., Reference Walker, Potter and Macko1999) environments, as well as latitudinal δ13C gradients (e.g. Rau et al., Reference Rau, Sweeney and Kaplan1982).
Isotopic composition across dentine GLGs of wide-ranging marine mammals also integrates δ15N variation at the base of the food web during movements among regions with isotopically distinct source nitrogen, which can confound trophic interpretations of δ15N values. Bulk tissue δ15N measurements cannot differentiate between baseline δ15N variation, which can exceed 5–10‰ across ocean basins (Montoya et al., Reference Montoya, Carpenter and Capone2002; Graham et al., Reference Graham, Koch, Newsome, McMahon, Aurioles, West, Bowen, Dawson and Tu2010), and that due to trophic 15N enrichment, which typically ranges from 3–5‰ with each trophic transfer (Minagawa & Wada, Reference Minagawa and Wada1984; McCutchan et al., Reference McCutchan, Lewis, Kendall and McGrath2003). While the two sources of tissue δ15N variation can be decoupled by characterizing primary producer or consumer δ15N values, baseline isotopic variation cannot be independently and retroactively resolved across the considerable spatial and temporal scales over which dentine deposition occurs in highly mobile, long-lived species.
Recent studies have shown that compound specific isotope analysis of individual amino acids (AA-CSIA) can be used to constrain baseline influences on bulk tissue δ15N values. Certain amino acids (‘source’ AAs, sensu Popp et al., Reference Popp, Graham, Olson, Hannides, Lott, López-Ibarra, Galván-Magaña, Fry, Dawson and Siegwolf2007) undergo little consumer modification and retain the isotopic value of source nitrogen, while kinetic isotope fractionation during transamination and deamination reactions causes consistent 15N enrichment in other AAs (‘trophic’ AAs, sensu Popp et al., Reference Popp, Graham, Olson, Hannides, Lott, López-Ibarra, Galván-Magaña, Fry, Dawson and Siegwolf2007) (Gaebler et al., Reference Gaebler, Vitti and Vukmirovich1966; McClelland & Montoya, Reference McClelland and Montoya2002; Chikaraishi et al., Reference Chikaraishi, Kashiyama, Ogawa, Kitazato and Ohkouchi2007, Reference Chikaraishi, Ogawa, Kashiyama, Takano, Suga, Tomitani, Miyashita, Kitazato and Ohkouchi2009). AA-CSIA can, therefore, be used to constrain baseline δ15N variation of a consumer's foraging habitat via source AA δ15N, and subsequent comparison against trophic AA δ15N allows for internal calibration of trophic position (e.g. McClelland & Montoya, Reference McClelland and Montoya2002; Popp et al., Reference Popp, Graham, Olson, Hannides, Lott, López-Ibarra, Galván-Magaña, Fry, Dawson and Siegwolf2007; Chikaraishi et al., Reference Chikaraishi, Ogawa, Kashiyama, Takano, Suga, Tomitani, Miyashita, Kitazato and Ohkouchi2009). AA-CSIA has been applied in foraging studies of a growing number of marine consumer taxa, including invertebrates (Schmidt et al., 2004; Hannides et al., Reference Hannides, Popp, Landry and Graham2009; O'Malley et al., Reference O'Malley, Drazen, Popp, Gier and Toonen2012), teleost fish and elasmobranchs (Popp et al., Reference Popp, Graham, Olson, Hannides, Lott, López-Ibarra, Galván-Magaña, Fry, Dawson and Siegwolf2007; Dale et al., Reference Dale, Wallsgrove, Popp and Holland2011; Choy et al., Reference Choy, Davison, Drazen, Flynn, Gier, Hoffman, McClain-Counts, Miller, Popp, Ross and Sutton2012), sea turtles (Seminoff et al., Reference Seminoff, Benson, Arthur, Eguchi, Dutton, Tapilatu and Popp2012) and seabirds (Lorrain et al., Reference Lorrain, Graham, Ménard, Popp, Bouillon, van Breuel and Cherel2009), but has not been rigorously validated for marine mammals (e.g. Germain et al., Reference Germain, Koch, Harvey and McCarthy2013).
Increases in killer whale sightings in both the ECA and NWA over the past several decades (Higdon & Ferguson, Reference Higdon and Ferguson2009; Lawson & Stevens, Reference Lawson and Stevens2013), along with anticipated range expansions accompanying reductions in sea ice extent (Higdon & Ferguson, Reference Higdon and Ferguson2009), have underscored the need for a better understanding of killer whale predation in these regions (e.g. Ferguson et al., Reference Ferguson, Kingsley and Higdon2012b). To that end, we measured bulk dentine isotopic composition across GLGs of ECA/NWA killer whales (N = 13), followed by AA-CSIA to constrain potential baseline isotope influences on bulk δ15N values. Our combined bulk and AA-specific isotope analyses allowed us to assess individual isotopic profiles over periods up to 25 yr, and evaluate relative foraging behaviour among individuals and between regions.
MATERIALS AND METHODS
Killer whale tooth specimens
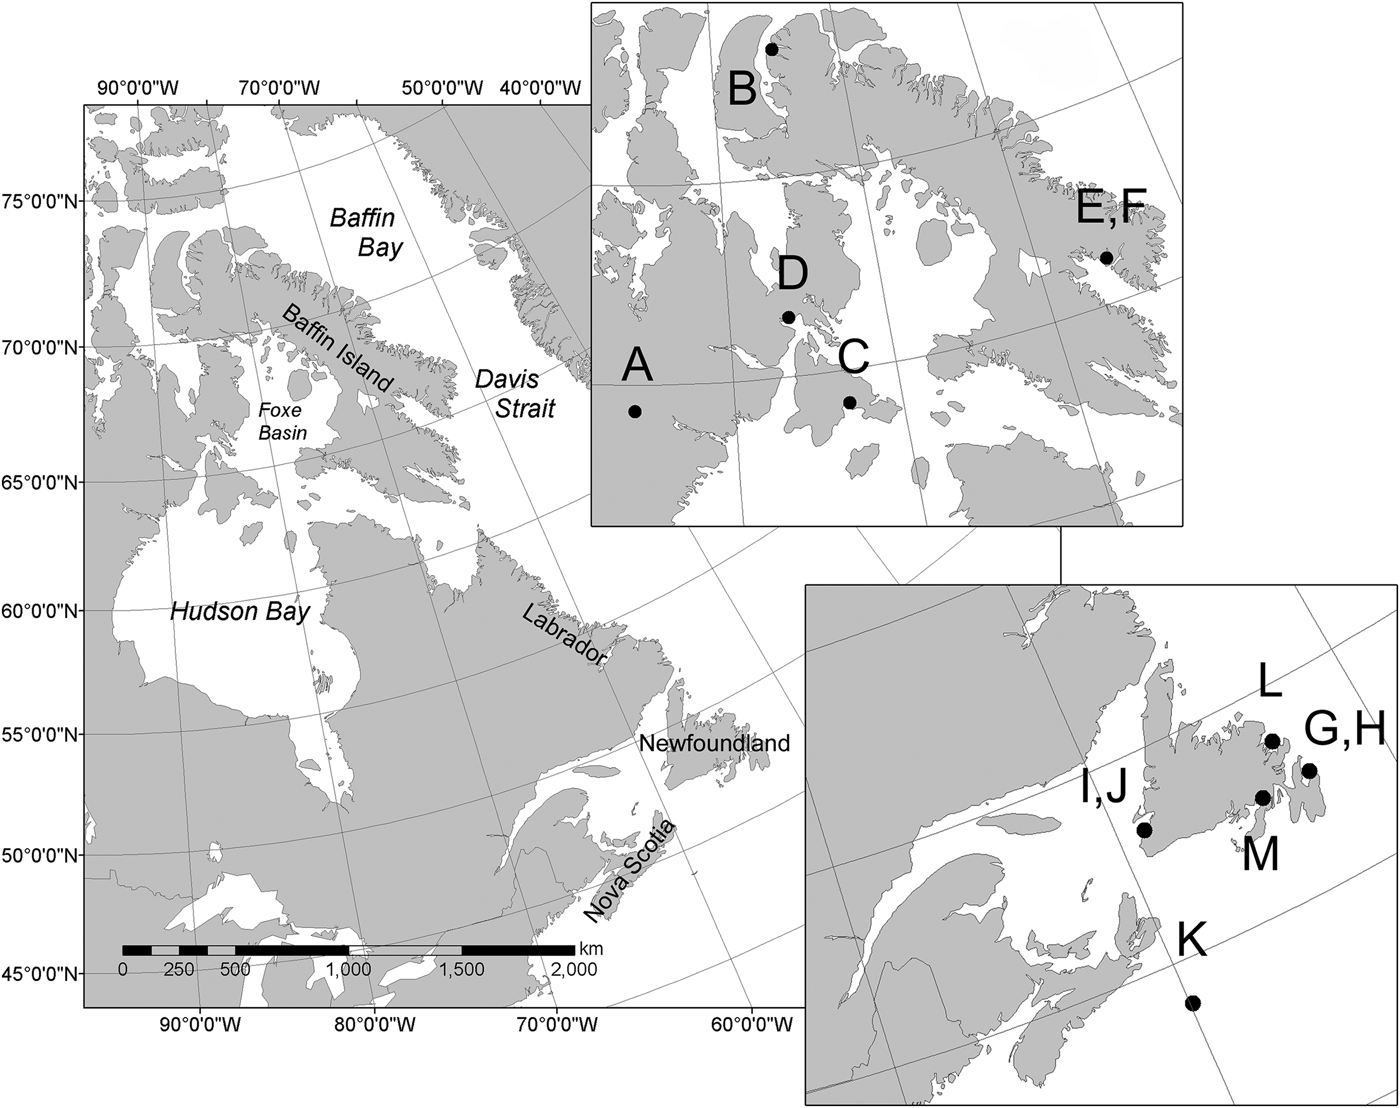
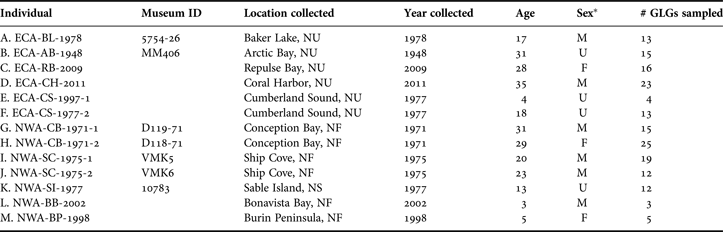
Teeth were collected opportunistically from stranded killer whales across the ECA (N = 6) and NWA (N = 7) over several decades (1948–2011), including Cumberland Sound, Hudson Bay/Foxe Basin, Admiralty Inlet, south-western and south-eastern Newfoundland and Sable Island, Nova Scotia (Figure 1). When possible, large teeth with minimal occlusal wear were selected to maximize the number of GLGs available for sampling. All teeth had been stored dry since collection. Although sex and body size measures were available for some individuals, relevant biological information was not available for all (Table 1). Killer whale population structure across the ECA and NWA remains unknown, and reference to individuals from either area solely reflects collection location without inference of broad population structure across the region.
Teeth used in this study were collected from killer whale specimens in various locations throughout the eastern Canadian Arctic (ECA) and north-west Atlantic (NWA) off the coasts of Newfoundland and Nova Scotia. Letters correspond to specimens listed in Table 1.

Estimated age and number of growth layer groups (GLGs) sampled for each Eastern Canadian Arctic (ECA) and north-west Atlantic (NWA) killer whale tooth, along with location and year sampled.
*, U, sex undetermined.
Tooth sectioning and ageing
Teeth were sectioned longitudinally to remove an approximately 2 mm thick section following the midline of each tooth. Sections were polished using 30 and 9 µm AlOx lapping film, then placed in 10% formic acid for 12 h to etch the polished surface and accentuate GLG definition. Sections were rinsed thoroughly with distilled water for several hours following formic acid treatment and air dried. Acid etching at the tooth's surface has been assumed not to influence isotope values of underlying dentinal collagen (Hobson & Sease, Reference Hobson and Sease1998; Newsome et al., Reference Newsome, Etnier, Monson and Fogel2009).
Annual dentine GLG deposition has been confirmed in killer whales through calibration of tetracycline labelled teeth with treatment history of captive individuals (Myrick et al., Reference Myrick, Yochem and Cornell1988), as well as comparisons of GLG counts with corpora counts in sexually mature females (Amano et al., Reference Amano, Yamada, Brownell and Uni2011) and GLG count with estimated age of a well-known wild killer whale (Mitchell & Baker, Reference Mitchell and Baker1980). Growth layers were observed under reflected light and counted three times by one reader over several weeks to estimate the age of each specimen. Successive readings typically differed by 1–3 GLGs, and the median of these measurements was recorded as the age (Table 1). Calendar year of GLG deposition was calculated from whale age and year of death to examine longitudinal isotopic trends.
Dentine collection and preparation
A high-resolution micromill (Merchantek) was used to collect dentine from within individual GLGs for bulk isotopic analysis. GLGs were milled using a 500 µm diameter carbide dental drill bit at a depth of 400–500 µm to prevent drilling into adjacent layers. Sampling started at the first visible GLG adjacent to the enamel/dentine interface and continued until GLG definition became uncertain or layers adjacent to the pulp cavity became too thin to mill (i.e. <500 µm wide), resulting in 3–25 GLGs sampled per tooth (Table 1). Myrick et al. (Reference Myrick, Yochem and Cornell1988) measured relatively constant dentinal deposition across all months in teeth of captive killer whales, so each sampled GLG is assumed to represent diet integrated over each year of the animal's life from birth year (first GLG sampled) to the final sampled GLG.
Given considerable spatial heterogeneity in δ15N values across the North Atlantic Ocean basin (Waser et al., Reference Waser, Harrison, Head, Nielsen, Lutz and Calvert2000; Graham et al., Reference Graham, Koch, Newsome, McMahon, Aurioles, West, Bowen, Dawson and Tu2010) and the potentially large range of ECA/NWA killer whales (Matthews et al., Reference Matthews, Luque, Petersen, Andrews and Ferguson2011), AA-CSIA was performed to constrain baseline isotope influences on bulk δ15N values. Consistent bulk collagen δ15N values across GLGs within individuals (see Results) allowed us to collect representative ‘whole-tooth’ dentine samples to provide sufficient material for AA-CSIA. Dentine was milled perpendicular to the axis of GLG growth using a 1 mm diameter drill bit, encompassing all GLGs except for the youngest three, which showed isotopic variation related to weaning (see Results).
Collagen was isolated from powdered dentine samples using repeated rinses (12 h each) of 0.25 N HCl at 4oC. Dentine was demineralized after two to three acid rinses, and remaining collagen was washed using successive rinses of deionized water. Samples were centrifuged between each rinse to minimize sample loss, and freeze-dried for 48 h after the final rinse. Collagen atomic C:N (mean ±sd = 2.9 ±0.1; range = 2.8–3.3) was within the range of unaltered collagen (DeNiro, Reference DeNiro1985), indicating adequate removal of inorganic carbon during acid rinses.
Stable isotope analysis
BULK STABLE ISOTOPE ANALYSIS
Growth layer group collagen samples (~0.5 mg) were weighed into tin cups for isotopic analysis on a Vario EL III elemental analyser (Elementar, Germany) interfaced with a DELTAplus XP isotope ratio mass spectrometer (Thermo, Germany) at the G.G. Hatch Stable Isotope Laboratory, University of Ottawa. Isotope ratios are reported in delta notation (δ; units are per mil, ‰), defined as δ15N or δ13C = (Rsample − Rstandard) / Rstandard) × 1000, where R is 15N/14N or 13C/12C. All isotope values are normalized to international standards (atmospheric N2 for δ15N and Vienna Pee-Dee Belemnite limestone for δ13C) calibrated through repeated measures of laboratory reference materials. Analytical precision based on repeated measures of reference material not used in calibrations was 0.05‰ for δ15N and 0.06‰ for δ13C, and that based on duplicate measures of ~15% of samples was 0.11 and 0.07‰ for δ15N and δ13C, respectively.
AMINO ACID COMPOUND SPECIFIC ISOTOPE ANALYSIS
Approximately 2.5–5.5 mg of each whole-tooth collagen sample was acid hydrolysed and derivitized to produce trifluoroacetic AA esters following procedures described in Dale et al. (Reference Dale, Wallsgrove, Popp and Holland2011). δ15N values of derivitized AAs were measured on a Thermo Scientific Delta V Plus mass spectrometer interfaced with Thermo Finnigan Trace GC gas chromatograph via a Thermo Finnigan GC-C III combustion/reduction system at the Stable Isotope Biogeochemistry Laboratory, University of Hawaii. All samples were analysed in triplicate and normalized relative to co-injected reference compounds of known isotopic composition (L-2-aminoadipic acid and L-(+)-norleucine). Co-elution and interference prevented measurement of some AAs, but reliable measurements were obtained for 13 individual AAs. Mean analytical precision based on repeated measures of the two reference compounds was 0.46‰, while that based on triplicate measures of each sample was 0.32‰ (range: 0.02–1.21‰). AA-specific δ15N values are reported relative to isotopic composition of atmospheric N2.
Data analysis
TEMPORAL ISOTOPIC TRENDS ACROSS GLGS
Potential sources of temporal SI variation across dentine GLGs include whale age, in terms of ontogenetic diet shifts (e.g. Newsome et al., Reference Newsome, Etnier, Monson and Fogel2009) and growth-related variation in diet–tissue SI discrimination (e.g. Trueman et al., Reference Trueman, McGill and Guyard2005), as well as variation in baseline SI over the broad timeframe represented by sampled GLGs. Generalized linear mixed effects models with random intercepts were used to assess bulk δ15N and δ13C profiles across GLGs with respect to these variables. The variable ‘decade’ (1920s–2000s) was constructed from calendar year of GLG formation and treated as a fixed effect, along with GLG (age). Whale identity was included as a random effect, allowing models to account for correlation of repeated measures within individuals. Models were run using the maximum likelihood method, and the best-fit model was selected based on ANOVA results comparing full and reduced models. Statistical significance was assessed at P < 0.05, and analyses were performed using the nlme package (Pinheiro et al., Reference Pinheiro, Bates, DebRoy and Sarkar2012) available for R software (R Core Team, 2012).
BULK ISOTOPIC VARIATION AMONG INDIVIDUALS
Differences in bulk δ15N and δ13C among individuals were assessed using one-way repeated measures ANOVA on rank-transformed data (Conover & Iman, Reference Conover and Iman1981) using the nlme package in R (Pinheiro et al., Reference Pinheiro, Bates, DebRoy and Sarkar2012), followed by Tukey's HSD post-hoc tests using the multcomp package in R (Hothorn et al., Reference Hothorn, Bretz and Westfall2008). The systematic decrease in δ15N values over the first three GLGs (see Results) was interpreted as a weaning signal (e.g. Newsome et al., Reference Newsome, Etnier, Monson and Fogel2009) and removed from each profile before further analysis to ensure comparison of diet after completion of nursing. This decision resulted in two individuals (ECA-CS-1977-1 and NWA-BB-2002) being dropped from the dataset due to their young age. The number of remaining GLGs for a third individual (NWA-BP-1998) was insufficient for statistical comparisons. Although killer whales show other ontogenetic SI patterns across dentine GLGs which may not be entirely diet-related (Newsome et al., Reference Newsome, Etnier, Monson and Fogel2009), we did not observe any clear age-related patterns beyond the first three GLGs. Comparisons among individuals, therefore, included entire profiles beyond the third GLG. We applied a post-hoc correction of 0.019‰ yr−1 to δ13C values (δ13Ccor) to account for the oceanic 13C Suess effect in the North Atlantic (Quay et al., Reference Quay, Sonnerup, Westsby, Stutsman and McNichol2003) over the period of GLG deposition.
AA-SPECIFIC δ15N–BASELINE δ15N AND TROPHIC POSITION INDICES
Because bulk and AA-specific isotopic measurements were conducted at different laboratories on differently sampled material (i.e. individual GLGs vs whole-tooth), we compared bulk collagen δ15N values with those calculated from individual AA δ15N values using a mass balance approach. The δ15N value of each individual AA was multiplied by its percentage contribution to total dentinal collagen nitrogen, which was determined from AA % composition of dentinal collagen (Eastoe, Reference Eastoe1963) multiplied by weight % N of each individual AA. Contributions of each individual AA, which together represented ~80.4% of total collagen N, were then summed. Correlation between calculated and measured bulk collagen δ15N values was determined using linear regression.
Source AAs phenylalanine, glycine, and serine, and trophic AAs alanine, leucine, proline, aspartic acid and glutamic acid were used to assess baseline and trophic contributions to bulk collagen δ15N patterns. To clarify baseline SI influences on bulk δ15N values, linear regression of mean bulk GLG δ15N values against mean source AA δ15N values was performed. Generalized linear mixed effects models with random intercepts and slopes were also fitted to rank-transformed source AA δ15N values (dependent variable) along groupings identified in Figure 3 (fixed effect), with whale identity set as a random effect to account for multiple AA measures from each individual. Tukey's HSD post-hoc tests were performed to identify pairwise differences. AA-CSIA also provided an additional check on temporal baseline δ15N variation over the timeframe of the study through linear regression of mean source AA δ15N values against calendar year. Regression analyses were performed using the R Stats Package (R Core Team, 2012).
Differences in trophic AA δ15N values among individuals were investigated using ANOVA as per source AA. Trophic position of marine consumers has been estimated using the difference in δ15N values of glutamic acid (δ15NGlu) and phenylalanine (δ15NPhe) using
 $${\rm Trophic}\;{\rm position} = \displaystyle{{\left({\delta ^{15} {\rm N}_{{\rm Glu} - } \delta ^{15} {\rm N}_{{\rm phe}} } \right) - {3.4} } \over {7.6}} + 1$$
to account for the isotopic difference between the two AAs in primary producers (β, 3.4‰) and trophic enrichment (TEFGlu-Phe, 7.6‰) (Chikaraishi et al., Reference Chikaraishi, Ogawa, Kashiyama, Takano, Suga, Tomitani, Miyashita, Kitazato and Ohkouchi2009). This calculation was derived largely from experimental studies on invertebrates and fish, and recent studies have suggested that a TEFGlu-Phe of 7.6‰ results in lower than anticipated trophic position estimates of higher marine consumers (Lorrain et al., Reference Lorrain, Graham, Ménard, Popp, Bouillon, van Breuel and Cherel2009; Dale et al., Reference Dale, Wallsgrove, Popp and Holland2011), including marine mammals (Germain et al., Reference Germain, Koch, Harvey and McCarthy2013). Given equation (1) also results in trophic position estimates too low for killer whales (see Results), we used simpler ‘trophic indices’ to compare relative trophic level differences among individual killer whales. We estimated relative trophic position using the difference in δ15N values of the primary trophic (glutamic acid) and source (phenylalanine) AAs (Δδ15NGlu-Phe) (McLelland & Montoya, Reference McClelland and Montoya2002; Chikaraishi et al., Reference Chikaraishi, Ogawa, Kashiyama, Takano, Suga, Tomitani, Miyashita, Kitazato and Ohkouchi2009), as well the difference in mean δ15N values of multiple trophic and source AAs (Δδ15NΣtrophic AA-Σsource AA) (e.g. McCarthy et al., Reference McCarthy, Benner, Lee and Fogel2007; Popp et al., Reference Popp, Graham, Olson, Hannides, Lott, López-Ibarra, Galván-Magaña, Fry, Dawson and Siegwolf2007; Hannides et al., Reference Hannides, Popp, Landry and Graham2009; Seminoff et al., Reference Seminoff, Benson, Arthur, Eguchi, Dutton, Tapilatu and Popp2012), which can compensate for uncertainty in any single AA measurement.
RESULTS
Temporal isotopic trends across GLGs
Decade of GLG formation was not retained as a significant predictor of δ15N values in generalized linear mixed effects models (P > 0.1), and there was no temporal trend in source AA δ15N values over the study period (linear regression, adj R2 –0.030, P > 0.4). δ13C values, on the other hand, showed a clear linear decline over the same period (data not shown), and decade of GLG formation was a significant predictor of δ13C values (P < 0.001). However, models did not retain decade as a significant explanatory variable of δ13Ccor (P > 0.2).
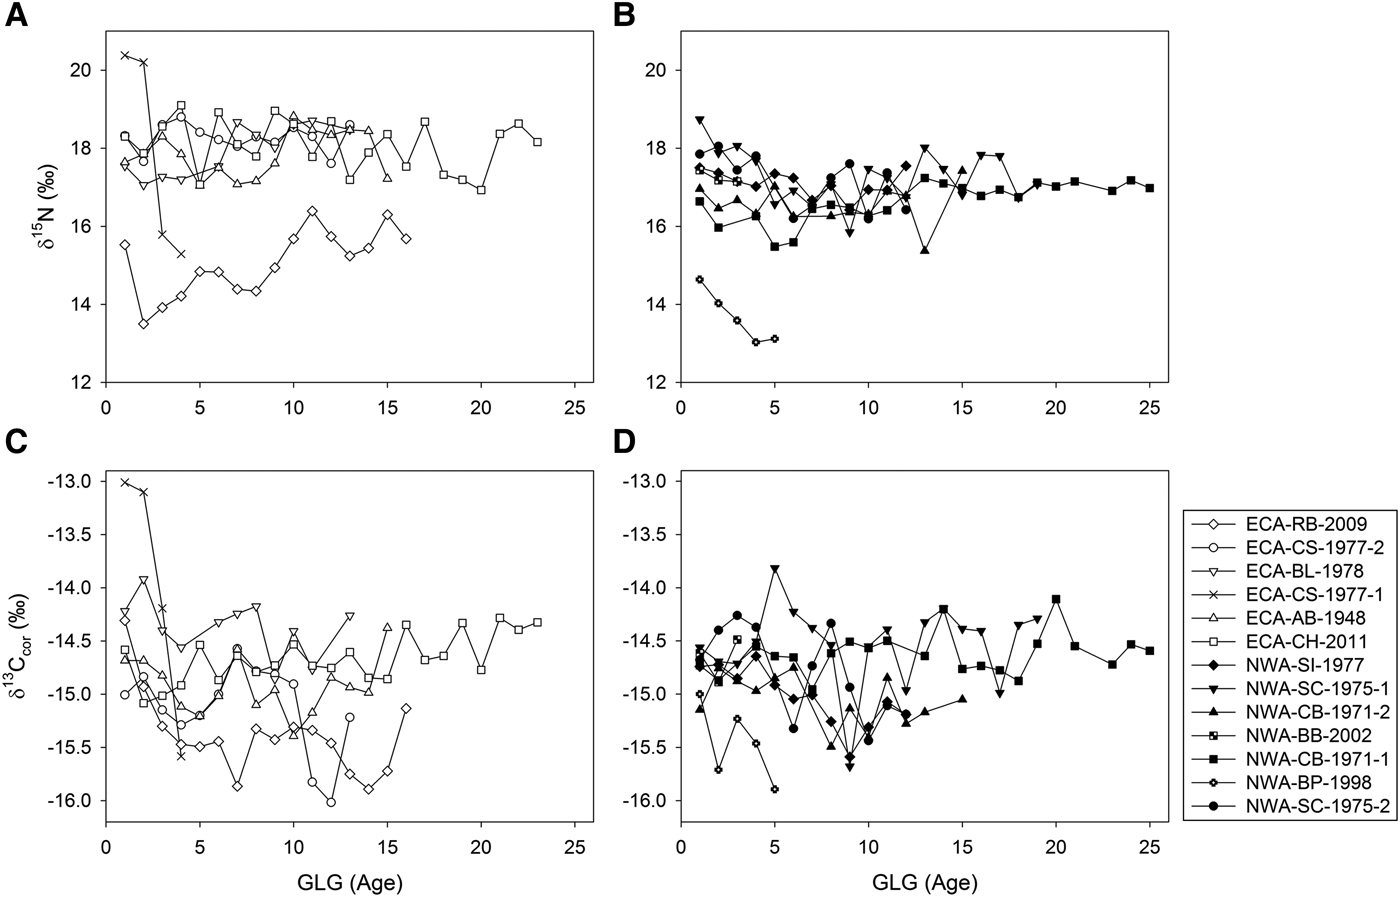
Best-fit generalized linear mixed effects models indicated GLG (age) was a significant predictor of δ15N values (P < 0.005), but not δ13Ccor values (P > 0.6). Teeth of most individuals showed a decrease in δ15N values over the first 1–3 GLGs of ~1 to 2‰ (Figure 2). Although adjacent GLGs differed by up to 2.1‰, no clear δ15N patterns were observed beyond the first three GLGs in most teeth. There were no discernible ontogenetic δ13Ccor patterns, although values differed by up to 1.1‰ between adjacent GLGs (Figure 2).
δ15N values of individual dentinal growth layer groups (GLGs) in teeth of eastern Canadian Arctic (ECA) (A) and north-west Atlantic (NWA) (B) killer whales show consistent long-term separation of individuals. Similar profiles for δ13Ccor values (post-hoc adjustment of 0.019‰ yr−1 to account for oceanic Suess effect; panels (C) and (D) show less distinction among individuals.
Bulk isotopic variation among individuals
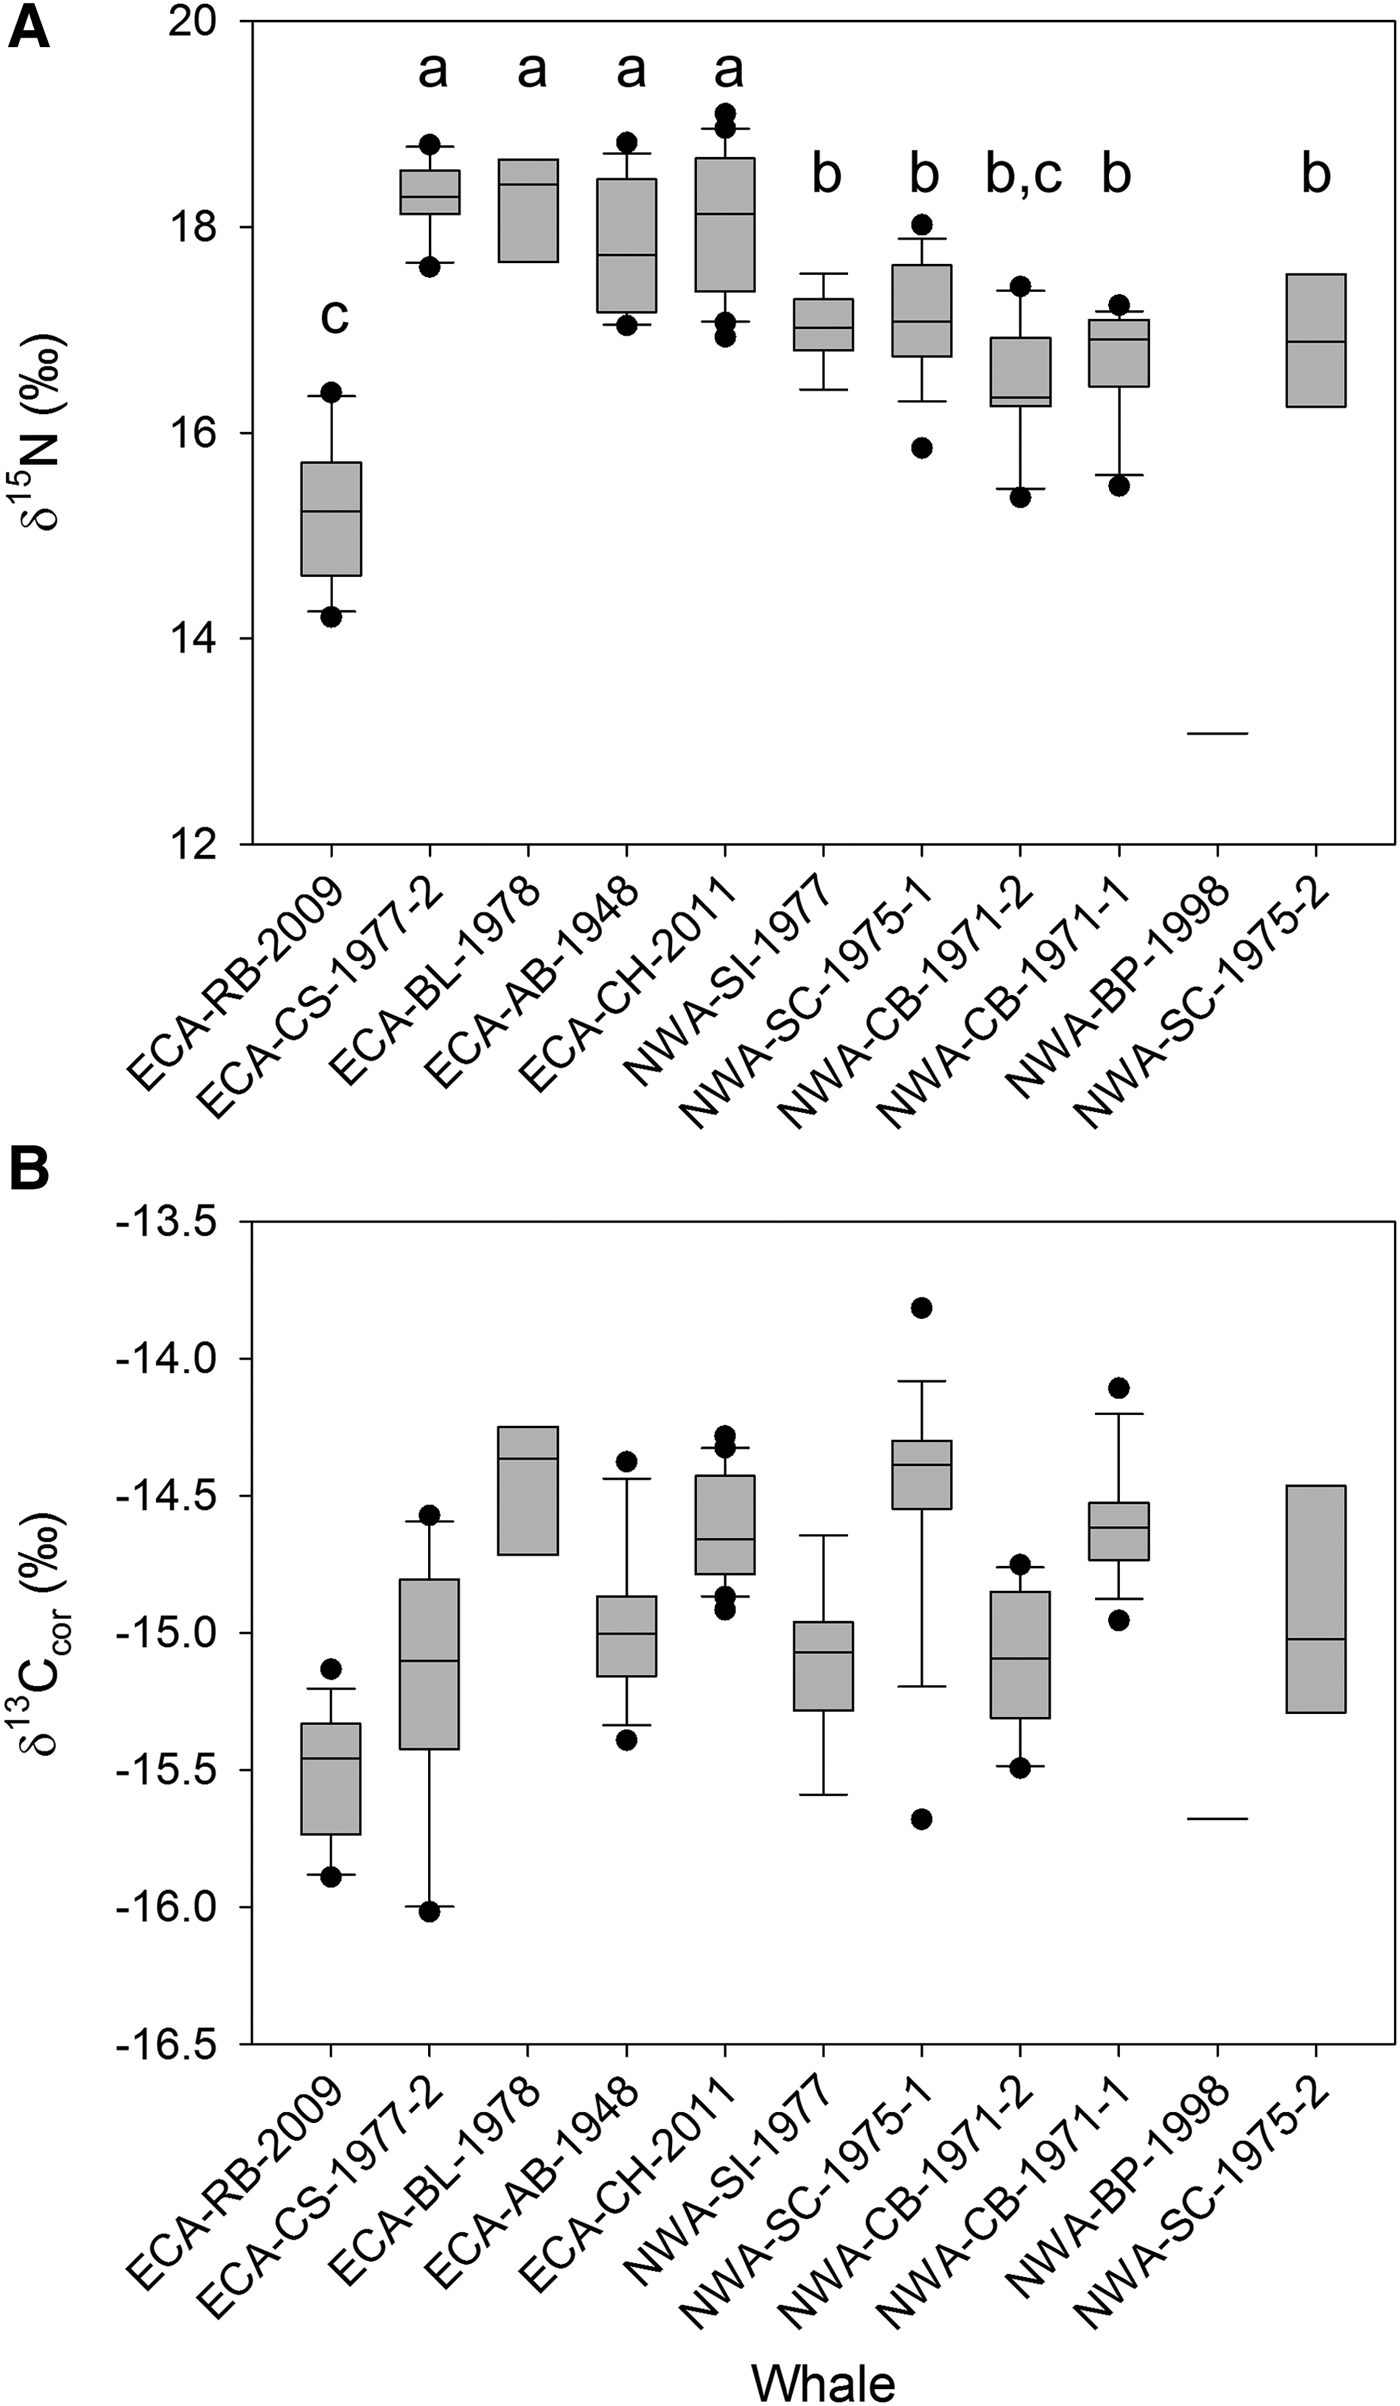
Bulk δ15N values differed among individuals (F = 29.91, P < 0.0001, df = 9). Tukey's post-hoc comparisons indicated significant differences among whales within and between collection regions (Figure 3). Four ECA individuals had significantly higher δ15N values than all other individuals (median δ15N range: 17.7–18.4‰, adj P < 0.01), but did not differ among each other (adj P > 0.7). δ15N values were similar among five individuals collected in the NWA (median δ15N range: 16.3–17.1‰) (adj P > 0.2). δ15N values of one ECA individual (median: 15.2‰) were significantly less than all but one of the individuals of the previous ‘groups’ (adj P < 0.01) (Figure 3). The remaining NWA individual (NWA-BP-1998) had lower δ15N (13.1‰) than all other individuals (Figure 3).
Box-and-whisker plots of median dentinal growth layer group (GLG) δ15N (A) and δ13Ccor values (B) (first three GLGs not included) in teeth of eastern Canadian Artic (ECA) and north-west Atlantic (NWA) killer whales. Horizontal lines represent the median, box width represents the interquartile range (IQR), and whiskers mark the 10th and 90th percentiles. Distinct grouping of individuals noted with δ15N values (indicated by lower case letters) were not reflected in δ13Ccor values.
While δ13Ccor values differed among individual whales (F = 15.62, P < 0.0001, df = 9), post-hoc analyses indicated this result was driven primarily by individual ECA-RB-2009. This whale had significantly lower δ13Ccor values than all individuals (adj P < 0.01) except ECA-CS-1977-2 (adj P > 0.3) and NWA-SI-1977 (adj P > 0.5). While significant differences in δ13Ccor values occurred between several of the remaining whales, for the most part, similar δ13Ccor values among most individuals (adj P > 0.25) did not reflect the clear distinctions among individuals and between regions noted for δ15N (Figure 3). δ13Ccor of whale NWA-BP-1998 was lower than that of most other whales, as it was for δ15N.
Source AA and trophic position indices
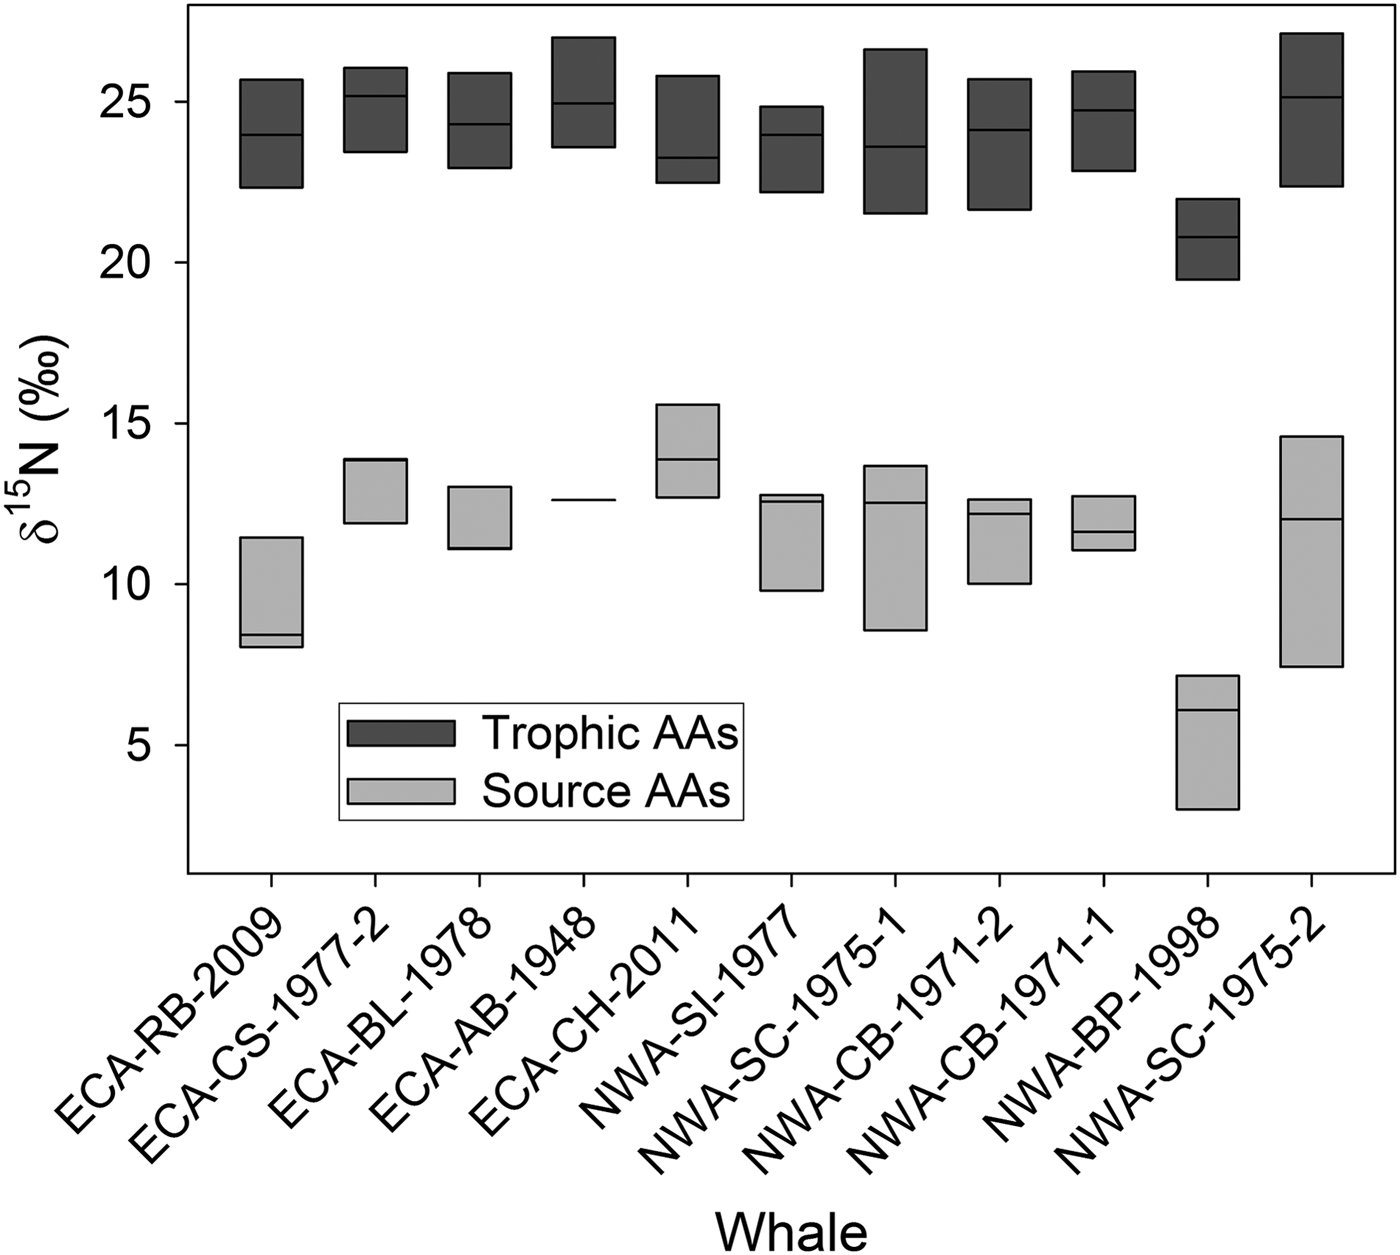
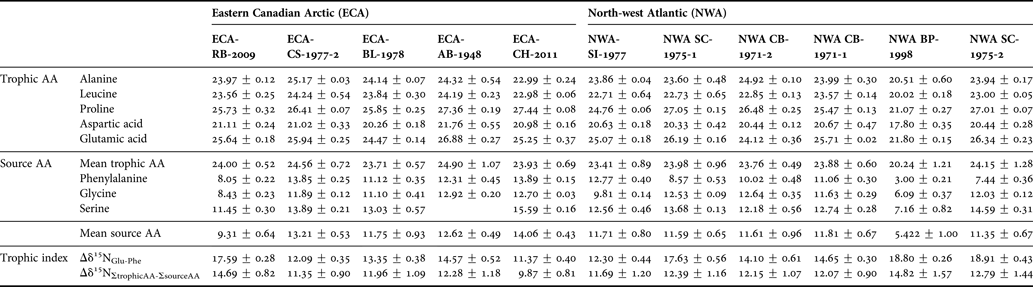
Individual AA δ15N values spanned a range of ~25‰ (Table 2). Trophic AAs (alanine, leucine, proline, aspartic acid, and glutamic acid) had higher δ15N values (mean 23.92 ± 2.0, range 17.80–27.46‰) than source AAs phenylalanine, glycine, and serine (mean 11.13 ± 0.98, range 3.00–15.59‰) (Table 2; Figure 4). Bulk collagen δ15N values calculated from mass balance of individual AA δ15N values correlated strongly with mean bulk collagen δ15N values measured across GLGs (adj R2 0.89, P < 0.001), although with a consistent offset of –1 to –2‰.
Box plots of median trophic (alanine, leucine, proline, aspartic acid, and glutamic acid) and source (phenylalanine, glycine, and serine) amino acid (AA) δ15N values from ‘whole-tooth’ dentinal collagen of eastern Canadian Arctic (ECA) and north-west Atlantic (NWA) killer whales show typical separation between the two types of AAs, reflecting 15N enrichment of trophic relative to source AAs.
δ15N values ± SD (‰) of trophic and source amino acids (AA) in dentinal collagen of Eastern Canadian Arctic (ECA) and north-west Atlantic (NWA) killer whales.
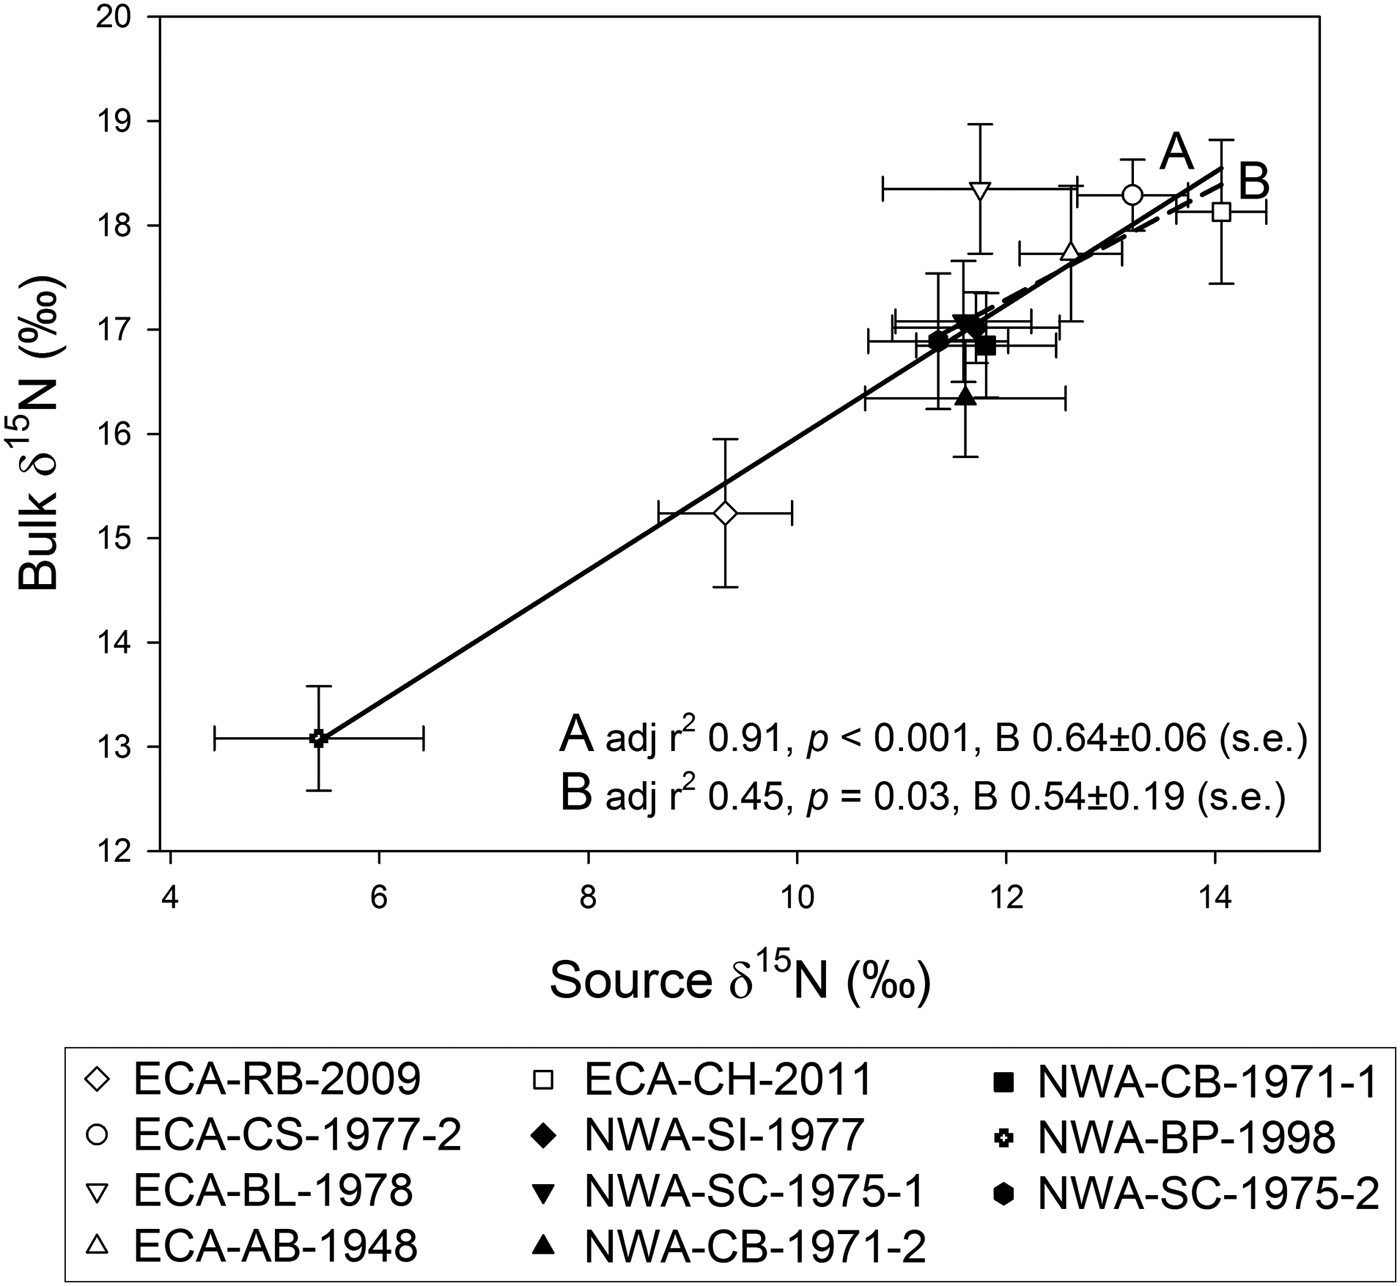
Mean bulk GLG δ15N values and mean source AA δ15N values were significantly correlated (linear regression, adj R2 0.91, P < 0.001, unstandardized regression coefficient (B) 0.64 ±0.06 (SE)) (Figure 5). This relationship remained significant (adj R2 0.45, P < 0.05, B 0.54 ±0.19) after removal of the two whales with the lowest bulk and source AA δ15N values (Figure 5). Groupings identified by differences in bulk δ15N values (Figure 3) differed similarly in their source AA δ15N values (ANOVA, F = 11.07, P < 0.005, df = 3). ECA individuals with high bulk δ15N values (group ‘a’, Figure 3) had significantly higher source AA δ15N values than NWA whales with high bulk δ15N values (group ‘b’) (P < 0.05), as well as whales ECA-RB-2009 (‘c’) (P < 0.001) and NWA-BP-1998 (P < 0.001). Whales ECA-RB-2009 and NWA-BP-1998 had lower source AA δ15N values than NWA whales (group ‘b’) (P = 0.05 and 0.004, respectively), but did not differ from each other (P > 0.8).
Simple linear regression of mean bulk growth layer group vs mean source AA δ15N values shows up to 91% of variation in bulk δ15N is explained by isotopic variation in source AA among individuals (A, solid line). The relationship holds when whales ECA-RB-2009 and NWA-BP-1998 are not included in the regression (B, dashed line). Regression coefficients (slopes) are similar for both.
Trophic AA δ15N values differed among individuals (ANOVA, F = 3.35, P < 0.05, df = 3), although post-hoc tests indicated this was entirely driven by significant differences between whale NWA-BP-1998 and each of groups ‘a’, ‘b’ and ‘c’ identified in Figure 3 (P < 0.001). Trophic AA of the remaining groups did not differ (P > 0.2). Variation in trophic indices (Δδ15NGlu-Phe and Δδ15NΣtrophic AA-Σsource AA) among individuals (Table 2) was, therefore, driven by source AA δ15N rather than trophic AA δ15N. Among ECA whales, ECA-RB-2009 had the greatest Δδ15NGlu-Phe (17.59 ‰). Δδ15NGlu-Phe of the remaining ECA whales ranged from 11.37 to 14.57‰ (Table 2). Similar variation was observed among NWA whales, with whales NWA-SC-1975-2, NWA-BP-1998, and NWA-SC-1975-1 having greater Δδ15NGlu-Phe (18.91, 18.80 and 17.63‰, respectively) than the other NWA whales (range 12.30–14.65‰) (Table 2). Trophic positions calculated using equation (1) ranged from 2.1 ±0.1 to 3.0 ±0.1 (data not shown).
Δδ15NΣtrophic AA-Σsource AA values were more consistent among individuals than Δδ15NGlu-Phe values (Table 2). Among ECA whales, ECA-RB-2009 had a greater Δδ15NΣtrophic AA-Σsource AA (14.69‰) and ECA-CH-2011 had a lower Δδ15NΣtrophic AA-Σsource AA (9.87 ‰) relative to the other ECA whales (11.35–12.28‰) (Table 2). Among NWA whales, NWA-BP-1998 had a greater Δδ15NΣtrophic AA-Σsource AA (14.82‰) than the remaining whales (11.69–12.79‰) (Table 2).
DISCUSSION
Longitudinal δ15N and δ13C profiles across dentinal GLGs indicate consistent isotopic differences between ECA and NWA killer whales at individual and regional levels. While we recognize complex ecosystem-level processes can influence baseline isotope values over the period of GLG deposition (1917–2000), the lack of temporal patterns in bulk GLG and source AA δ15N values over the 80 yr study period indicates isotopic differences among individuals were not related to temporal isotopic variation, and that observed for δ13C values was attributed to the oceanic 13C Suess effect. Analysis of AA-specific δ15N values, however, showed as much as 91% of the bulk δ15N variation among individuals was due to baseline (source AA) δ15N variation, rather than diet differences. Results therefore indicate killer whales included in our sample foraged consistently at similar trophic levels, but within food webs with distinct baseline isotopic values.
Our assessment of the degree to which bulk isotopic differences among individuals reflect baseline vs trophic-level diet differences depends on interpretations of AA-specific δ15N values. While its application to marine mammal foraging studies has not been rigorously validated, AA-CSIA has been used successfully to decouple baseline vs trophic influences on bulk δ15N in a variety of other marine consumers. AA-specific δ15N patterns in this study generally follow that of previous studies on marine birds and mammals. Lorrain et al. (Reference Lorrain, Graham, Ménard, Popp, Bouillon, van Breuel and Cherel2009) reported a δ15N difference between mean trophic and source AA in penguin blood of ~13‰, while that between trophic and source AAs in harbour seal serum reported in Germain et al.'s (Reference Germain, Koch, Harvey and McCarthy2013) study is ~11–12‰ (calculated from values presented in Table 1 using the same trophic and source AAs measured in this study). Relative differences between trophic and source AA δ15N values in this study are also similar to Δδ15NΣtrophic AA-Σsource AA of bone collagen of an unidentified whale and two cape fur seals (Arctocephalus pusillis) (~13‰; Styring et al., Reference Styring, Sealy and Evershed2010). We therefore proceed with interpretation of AA-specific δ15N results while recognizing this method has not yet been validated in marine mammals, and that further research, especially in terms of trophic position estimation, is required (see below).
While all AA can undergo deamination leading to 15N enrichment of the remaining AA pool (Macko et al., 1986), the negligible trophic fractionation of ~0.4‰ between diet and zooplankton δ15NPhe values (McClelland & Montoya, Reference McClelland and Montoya2002) appears to be conserved in higher marine consumers (e.g. Naito et al., Reference Naito, Honch, Chikaraishi, Ohkouchi and Yoneda2010; Styring et al., Reference Styring, Sealy and Evershed2010). In the only controlled feeding study on AA-specific trophic 15N enrichment in marine mammals, Germain et al. (Reference Germain, Koch, Harvey and McCarthy2013) reported similar δ15NPhe values between captive harbour seals (Phoca vitulina) (δ15NPhe range: 9.1 ±1.0–12.7 ±0.9‰) and their diet comprising Atlantic herring (Clupea harengus) (δ15NPhe 11.3 ±4.4‰). The strong linear relationship between bulk and source AA δ15N values in killer whale dentine, therefore, most likely reflects foraging within regions with distinct baseline δ15N values (e.g. Hannides et al., Reference Hannides, Popp, Landry and Graham2009). Measured source and trophic AAs account for similar amounts of total dentinal collagen nitrogen (Eastoe, Reference Eastoe1963), so the correlation between bulk and source AA δ15N is not simply a reflection of greater contribution of the latter to total collagen nitrogen. While generally poor resolution of baseline isotopic variation across the NWA limits interpretations within a spatial context, Graham et al. (Reference Graham, Koch, Newsome, McMahon, Aurioles, West, Bowen, Dawson and Tu2010) reported a gradual decrease in δ15N values in upper water column plankton from the high Arctic to more southern latitudes in the North Atlantic. The low δ15N values of ECA-RB-2009 and NWA-BP-1998 relative to the other whales could, therefore, reflect consistent foraging within food webs at lower latitudes in the North Atlantic Ocean, a plausible scenario given the track of a killer whale recently satellite-tagged in the ECA (Matthews et al., Reference Matthews, Luque, Petersen, Andrews and Ferguson2011) spanned a gradient in δ15N values similar to the range in source AA δ15N values among individuals measured in this study.
Mid-latitude foraging in the North Atlantic by these two whales is also supported by their relatively low δ13Ccor values, which indicate they foraged primarily within a region(s) characterized by distinctly lower baseline δ13C values. Although δ13C values in the North Atlantic generally increase with decreasing latitude, a large region of relatively lower δ13C values at ~30–40oN (Graham et al., Reference Graham, Koch, Newsome, McMahon, Aurioles, West, Bowen, Dawson and Tu2010) also coincides with locations of the satellite-tagged killer whale (Matthews et al., Reference Matthews, Luque, Petersen, Andrews and Ferguson2011). Other possibilities that could potentially account for relative differences in δ13Ccor values (but may be difficult to reconcile with concurrent δ15N patterns) include foraging along a coastal–offshore gradient (e.g. Walker et al., Reference Walker, Potter and Macko1999), or in north-east Atlantic waters off eastern Greenland, Iceland, and the British Isles, where zooplankton δ13C values are lower than off Newfoundland and Nova Scotia (but not relative to the ECA) (Graham et al., Reference Graham, Koch, Newsome, McMahon, Aurioles, West, Bowen, Dawson and Tu2010). Although impossible to narrow potential distributions with certainty, we speculate whales ECA-RB-2009 and NWA-BP-1998 had a different over-wintering range than the other killer whales, or could have been infrequent visitors to the ECA or coastal Newfoundland.
Significant bulk δ15N differences between remaining ECA and NWA whales (groups ‘a’ and ‘b’ in Figure 3) due largely to baseline isotopic variation provides support for separate, largely non-overlapping populations of killer whales within the ECA and NWA, at least during some portion of the year. Currently little is known about seasonal movements of ECA and NWA killer whales, and whether they move regularly between the two areas or share a common winter range is not known. Higdon (Reference Higdon2007) found little evidence for large-scale migrations from southern latitudes into the ECA during summer months, given killer whale sightings occur along a range of latitudes throughout the ECA and NWA over that period, and to date, no re-sightings of photo-identified killer whales have occurred between the ECA and NWA (Young et al., Reference Young, Higdon and Ferguson2011). Considerable 15N enrichment in ECA marine mammals such as narwhal, beluga, and ringed seal (δ15N ~16–18‰; Hobson & Welch, Reference Hobson and Welch1992) relative to those occupying similar trophic position along the coast of Newfoundland such as common dolphin (Delphinus delphis) and harp seals (Pagophilus groenlandicus) (δ15N ~14–15‰; Ostrom et al., Reference Ostrom, Lien and Macko1993; Lawson & Hobson, Reference Lawson and Hobson2000) suggests baseline δ15N values are higher in the ECA. Regular seasonal foraging trips into Arctic waters by ECA killer whales would have allowed them to prey on marine mammals with relatively higher δ15N values (but not higher trophic position), which could account for the observed differences in δ15N values if residency time within the ECA and foraging intensity was of sufficient duration to be recorded by dentine growth. Energy intake of killer whales can be greater during seasonal periods of prey availability (Baird & Dill, Reference Baird and Dill1995), and this is likely the case for killer whales foraging on seasonally predictable aggregations of marine mammals in the ECA (Ferguson et al., Reference Ferguson, Kingsley and Higdon2012b).
Baseline δ15N differences could also reflect spatial segregation throughout the year, given each micromilled GLG sample represents diet integrated over an entire year of GLG deposition. Killer whales are not regularly sighted in the ECA during winter months (Higdon et al., Reference Higdon, Hauser and Ferguson2011), and Reeves & Mitchell (Reference Reeves and Mitchell1988) hypothesized their winter range could include the Labrador Sea, the open North Atlantic, and the North American coast as far south as the Caribbean, while winter sightings of killer whales along the west coast of Greenland (Heide-Jørgensen, Reference Heide-Jørgensen1988) suggest it as a possible winter range of ECA killer whales. Lawson & Stevens (Reference Lawson and Stevens2013) reported similar sightings patterns around Newfoundland between summer and winter, and suggested certain locations are important throughout the year. However, it remains to be determined whether winter sightings off Newfoundland comprise individuals that summer in the ECA. Considerable overlap in dentinal δ13Ccor values among ECA and NWA killer whales provides little additional indication of geographical separation. However, since δ13C values of potential prey show little distinction across these regions (Hobson & Welch, Reference Hobson and Welch1992; Ostrom et al., Reference Ostrom, Lien and Macko1993; Lawson & Hobson, Reference Lawson and Hobson2000; Hobson et al., Reference Hobson, Fisk, Karnovsky, Holst, Gagnon and Fortier2002), foraging within distinct areas across the broader ECA/NWA would not be expected to produce considerable differences in δ13Ccor values. Nonetheless, consistent isotopic values across GLGs within individuals appears to be largely related to spatial foraging patterns, suggesting potential long-term site fidelity and separate killer whale groups/populations across the greater north-west Atlantic. Order of magnitude differences in several classes of persistent organic pollutants (D. Muir, Environment Canada, Burlington, ON, unpublished data) and correlations between genetic and isotopic differences among some of the whales included in this study (Morin et al., Reference Morin, Archer, Foote, Vilstrup, Allen, Wade, Durban, Parsons, Pitman, Li, Bouffard, Nielsen, Rasmussen, Willerslev, Gilbert and Harkins2010; A. Foote, personal communication) support this assertion.
Absolute trophic position estimates derived from AA-specific δ15N values and equation (1) were too low for ECA/NWA killer whales known to feed at least to some extent on other marine mammals (expected trophic position of 4.5–4.6; Pauly et al., Reference Pauly, Trites, Capuli and Christensen1998). Recent studies (Lorrain et al., Reference Lorrain, Graham, Ménard, Popp, Bouillon, van Breuel and Cherel2009; Dale et al., Reference Dale, Wallsgrove, Popp and Holland2011; Germain et al., Reference Germain, Koch, Harvey and McCarthy2013) have also produced unexpectedly low trophic level estimates for higher marine consumers using AA specific δ15N values, suggesting TEFGlu-Phe in higher marine consumers is less than the 7.6‰ determined for zooplankton and fish (but see Naito et al., Reference Naito, Honch, Chikaraishi, Ohkouchi and Yoneda2010, who obtained reasonable trophic level estimates for sea lions (Zalophus calitorianus japonicas) and porpoises (Phocoenidae) calculated with TEFGlu-Phe = 7.6‰). Germain et al. (Reference Germain, Koch, Harvey and McCarthy2013) performed a controlled feeding study to investigate nitrogen isotope fractionation in amino acids in harbour seals, measuring TEFGlu-Phe of ~4.3‰. The authors propose using a multi-TEF calculation of marine mammal trophic position to account for differences in nitrogen cycling between consumers excreting ammonia (e.g. zooplankton and teleost fish) vs uric acid or urea (e.g. elasmobranchs, marine birds and mammals) (Germain et al., Reference Germain, Koch, Harvey and McCarthy2013; see also Dale et al., Reference Dale, Wallsgrove, Popp and Holland2011). Recalculation of ECA/NWA killer whale trophic position estimates using just a single TEFGlu-Phe of 4.3‰ (i.e. provides higher trophic position estimates than a dual-TEF approach since the lower TEF is applied to all trophic transfers) and equation (1) increases trophic position estimates to only 2.9–4.6. While the upper end of this range is plausible for killer whales with diets comprising approximately equal amounts of fish and marine mammals, the lower end is less than that of baleen whales foraging exclusively on large zooplankton (trophic position range: 3.2–3.6; Pauly et al., Reference Pauly, Trites, Capuli and Christensen1998).
Although further research is required before AA-specific δ15N values can be used to calculate absolute trophic position of marine mammals, we assume differences between trophic and source AA are diagnostic in terms of relative diet comparisons. Differences between Δδ15NGlu-Phe and Δδ15NΣtrophic AA-Σsource AA in their relative placement of individuals may reflect uncertainty in phenylalanine isotopic measurements, which can be influenced by co-eluting compounds (N. Wallsgrove, University of Hawaii, Honolulu, HI, personal communication). We therefore interpret Δδ15NΣtrophic AA-Σsource AA rather than Δδ15NGlu-Phe. Comparable Δδ15NΣtrophic AA-Σsource AA values among most whales (certainly when error estimates are considered) suggest similar trophic-level diet. Although observational data forming the basis of our understanding of killer whale diet can be limited to conspicuous predation occurring at the surface, and are temporally biased due to seasonal variation in killer whale abundance and observer effort in both the ECA (Reeves & Mitchell, Reference Reeves and Mitchell1988; Higdon et al., Reference Higdon, Hauser and Ferguson2011) and NWA (Lien et al., Reference Lien, Stenson and Jones1988; Lawson & Stevens, Reference Lawson and Stevens2013), observations of killer whale predation in both regions suggest isotope patterns reflect a broad range of marine mammal prey. Monodontids (narwhal and beluga) are the most frequently reported prey of killer whales observed in the ECA (51% of predation records), followed by bowhead whales (32%) and seals (12%) (Higdon et al., Reference Higdon, Hauser and Ferguson2011). Reinhart et al. (Reference Reinhart, Ferguson, Koski, Higdon, LeBlanc, Tervo and Jepson2013) identified rake marks left by killer whale teeth on flukes of ~10% of photographed bowhead whales from five regions across the ECA. These observations in the ECA correspond with historical and recent observations of killer whale predation off Newfoundland and Labrador. Whalers off southern Labrador in the 1950s encountered killer whales attacking blue (Balaenoptera musculus) and fin whales (Balaenoptera physalus) (Mitchell & Reeves, Reference Reeves and Mitchell1988), and sealing and whaling literature from the area describes killer whales tearing at carcasses of harvested whales (Mitchell & Reeves, Reference Reeves and Mitchell1988) and preying on harp seals (Phoca groenlandica) within ice fields (Sargeant & Fisher, Reference Sergeant and Fisher1957). Killer whales have recently been observed within nearshore ice fields near breeding harp seals off northern Newfoundland (Lawson et al., Reference Lawson, Stevens and Snow2008), and photo-identified killer whale groups have been recorded regularly killing minke whales (Lawson & Stevens, Reference Lawson and Stevens2013).
An exception to similar Δδ15NΣtrophic AA-Σsource AA among individuals are the larger Δδ15NΣtrophic AA-Σsource AA values (by ~2–3‰) of whales ECA-RB-2009 and NWA-BP-1998, suggesting the diets of these whales comprised a greater proportion of higher trophic level prey. This pattern is difficult to explain given the strong relationship between bulk and source δ15N values (one would expect bulk δ15N values of these two whales to be higher than values predicted by the linear fit if they foraged at a higher trophic level relative to the other whales). Differences in apical tooth wear patterns, which have been associated with foraging differences among killer whale ecotypes (Ford et al., Reference Ford, Ellis, Matkin, Wetklo, Barrett-Lennard and Withler2011) or ecologically divergent groups (Foote et al., Reference Foote, Newton, Piertney, Willerslev and Gilbert2009), provide some independent support for diet differences between these two and the remaining individuals. General inspection of the lower mandibles of whale ECA-RB-2009 and ECA-CH-2011 indicated whale ECA-RB-2009 had considerably more tooth wear, despite being an estimated 7 yr younger. NWA-BP-1998 had particularly extensive apical tooth wear exposing the pulp cavity, even though this whale, estimated to have been just 5 yr old when it died, was considerably younger than other whales with intact teeth. Comparable tooth wear has been linked with diets of shark in other killer whale populations (Ford et al., Reference Ford, Ellis, Matkin, Wetklo, Barrett-Lennard and Withler2011), which would be consistent with the greater Δδ15NΣtrophic AA-Σsource AA of whales ECA-RB-2009 and NWA-BP-1998, given sharks are generally tertiary consumers occupying high trophic positions in marine food webs (trophic position ~4; Cortés Reference Cortés1999; Estrada et al., Reference Estrada, Rice, Lutcavage and Skomal2003). Further research into the relative rates of trophic 15N enrichment of individual AAs will likely help elucidate patterns, and eventually clarify trophic position estimates of higher consumers such as killer whales based on AA-specific δ15N.
Evidence of significant baseline isotopic variation among ECA and NWA killer whales suggests consistent, long-term isotopic variation recorded in dentine GLGs reflected spatial segregation, rather than individual diet specialization. Consistent isotope profiles across GLGs spanning periods up to 25 yr suggest both distribution and diet of sampled individuals were fairly stable over the long-term. Future research efforts on ECA and NWA killer whales should focus on microspatial chemical analysis of teeth or tissues with fast turnover rates (e.g. metabolically active blubber) that can allow diet and habitat reconstructions over narrow periods of time, given GLGs sampled with annual resolution limit the scope for investigating seasonal distribution and diet patterns. This would provide a clearer idea of seasonal variation in killer whale diet in these regions, and could help determine, for example, whether killer whales show diet plasticity over the short-term. Diet variation could be especially pronounced in the ECA, where seasonal aggregations of marine mammals offer a predictable food resource, and recent studies (e.g. Higdon et al., Reference Higdon, Hauser and Ferguson2011; Reinhart et al., Reference Reinhart, Ferguson, Koski, Higdon, LeBlanc, Tervo and Jepson2013) have identified possible spatial and temporal patterns in predation too fine to be detected using diet indices integrated over the entire year. Our results add to a growing literature on killer whale predation patterns globally, and provide critical trophic information necessary for ecosystem management and conservation at broad spatial scales.
ACKNOWLEDGEMENTS
This research was undertaken as part of the Orcas of the Canadian Arctic (OCA) research programme. Teeth used in this study were generously provided by the Canadian Museum of Nature (Ottawa, ON), the Nova Scotia Museum (Halifax, NS), the Manitoba Museum (Winnipeg, MB), J. Ford (Fisheries and Oceans Canada (DFO), Nanaimo, BC), J. Lawson (DFO, St John's, NL), and W. Ledwell (Portugal Cove, NL). We thank P. Middlestead, W. Abdi, and P. Wickham (University of Ottawa) and B. Popp, N. Wallsgrove, and C. Lyons (University of Hawaii) for sample analysis. R. Bajno, E. Burns-Flett, J. Higdon and S. Newsome provided logistical support or advice during laboratory procedures, and T. Koulis reviewed mixed effects models. A. Foote, B. Popp, N. Wallsgrove and an anonymous referee read an earlier draft of this manuscript and provided suggestions for its improvement.
FINANCIAL SUPPORT
C.J.D.M. received funding from the Garfield Weston Foundation, the E. Scherer Memorial Scholarship and the Duff Roblin Fellowship at the University of Manitoba, and SHF received NSERC Discovery Grant support. Research funding was provided by DFO-SARCEP (Species at Risk Committee/Comité sur les espèces en péril) and ArcticNet Network of Centres of Excellence of Canada.