Preventing the transmission of pathogens during patient care depends, in part, on healthcare workers (HCWs) routinely practicing infection prevention procedures, such as hand hygiene and wearing personal protective equipment (PPE). These procedures are major components of standard precautions, which should be practiced regardless of whether a patient is known to be infectious. Although a variety of external constraints influence the use of such procedures (eg, time pressure and inconvenient access to supplies Reference Smiddy, O’Connell and Creedon1 ), so too do cognitive determinants of behavior (eg, HCW motivation and social norms Reference Pittet2 ).
Understanding the cognitive determinants of IPC behaviors, particularly in different populations of HCWs, Reference Pittet2 is believed to be important for designing interventions that modify these behaviors. Reference Pittet2–Reference Evanoff, Kim and Mutha4 However, a better understanding of whether and how populations of HCWs differ is needed, particularly in regard to an important but under-studied Reference Bogdanovic, Petralito, Passerini, Sax, Manser and Clack5 cognitive determinant of IPC behaviors—mental models. Reference Bogdanovic, Petralito, Passerini, Sax, Manser and Clack5–Reference Sax and Clack7 A mental model is an organized collection of individual beliefs that one uses to understand, explain, and predict events in the world around them Reference Rouse and Morris8 to select appropriate courses of action. For example, HCWs often perform multiple tasks per patient room visit, which can require sequencing and recognizing transitions between tasks to minimize cross-contamination (eg, from “dirty” to “clean” tasks Reference Gregory, Weston, Harrod, Meddings and Krein9,Reference Chang, Jones and Reisinger10 ). How effectively HCWs organize their workflow depends, in part, on how HCWs believe their tasks are related.
In this study, we assessed HCW mental models of patient care tasks for a patient requiring only standard precautions in four populations of HCWs: infection preventionists (IPs) and registered nurses (RNs) from intensive care units (ICUs), emergency departments (EDs), and medical-surgical floors. In an exploratory fashion, we determined whether these populations cognitively organize tasks along the same dimensions and whether the weight given to each dimension (ie, its subjective importance) differs between populations. For example, IPs and RNs may organize tasks along different dimensions because IPs are formally trained in IPC. These populations may also organize tasks along some common dimensions (eg, risk to the patient or risk to the HCW) but weight those dimensions differentially. For example, RNs in ICUs work with acutely ill patients who are at greater risk of acquiring infections (eg, because of invasive medical devices such as central venous or urinary catheters), whereas RNs in the ED are at greater risk of prolonged contact with body fluids from patients whose infection status is often unknown. Reference Evanoff, Kim and Mutha4
Methods
Identifying tasks
To identify a set of patient care tasks, we first surveyed 4 critical-care RNs trained to care for patients with serious communicable diseases, 3 infectious disease physicians, and 2 IPs. Each was asked, “What patient care tasks do you (or others) do where it is important to protect you or your patient from a contagious disease?” Respondents produced 148 tasks, collectively. To reduce the number of tasks, we printed tasks on separate cards, which 2 critical-care RN subject-matter experts (SMEs) sorted into groups of redundant tasks or single tasks that could not be grouped with another task(s). The SMEs reviewed their groupings until they reached a consensus. We then carried forward the tasks that RNs in the ICU, ED, and medical-surgical floors perform routinely, which resulted in a final list of 25 tasks (Supplementary Material online). Tasks were rephrased as needed to minimize ambiguity.
Recruitment
We then recruited IPs and RNs from EDs, ICUs, and medical-surgical floors from adult inpatient hospitals across a large academic hospital network. Participants were invited to take an hour-long online survey about infection prevention.
Rating task pairs
Participants reviewed the 25 tasks and then judged the similarity of all possible pairs of tasks using a scale from 1 (not at all similar) to 9 (extremely similar). When rating each task pair, participants were told to take an “… infection prevention perspective (ie, preventing the spread of pathogens)” and to assume that the patient is “… average-sized, not bed-bound, able to cooperate (eg, understand and follow commands), but is weak. No known special precautions are required.” The order of the 300 task-pairs was randomly generated for each participant. After rating all task-pairs, participants described the reasoning behind their ratings. Each reason given by a participant was later printed on a separate card and then sorted into groups of recurring reasons.
Multidimensional scaling
Multidimensional scaling (MDS) takes a measure of psychological similarity (eg, ratings) between all possible pairs of a set of objects (eg, patient care tasks), places each object as a point in an n-dimensional space, and then iteratively reconfigures the objects in space until the distance between each pair of objects reflects the corresponding measure of psychological similarity as closely as possible. Objects perceived as similar are close together whereas objects perceived as dissimilar are far apart. The overall congruence between the distances between objects in the multidimensional space and their corresponding measure of similarity is quantified as stress, which ranges from 0 to 1 with lower values indicating better fit. The dimensionality of the space is set by the analyst, who strives to find the smallest number of dimensions that best reproduce the psychological similarity of the objects. Each dimension may then be interpreted in terms of known characteristics of the objects, which are reflected in how objects are ordered along a dimension. We used a variant of MDS called Individual Differences Scaling (INDSCAL), Reference Arabie, Aldenderfer, Carroll and DeSarbo11 which also measures how salient (ie, important) each dimension is to each participant, called a “weight.” If a participant does not perceive a certain dimension, then that dimension will have a weight of zero for that participant. The higher a weight is above zero, the more salient that dimension is to that participant. We implemented the INDSCAL model using the PROXSCAL algorithm, treating similarity ratings as ordinal data and using the primary approach to ties. Reference Borg, Groenen and Mair12 We scaled the data from all raters in 1 to 6 dimensions. For each dimensionality, we retained the best-fitting final configuration from 1,000 randomly generated starting configurations, Reference Faul, Erdfelder, Lang and Buchner15,Reference Cohen16 according to recommended convergence criteria. Reference Faul, Erdfelder, Lang and Buchner15
Identifying dimensionality
We identified the dimensions underlying the task-pair ratings using 3 criteria: model fit Reference Arabie, Aldenderfer, Carroll and DeSarbo11–Reference Mair, Borg and Rusch14 and the interpretability Reference Arabie, Aldenderfer, Carroll and DeSarbo11–Reference Mair, Borg and Rusch14 and replicability Reference Borg, Groenen and Mair12,Reference Mair, Borg and Rusch14 of dimensions. Regarding model fit, we plotted the stress of the best-fitting final configuration as a function of dimensionality to identify the point at which positing additional dimensions failed to improve fit substantially. Reference Arabie, Aldenderfer, Carroll and DeSarbo11–Reference Mair, Borg and Rusch14
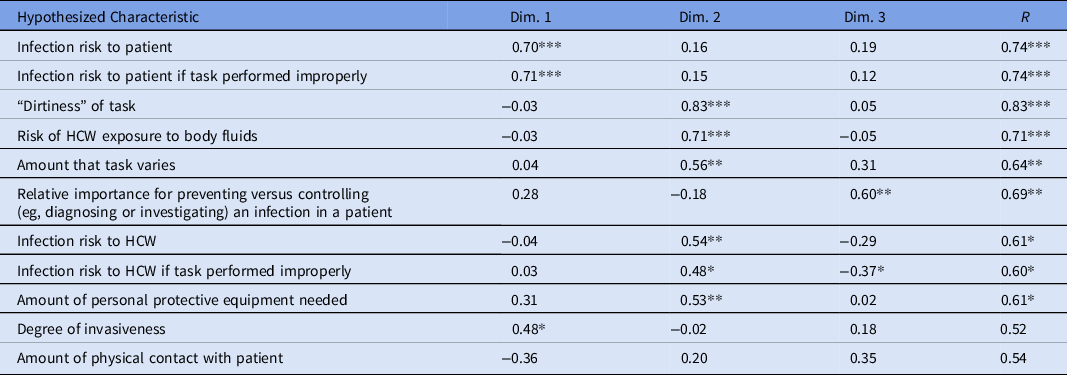
We took a multiple regression approach to interpreting dimensions, Reference Borg, Groenen and Mair12,Reference Kruskal and Wish13 in which we first hypothesized 12 characteristics of patient care tasks based on the input of a SME panel (3 infectious disease physicians and 4 critical-care RNs) and recurring reasons participants gave for their similarity judgments. We translated each characteristic into a statement that could be rated on a 5-point scale: none, low, moderate, high, and very high. A new sample of HCWs independently rated the 25 tasks in terms of the hypothesized characteristics. For each HCW, the order of the 25 tasks and the order of the characteristics for each task were randomly generated. One hypothesized characteristic of tasks, the “relative importance for preventing versus controlling (eg, diagnosing or investigating) an infection in a patient,” was calculated from 2 characteristics as the arithmetic difference between the “relevance for preventing an infection in a patient,” and the “relevance for controlling (eg, diagnosing or investigating) an infection in a patient.” For each of the final 11 hypothesized characteristics (Table 2), we calculated the mean rating for each of the tasks, which were predicted from the tasks’ coordinate value on each dimension using multiple regression. Reference Borg, Groenen and Mair12,Reference Kruskal and Wish13 Interpretation of dimensions followed recommended guidelines. Reference Kruskal and Wish13 As a minimal requirement, a characteristic should have a multiple correlation that is significant at the α = 0.01 level. Additionally, the characteristic should have a high multiple correlation (R ≥ 0.70) and a high regression weight on 1 dimension only.
To assess the replicability of the best-fitting and most interpretable configuration, we scaled each HCW population’s rating data separately. Reference Mair, Borg and Rusch14 For each population, we used the coordinate values of the 25 tasks from the full-sample analysis as a reasonable starting configuration for the PROXSCAL algorithm to optimize. Reference Borg, Groenen and Mair12 We assessed the similarity of dimensions between populations by calculating Pearson correlation coefficients between task coordinates on each pair of dimensions. Using the Fisher r to z transformation, we then averaged correlations between corresponding dimensions across populations.
To determine whether the dimensions differed in their salience, and whether such patterns differed between populations of HCWs, we analyzed weights using a Greenhouse-Geisser corrected mixed model analysis of variance (ANOVA) with dimension as a within-subjects factor and HCW population as a between-subjects factor. Reference Arabie, Aldenderfer, Carroll and DeSarbo11 Post-hoc pairwise comparisons were performed using Bonferroni’s correction for multiple comparisons. A power analysis in G*Power version 3.1.9.2 software Reference Faul, Erdfelder, Lang and Buchner15 indicated that a total sample size of 40 HCWs was required to detect a large interaction (f = 0.4) Reference Cohen16 between dimension and HCW population with at least 80% power and α = 0.05 across a range of dimensions (2–6). All statistical analyses were performed in SPSS version 26 software (IBM, Armonk,NY). A P value < .05 was considered significant.
Results
Rating task pairs
We received task-pair rating data from 11 IPs and 10 ED RNs, 10 medical-surgical RNs, and 9 ICU RNs (5 medical ICU, 4 surgical ICU). Most RNs (83%) worked in a large quaternary-care academic medical center. RNs had a median of 8 years (range, 1–38) of nursing experience. Also, 16 RNs (55%) reported working or having worked in a COVID-19 unit. Furthermore, 54% of IP respondents were from the same academic medical center. IPs had a median of 4.5 years (range, 2–25) of experience as an IP. Nearly half (45%) of the IPs had a background in nursing.
Rating tasks
An additional 6 ICU RNs with a median of 8.5 years (range, 7–43 years) of nursing experience rated the 25 tasks on 12 scales. All 6 RNs were also trained in a hospital biocontainment unit, which involves annual exercises, skills training, and online course work related to IPC. Additionally, all 6 ICU RNs reported working or having worked in a COVID-19 unit.
Multidimensional scaling
Figure 1 shows the stress of the best-fitting configuration obtained in dimensions 1 through 6. Inspection of Figure 1 suggests that positing >4 dimensions does not substantially improve fit. However, the best-fitting configuration in 4 dimensions was only marginally better than that obtained in 3 dimensions. Using the multiple regression approach for interpreting dimensions described earlier, Reference Kruskal and Wish13 we found that only the 3-dimensional configuration was fully interpretable, which we therefore retained for further analyses.
Stress of the best-fitting configuration obtained in 1 through 6 dimensions. Lower values of stress indicate a better fit to the rating data, with 0 corresponding to a perfect fit. The PROXSCAL algorithm minimizes a variant of stress called “normalized raw stress.”

To assess the replicability of the 3-dimensional configuration of the full sample, we scaled each HCW population’s data separately in 3 dimensions.
Reference Mair, Borg and Rusch14
The stress for IPs (0.03) and ED RNs (0.03) and ICU RNs (0.03) were comparable, whereas the stress for medical-surgical RNs (0.05) was somewhat higher. Table 1 shows all pairwise correlations between each populations’ dimensions. Corresponding dimensions were strongly and significantly correlated between each population (dimension 1:
 $\overline{r}$
z′
= .94, dimension 2:
 $\overline{r}$
z′
= .85, and dimension 3:
 $\overline{r}$
z′
= .79), whereas no cross-dimension correlations were significant. Thus, a replicable set of dimensions was identified across populations.
Reference Mair, Borg and Rusch14
Pearson Correlations Between Dimensions From 4 HCW Populations

Note: IPs, infection preventionist; RNs, registered nurses; ICU, intensive care unit; ED, emergency department; Dim., dimension. P values are corrected for multiple comparisons using Bonferroni’s correction. *P < .05, **P < .01, ***P < .001.
Following recommended guidelines Reference Kruskal and Wish13 for interpreting dimensions using multiple regression (Table 2), we interpreted dimension 1 (Fig. 2) as the perceived magnitude of infection risk to the patient in a task. This dimension was strongly and exclusively related to the characteristics “infection risk to patient,” and “infection risk to patient if task performed improperly.” Dimension 2 reflects the perceived “dirtiness” of a task and the perceived risk of HCW exposure to body fluids (Fig. 2). This dimension was related to the “‘dirtiness of task,” “risk of healthcare worker exposure to body fluids,” and to a lesser extent, the “amount that task varies.” Although failing to meet recommended guidelines, Reference Kruskal and Wish13 “infection risk to healthcare worker,” “infection risk to healthcare worker if task performed improperly,” and “amount of PPE needed,” were weakly related to dimension 2 as well. Lastly, dimension 3 reflects a task’s perceived relative importance for preventing versus controlling an infection in a patient (Fig. 3). For this dimension, only the arithmetic difference between “relevance for preventing an infection in a patient,” and “relevance for controlling (eg, diagnosing or investigating) an infection in a patient,” indicated relatedness.
Standardized Regression Coefficients for Each Dimension Predicting the 11 Hypothesized Characteristics

Note: Dim., Dimension; HCW, healthcare worker; R, multiple correlation coefficient. Each hypothesized characteristic was rated on a 5-point scale: none, low, moderate, high, and very high. *P < .05, **P < .01, ***P < .001.
Plot of patient care tasks along dimensions 1 and 2. See the Supplementary Material (online) for complete descriptions of the 25 tasks. Note. pt, patient; NG, nasogastric; NP, nasopharyngeal; BF, body fluid; SQ, subcutaneous; IM, intramuscular; IV, intravenous line; PIV, peripheral intravenous line; CL, central line; med, medicine; pericare, perineal care; cath, catheter.

Plot of patient care tasks along dimensions 3 and 1. See the Supplementary Material (online) for complete descriptions of the 25 tasks. Note. pt, patient; NG, nasogastric; NP, nasopharyngeal; BF, body fluid; SQ, subcutaneous; IM, intramuscular; IV, intravenous line; PIV, peripheral intravenous line; CL, central line; med, medicine; pericare, perineal care; cath, catheter.

Analysis of weights revealed a significant main effect of dimension (P < .001), a nonsignificant main effect of HCW population (P = .90), and a nonsignificant interaction between dimension and HCW population (P = .72). Post-hoc pairwise comparisons of the main effect of dimension revealed that HCWs weighted dimension 1 (M = 0.45, SEM = 0.01) significantly more heavily than dimension 2 (M = 0.38, SEM = 0.01; P < .001) and dimension 3 (M = 0.33, SEM = 0.01; P < .001). HCWs also weighted dimension 2 significantly more heavily than dimension 3 (P = .001).
Discussion
Given a patient requiring only standard precautions, IPs and RNs from ICUs, EDs, and medical-surgical floors cognitively organized patient care tasks along 3 common dimensions; the most salient dimension was the perceived magnitude of infection risk to the patient in a task. Reference Pittet2,Reference Jang, Wu and Kirzner17–Reference Pittet, Simon, Hugonnet, Pessoa-Silva, Sauvan and Perneger20 This finding underscores the importance of assessing HCW perceptions of patient risk in a task, particularly if attempting to explain IPC behaviors. Reference Sax and Clack7 Regarding hand hygiene adherence, for example, attempts to relate HCW perception of risk to the patient in a task (vs the authors’ conceptualization of risk) and hand hygiene adherence are uncommon in the literature. Reference Lee, Burnett, Morrison and Ricketts19,Reference Pittet, Simon, Hugonnet, Pessoa-Silva, Sauvan and Perneger20 Some authors have even concluded that HCWs fail to assess the risk that tasks pose to patients because HCWs did not behave according to the authors’ conceptualization of risk. Reference Jenner, Fletcher, Watson, Jones, Miller and Scott18 However, failing to assess risk entirely and failing to assess risk accurately are separate issues. For the latter, ambiguity regarding adverse outcomes following unsafe behaviors (eg, not performing hand hygiene when indicated) can prevent HCWs from developing accurate risk perceptions, Reference Clack, Passerini, Manser and Sax21 which should not be confused with failing to assess risk.
Less salient to HCWs was the perceived dirtiness and risk of HCW exposure to body fluids during a task. These characteristics have been identified previously, Reference Evanoff, Kim and Mutha4,Reference Jang, Wu and Kirzner17,Reference Erasmus, Brouwer and van Beeck22–Reference Reid, Farion, Suh, Audcent, Barrowman and Plint29 particularly as strong cues for self-protective behaviors. For example, HCWs have reported that the perceived dirtiness of a task influences their use of hand hygiene Reference Jang, Wu and Kirzner17,Reference Raboud, Saskin and Wong28,Reference Erasmus, Daha and Brug30 and PPE. Reference Evanoff, Kim and Mutha4,Reference Jackson and Griffiths23,Reference Wilson, Bak and Loveday27,Reference Reid, Farion, Suh, Audcent, Barrowman and Plint29,Reference Flores, Wrigley and Askew31 Our results suggest that the perceived dirtiness and risk of exposure to body fluids are more prominent characteristics of tasks to HCWs than the perceived infection risk to the HCW; the scales “infection risk to healthcare worker,” “infection risk to healthcare worker if task performed improperly,” and the “amount of PPE needed,” during a task were only weakly related to this dimension. This finding is consistent with observations that the perceived dirtiness of a task and the personal risk of infection are not necessarily synonymous to HCWs. Reference Jackson and Griffiths23 Moreover, the finding that this dimension was less salient to HCWs than the infection risk to the patient may reflect a desensitization Reference Jang, Wu and Kirzner17 of HCWs to risks to themselves. For example, some HCWs perceive that exposure risk is “omnipresent” in clinical practice Reference Fix, Reisinger and Etchin32 and that constant exposure to pathogens has rendered them either immune or already colonized. Reference Harrod, Weston and Gregory33
Least salient to HCWs appears to be the relative importance of a task for preventing versus controlling (eg, diagnosing or investigating) an infection in a patient. This dimension reflects why certain tasks are performed, from an IPC perspective. Compared to the first 2 dimensions, the implications of this dimension tend to be removed more in time (eg, changing a central-line dressing to prevent an infection). The lower salience of this dimension may suggest that HCWs prioritize characteristics of tasks that have more immediate implications for their behavior, such as using sterile technique during a high-risk task or donning PPE for a task involving body fluid exposure. Whether adverse outcomes are related to perceptions of this dimension, however, is an avenue for future research as this dimension has not, to the best of our knowledge, appeared previously in the literature.
Lastly, previous studies identified the expectation of patient or environmental contact during a task Reference Harrod, Weston and Gregory33–Reference Krein, Mayer and Harrod35 as a determinant for following infection prevention procedures (eg, using PPE). In the present study, the amount of patient contact in a task was not related to any dimension, even though we included tasks that vary in this respect (eg, “performing perineal care” vs “cleaning up a body fluid spill on the floor”). Previous studies concerned patients on isolation precautions, Reference Harrod, Weston and Gregory33–Reference Krein, Mayer and Harrod35 but our findings suggest that the expectation of patient contact may not be a part of HCW mental models of tasks for patients requiring only standard precautions.
Our study has several limitations. These findings may not be generalizable to other settings and populations. Similarity judgments can depend on the context in which they are elicited. Reference Goldstone, Medin and Halberstadt36 In the present study, participants considered a single description of a generic patient (eg, average-sized and cooperative) who was not on isolation precautions. Given a patient with other characteristics (eg, isolation status), different dimensions or weightings may emerge. Lastly, most participants came from a large academic medical center for adult inpatients; it is possible that other dimensions or weightings may be obtained from HCWs in lower-resourced settings or from HCWs caring for other patient populations (eg, pediatrics Reference Jackson and Griffiths23 ). Thus, future research should vary patient descriptions and include more disparate HCW populations.
Mental model representation techniques not only reveal how individuals structure their beliefs but also allow the similarity of these structures to be measured. Consequently, future research on understanding or modifying IPC behaviors (eg, via training) should consider incorporating mental model representation techniques. Assessing the learner’s mental models before delivering training can be beneficial because most learning involves incorporating new information into what is already known. Reference Chang, Jones and Reisinger10,Reference Cooke, Durso and Schvaneveldt37 Learning is facilitated when information to be learned is organized to be compatible with the learner’s existing mental models. Reference Cooke, Durso and Schvaneveldt37
Moreover, if a gold-standard referent structure exists, then the accuracy of HCW mental models can be assessed (eg, before and after training). Reference Bogdanovic, Petralito, Passerini, Sax, Manser and Clack5,Reference Gonzalvo, Cañas and Bajo38–Reference Schuelke, Day and McEntire40 Mental model accuracy can predict skill acquisition and skill-based performance, Reference Day39 even beyond traditional paper-and-pencil tests of factual knowledge. Reference Schuelke, Day and McEntire40 However, a lack of established referents (eg, for the actual “dirtiness” of patient care tasks) Reference Chang, Jones and Reisinger10,Reference Kruskal and Wish13,Reference Wilson, Bak and Loveday27 may be a barrier to assessing the accuracy of some features of HCW mental models. Nonetheless, techniques for representing HCW mental models open new avenues for understanding, comparing, and ultimately modifying the cognitive determinants of IPC behaviors.
Supplementary material
To view supplementary material for this article, please visit https://doi.org/10.1017/ice.2021.368
Acknowledgments
We thank Josia Mamora for input on selecting patient care tasks and Ellen Jordan for assistance in manuscript preparation. The content is solely the responsibility of the authors and do not necessarily represent the official views of the Centers for Disease Control and Prevention or the National Institute of Allergy and Infectious Diseases.
Financial support
This work was supported by the Centers for Disease Control and Prevention National Infection Control Strengthening Program (grant no. NU38CK000481). J.H.A. was supported by the Antibacterial Resistance Leadership Group fellowship (National Institute of Allergy and Infectious Diseases grant no. UM1AI104681).
Conflicts of interest
All authors report no conflicts of interest relevant to this article.