

1. INTRODUCTION
Multiple interpretations of a social norm often exist. For example, there is a social norm of leaving 15–20% of the bill in gratuity when dining in the USA, as long as service was at least adequate. Norm manipulation is the selection of the interpretation of a norm that best suits an individual (Bicchieri Reference Bicchieri2006; Bicchieri and Chavez Reference Bicchieri and Chavez2010) – in this case, leaving 15% instead of 20%. Bicchieri and Chavez (Reference Bicchieri and Chavez2010) hypothesized that individuals are prone to a self-serving bias in that they adopt beliefs that justify their manipulation of a norm.. Self-serving biases are common, and are often rationalized as justifiable by the involved party (Messick and Sentis Reference Messick, Sentis, Messick and Cook1983; Babcock et al. Reference Babcock, Loewenstein, Issacharoff and Camerer1995; Konow Reference Konow2000; Epley and Caruso Reference Epley and Caruso2004; Bicchieri and Mercier Reference Bicchieri and Mercier2013). A considerable psychological literature in motivated reasoning shows that people have minimal standards when it comes to self-justifications: not every behaviour can be adequately rationalized (Kunda Reference Kunda1990; Mercier and Sperber Reference Mercier and Sperber2011). One way to justify a self-serving interpretation of a norm is to hold a second-order belief that supports it, i.e. a belief that other parties would find that interpretation acceptable and endorse it. We explore this hypothesis empirically by measuring first and second-order beliefs of two parties whose monetary interests in a bargaining situation were not aligned.
Related to norm manipulation is norm evasion – the deliberate, private violation of a norm.Footnote 1 When information is private to one or more parties, there is the temptation to use this information to one's advantage, avoiding norm-abiding behaviour. Consider a person who wants to buy a much-coveted ticket. He knows there will be a long line, and those at the end of the line may find that all tickets have been sold. He could try to arrive very early, but instead he decides to take it easy and arrive with a fake bandage on his foot and a cane. He expects people to allow him to go first, as waiting in line would cause him unnecessary hardship. His private information serves him well, as he can cut the line with impunity.Footnote 2 This is admittedly an extreme case of norm evasion, but less wacky occurrences are far more frequent (Andreoni and Bernheim Reference Andreoni and Bernheim2009). We directly tested for norm evasion by measuring whether individuals chose uneven monetary splits in a bargaining game, despite believing that it was normatively unacceptable and that others believed the same.
Measuring second-order beliefs presents several advantages. On the one hand, mutually consistent second-order normative beliefs suggest that a norm is present. This occurs when most people believe that most people think one should behave in a particular way. On the other hand, measuring second-order beliefs allows us to discriminate among types of players, and predict under which conditions we might expect norm compliance. For example, a player who consistently chooses an equal share in an Ultimatum game may be deemed to be generous, but what if that player believes that only an equal share will be acceptable to her opponent, whereas she also believes that less generous shares are perfectly fair? Such a player may be expected to rationally choose a much less equitable share if the situation allows her to do so with impunity. To explore the possibility of such differences in beliefs and motives, we focus on multivariate techniques that can identify heterogeneity across individuals.
2. BACKGROUND
Tipping in the USA, not cutting in front of others who are waiting in line, and paying for dinner or splitting the bill are all examples of social norms. They are not universally followed rules (leaving a gratuity in Japan is not considered appropriate), nor are they unconditionally followed rules (if enough people are disregarding the long queue for the highway exit, one might be inclined to cut to the front as well). A social norm may be formally defined as a behavioural rule such that sufficiently many people know it exists and prefer to follow it under the condition that they believe that sufficiently many others will (a) also conform to the rule (empirical expectation) and (b) expect them to follow the rule and may be willing to sanction deviations from it (normative expectation) (Bicchieri Reference Bicchieri2006, p.11).Footnote 3 This definition implies that a norm may exist and not always be followed, since individuals may not have the appropriate empirical and/or normative expectations. It is also the case that different individuals may have different sensitivities to a given norm. For a player who does not care much about a norm, the expectation of negative sanctions will be necessary to induce conformity and if transgressions are difficult to detect, some people will be tempted to evade a norm. In ambiguous situations in which more than one norm may apply, or different ‘interpretations’ of a norm may be available, self-serving biases may induce individuals to discount a norm in favour of another that they prefer (Xiao and Bicchieri Reference Xiao and Bicchieri2010) or to choose an interpretation that favours them. For example, when ‘fair’ divisions can be interpreted according to equality or equity rules (Van Avermaet Reference Van Avermaet1974; Messick and Sentis Reference Messick, Sentis, Messick and Cook1983; Konow Reference Konow2000), individual preferences over outcomes tend to determine the interpretation of fairness one adopts. In this case, it looks as if individuals ‘choose’ what to believe. Eliciting second-order beliefs would show that individuals also attribute to others the kind of beliefs that justify their own choices.
To test the hypothesis that norm manipulation and norm evasion are two very different phenomena, we focused on a version of the Ultimatum Game (Guth et al. Reference Guth, Schmittberger and Schwarze1982) in which Proposers proposed a division of a sum of $10.00 to Responders, who accepted or rejected the offer. In the case of a rejection, both parties got nothing. On average, Proposers make offers that are 40–50% of the total amount, and Responders reject offers below 20% about half of the time (Camerer, Reference Camerer2003). This suggests that there is a shared norm of fairness as (roughly) equal division in the standard Ultimatum Game. However, subtle manipulations of the Ultimatum Game can create multiple interpretations of what constitutes fair behaviour. For example, instead of specifying that each party earns nothing if the Responder rejects, Knez and Camerer (Reference Knez and Camerer1995) assigned payoffs of $3.00 to the Proposer and $2.00 to the Responder in case of rejection. Under the interpretation of fairness as equality in payoffs, offers of $5.00 are fair. However, because the Responder can earn $2.00 by rejecting, another interpretation of fairness is equal division of the surplus above the outside offers. In this case the Proposer's offer of (5.50, 4.50) equalizes the difference between received and foregone payoff (5.50−3 = 2.50, and 4.50−2 = 2.50). Whereas average rejection rates typically are 5–25%, in the study of Knez and Camerer (Reference Knez and Camerer1995) rejection rates were close to 50%. They interpret their results by suggesting that Proposers and Responders adopted self-serving beliefs about what constituted a fair offer. Yet since they were comparing rejection rates in a game with two focal divisions to those in a game with only one focal division, their conclusion that a self-serving bias is at work is not necessarily warranted. Assessing Proposers' and Responders' first- and second-order beliefs about fair divisions would have provided a better assessment of the presence of self-serving interpretations of fairness.
Kagel et al. (Reference Kagel, Kim and Moser1996) asked Proposers and Responders to bargain over 100 chips which were worth three times as much for one of the players ($0.30 vs. $0.10 per chip). When chips were worth more for Proposers, and this was common knowledge, both Proposers and Responders adopted self-serving fairness beliefs: Proposers offered slightly more than half the chips, which was an offer of only 1/4 of the money (instead of 75% of the chips, which would be an offer of half the money), and Responders rejected roughly half the time. Clearly Proposers wanted to offer a fair share of the chips, whereas Responders thought they should get a fair share of dollars.
Although the authors of these studies inferred that individuals adopted self-serving interpretations about what constituted fair behaviour, they did not directly measure fairness beliefs, and instead based their inferences on behaviour alone. At least two mechanisms could give rise to such behaviour. On the one hand, Proposers might genuinely believe that uneven monetary splits are fair. On the other hand, Proposers might believe that uneven monetary splits are unfair, but believe that Responders believe that such splits are fair. Uneven offer behaviour is consistent with either explanation, but the psychological mechanisms underlying these two explanations are different. In the first case, a self-serving bias leads Proposers to consider uneven splits to be fair. Given that both even and uneven splits are thought to be fair, Proposers choose the one that yields a higher payoff. This seems to occur in the Knez and Camerer experiment, as well as in the Kagel et al. experiment when players had common knowledge of the different monetary conversion values. In the second case, Proposers suffer no self-serving bias, and knowingly make an unfair offer because Responders lack full information. An example of such patently unfair behaviour occurs in the Kagel et al. (Reference Kagel, Kim and Moser1996) experiment. When only Proposers knew that the chips were worth three times as much for them, they offered, on average, only half of the chips. In this case, rejections were low (and likely expected to be low). Had Proposers been fair, they should have offered 3/4 of the chips to Responders.
To distinguish between these possibilities, we extended the design of Bicchieri and Chavez (Reference Bicchieri and Chavez2010) which used an Ultimatum Game variant to (a) allow multiple interpretations of what constituted a fair offer and (b) create informational asymmetries between Proposers and Responders. Whereas that study did not measure Proposers' first-order fairness beliefs, making it impossible to determine whether norm manipulation or norm evasion occurred, the present study measured both Proposers' and Responders' first- and second-order fairness beliefs, allowing us to directly assess the presence of norm manipulation and norm evasion.
3. METHODS
Participants
Sixty-four college-age participants took part in our study across six experimental sessions. Advertisements specified that participants would earn $5 in addition to an amount that would depend on decisions made during the experiment.
Game paradigm
Our experimental design employed a variant of the Ultimatum Game in which one participant, the Proposer, provisionally received a sum of $10 – provided by the experimenter – and then proposed a division of that money to an anonymous Responder. The Responder subsequently decided to accept or reject the proposal. If the Responder accepted, both players received the amounts specified in the proposal. If the Responder rejected, both players received $0. The Proposer chose from one of the following options:
(5,5) – to propose $5 for the Proposer and $5 for the Responder;
(8,2) – to propose $8 for the Proposer and $2 for the Responder;
Coin – to let the outcome of a fair coin flip determine the proposal: Heads corresponded to (5,5) and tails to (8,2).
Procedure
An experimenter randomized participants into one of two rooms upon their arrival, which determined whether they would be a Proposer or a Responder for the duration of the study. We distributed and read aloud instructions that explained the Ultimatum Game, that participants would play three such games with a different person chosen at random in the other room, that all choices and responses were strictly anonymous, and that participants would be paid in cash at the end of the experimental session for two of the three games chosen at random. Before each game, an experimenter provided additional written instructions to participants and read them aloud. Participants also took a short quiz to ensure that they understood these instructions. After completing the quiz, but prior to making or receiving a proposal, Proposers and Responders completed questionnaires that measured their empirical expectations and first- and second-order fairness beliefs (normative expectations). Finally, Proposers completed proposal forms and Responders responded to them. The full set of instructions and proposal forms can be found in Online Appendices A and B.
Fairness beliefs and empirical expectations
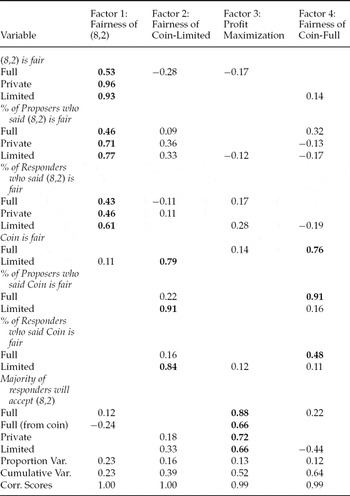
Online Appendices C and D show the questionnaires that were used to measure Proposers' and Responders' empirical expectations and first- and second-order fairness beliefs (normative expectations). Table 3 also provides a condensed listing of the questions. Items regarding the Coin option were omitted in the private condition, as Responders did not know that the Coin option was available in that condition, and Proposers understood this.
The questionnaires allowed us to measure whether each Proposer considered each choice option to be fair by condition, Proposers' beliefs about Responders' and other Proposers' fairness beliefs, Proposers' beliefs about Responders' behaviour conditional on each offer, and various Responders' beliefs. These belief variables allowed us investigate the presence of norm manipulation, norm evasion, and which beliefs were most relevant to Proposers' choices.
Information condition
Participants played three Ultimatum Games under different information conditions in a fixed-order, within-subjects design. In the full information condition, Proposers marked on a proposal form whether their choice was (5,5), (8,2) or Coin. Subsequently, the experimenter in the room of Responders publically flipped a coin. On any forms on which the Proposer chose Coin, the experimenter marked (5,5) or (8,2), based on the coin flip outcome. Thus, all participants understood that the Coin option was available and that Responders would know if the Proposer with whom they were paired chose Coin.
In the private information condition, Responders did not know that Coin was available to Proposers, and Proposers were aware of this fact. To create this informational asymmetry, we left Coin off of the proposal form, but allowed Proposers to choose Coin by leaving the remaining options ((5,5) and (8,2)) unmarked on the form. An experimenter in the room of Proposers then flipped a coin. On any forms on which the Proposer chose Coin, the experimenter marked (5,5) or (8,2), based on the coin flip outcome. Thus, Responders only saw a form with either (5,5) or (8,2) marked, and were unaware of the existence of the Coin option.
In the limited information condition, all participants knew that the Coin option was available, but that the Responder would not be able to distinguish whether the Proposer chose (5,5) or (8,2) directly, or chose Coin whose outcome was (5,5) or (8,2). To create this information condition, we listed (5,5), (8,2), and Coin on the proposal form, but instructed all participants that Proposers could only choose Coin by leaving all options unmarked. After Proposers made their choices, the experimenter in the room of Responders privately flipped a coin. On any forms on which the Proposer chose Coin, the experimenter marked (5,5) or (8,2), based on the coin flip outcome.
We fixed the order of conditions as (1) full, (2) private and (3) limited because a different ordering led to confusion in pilot studies. Because we did not provide Proposers with feedback between conditions, and because participants only played three games, we expected any effects of learning without feedback (Weber, Reference Weber2003) to be minimal.
4. RESULTS
Testing hypotheses about individual motives for action requires that we assume there is consistency between individual beliefs and behaviour. This is especially important when beliefs refer to other players’ beliefs and behaviour, since one's choices in strategic situations are conditional on those beliefs. It is a basic practical rationality assumption that cannot be abandoned if we want to retain predictability.Footnote 4 In what follows we shall examine two main hypotheses about motives: Profit maximization and social norms. Analysis of belief-choice pairs consistency provides support for the latter hypothesis only.
Common knowledge of profit maximization hypothesis
We begin by testing the basic hypothesis that participants only care about their monetary payoffs. This hypothesis is usually accompanied by an assumption of risk neutrality, and in what follows we shall assume risk neutrality throughout. Under the assumptions that participants sought to maximize their individual monetary gains and that this was common knowledge:
(1) No Responder should ever reject any of the three possible offers, because accepting any offer yields a positive payoff and rejecting yields a payoff of $0.00,
(2) Proposers should therefore:
(a) Always believe that Responders will accept any positive offer,
(b) Always propose (8,2), because conditional on the Responder accepting, (8,2) maximizes the Proposer's payoff.
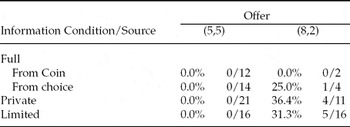
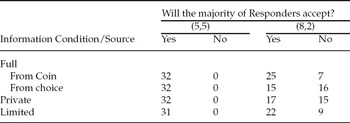
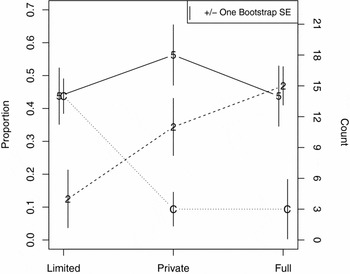
As Table 1 shows, respectively in the full, private and limited information conditions, Responders rejected (8,2) offers 1 of 4 times (25%), 4 of 11 times (36%) and 5 of 16 times (31%), contrary to the first prediction. Moreover, as Table 2 shows, between 15 of 31 (48%) and 25 of 32 (78%) of Proposers, depending on the condition, believed that fewer than half of Responders would accept (8,2), contrary to prediction 2a. Finally, as Figure 1 shows, between 16 of 32 (50%) and 28 of 32 (88%) of Proposers, depending on the condition, did not choose (8,2), contrary to prediction 2b. Thus, as expected, there was strong evidence against the hypothesis of common knowledge of profit maximization.
Rejection behaviour by offer, information condition and offer source (Coin or choice)

Proposers' beliefs about whether the majority of Responders would accept (5,5) and (8,2) by information condition and offer source

Note: Three rows total less than 32 because of missing data due to clerical error
Proportions/counts of (5,5), (8,2), and Coin choices (indexed by lines labelled 5, 2, and C) by condition. N = 32 for each condition.

Profit maximization without common knowledge hypothesis
It was possible that Proposers sought to maximize their monetary gains, but did not know whether Responders would do the same. According to this hypothesis, Proposers who are risk neutral would make an offer that yielded the highest expected value based on their beliefs about Responder behaviour. Although we did not measure Proposers' exact probabilistic beliefs of whether the Responder would accept a particular offer, we recorded whether each Proposer believed the majority of Responders would accept a particular offer. Table 2 tabulates these responses.
Because 100% of Proposers believed the majority of Responders would accept (5,5), regardless of the information condition or offer source, the expected value of (5,5) was $5.00. It follows that a profit-maximizing Proposer who believed half or fewer than half of Responders would accept (8,2) would never propose (8,2), because the expected value of choosing (8,2) was at most $4.00. Such Proposers would also never choose Coin, because E[Coin] = $2.50 + $4.00q ≤ $4.50, where q ≤ 0.5 is the Proposer's unmeasured belief about the proportion of Responders who would accept (8,2). Thus, we predicted that no Proposer would choose (8,2) or Coin if they believed half or fewer than half of Responders would accept (8,2).
Contrary to this prediction, of the Proposers who believed half or fewer of Responders would accept (8,2), 3 of 15 proposed (8,2) in the private condition, 3 of 9 proposed (8,2) in the limited condition, 1 of 7 proposed Coin in the full condition, and 2 of 9 proposed Coin in the limited condition. The non-zero proportion of Proposers who chose (8,2) or Coin implies inconsistent belief-choice pairs among at least some subjects under the profit maximization hypothesis, providing evidence against this hypothesis.
Finally, of the choices of the remaining Proposers – those who believed the majority of Responders would accept (8,2) – 20 of 96 (21%) were Coin. According to the (risk neutral) profit maximization hypothesis, however, such Proposers should never strictly prefer coin, because when q > 5/8, choosing (8,2) uniquely maximizes expected value, whereas when q < 5/8, choosing (5,5) uniquely maximizes expected value.Footnote 5 In sum, there was substantial evidence that Proposers did not simply maximize expected value conditional on their beliefs about Responder behaviour.
Social norms hypothesis
Theories of monetary gains maximization were not sufficient to explain participants' behaviour. Moreover, profit maximization theories are agnostic as to why Proposers' beliefs and behaviour varied across information conditions, even when monetary consequences were held fixed. The theory of social norms we adopt predicted that participants would be focused on different fairness norms when we manipulated their first- and second-order fairness beliefs defined, respectively, as (1) which offers they considered fair, and (2) which offers they believed others considered fair. Before analysing the belief data, however, we first tested our primary hypotheses concerning behaviour by analysing the distribution of offers across information condition.
Predictions about frequencies of behaviour by condition
In the full information condition, because information about the coin flip was complete (whether the Proposer chose to flip a coin and the outcome of the coin flip were both public knowledge) and normative expectations for coin were present,Footnote 6 we expected more coin choices in this condition relative to the others. In the limited information condition, because Proposers could take advantage of the ambiguity created by the opacity of the offer source (an offer of (8,2) could have been generated by a Coin choice, and the Responder could not determine whether the Proposer chose coin), we expected the highest frequency of (8,2) choices. Finally, Proposers essentially faced a choice between (5,5) and (8,2) in the private condition, as the Coin choice was not known to Responders, and thus there were no normative expectations to choose Coin; we therefore expected the highest frequency of (5,5) choices in this condition.
Figure 1 shows aggregated offer proportions by condition. Fisher's exact test rejected the null hypothesis of no association between offer and condition (p = 0.0012). The hypothesis that (5,5) offers were more likely in the private condition than the other conditions was not supported by Fisher's one-sided exact test (OR = 1.64, p = 0.1739). However (8,2) was more likely in the limited condition than in the other conditions (OR = 2.85, p = 0.0187), and Coin was more likely to be selected in the full condition than in the other conditions (OR = 7.34, p = 0.0002), as expected. Planned follow-up permutation testsFootnote 7 (p-values uncorrected) revealed that the effect of (8,2) in the limited condition was attributable to a difference from the full condition (OR = 6.18, p < 0.0001) but not the private condition (OR = 1.68, p = 0.1331). On the other hand, the effect of Coin in the full condition was attributable to a difference from the limited condition (OR = 7.52, p = 0.0080) or the private condition (OR = 7.52, p = 0.0080).
Therefore, we found support for two of our three primary hypotheses, reproducing the basic findings of Bicchieri and Chavez (Reference Bicchieri and Chavez2010). Whereas the proportion of (5,5) offers stayed constant across conditions, (8,2) was more likely in the limited condition, in which Proposers could take advantage of the ambiguity of the source of their offer, and Coin was more likely in the full condition, in which Proposers could not ignore normative expectations to make a fair offer, and their second-order beliefs (normative expectations) about Responders indicated Coin was believed to be fair by a large majority of Responders.
Fairness beliefs
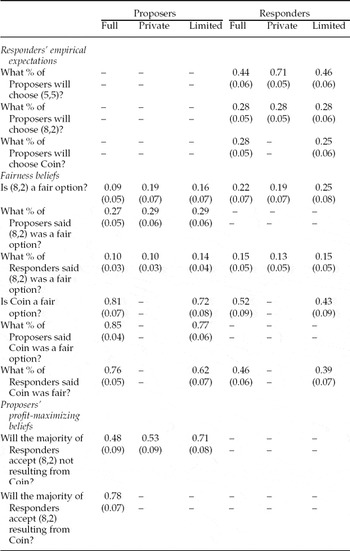
Table 3 presents descriptive statistics for the 19 variables that comprised the Proposers' belief data, and the 19 variables that comprised the Responders' belief data. We omitted most belief variables involving (5,5), as participants universally considered (5,5) to be fair and believed that (5,5) would be accepted by the majority of Responders.
Means (SEMs) for the belief data

Note: The yes/no questions (‘Is . . . a fair option?’ and ‘Will the majority . . .?’) were dummy coded as 1 (yes) or 0 (no); therefore, the means for these questions were the proportions of individuals who answered yes.
Responders' beliefs about the proportions of Proposers who would choose (5,5), (8,2) and Coin were largely insensitive to experimentally created informational asymmetries, as indicated by the constancy of expected proportions of (8,2) and Coin choices across information conditions. Responders believed, however, that there would be a dramatic increase in the proportion of (5,5) choices in the private condition, although they expected the proportion of (8,2) choices to stay the same as in the full and limited information conditions. Thus, they believed that a stable fraction of Proposers would choose Coin when it was an available option, but would instead choose (5,5) when it was unavailable; that is, Responders believed Proposers had a conditional preference for choosing Coin.
Norm manipulation
Both Proposers and Responders generally considered (8,2) to be unfair, and believed that others considered it to be unfair. The proportion of Proposers who considered (8,2) to be fair did not differ from the proportion of Responders who considered it to be fair (χ2(1) = 1.90, p = 0.17, in the full condition; χ2(1) = 0.00 in the private condition; and χ2(1) = 0.87, p = 0.35, in the limited condition). However, more Proposers than Responders considered Coin to be fair, both in the full information condition (81% vs. 52%, χ2(1) = 6.93, p = 0.0085) and in the limited information condition (72% vs. 43%, χ2(1) = 6.35, p = 0.0117). Second-order beliefs about the fairness of Coin exhibited the same pattern; in the full information condition, Proposers believed 76% of Responders considered Coin fair, whereas Responders believed only 46% of Responders considered Coin fair (t(61) = 3.70, p < 0.001), and in the limited information condition, the respective figures were 62% and 39% (t(62) = 2.46, p = 0.0168). Thus, when multiple interpretations of a social norm were available (many Responders believed that Coin, in addition to (5,5), was fair), Proposers exhibited a self-serving bias in both first- and second-order beliefs about the fairness of Coin. Under an alternative theory of self-serving norm manipulation, individuals who offered Coin could have believed that Coin was unfair, but that Responders considered it to be fair. However, 11 of the 14 Proposers who chose Coin in the full information condition believed that Coin was fair. Thus, taken together, these findings provided evidence of a particular brand of norm manipulation, in which individuals adopted an interpretation of a norm that best suited them, while simultaneously exhibiting self-serving biases in their first- and second-order beliefs about the normative acceptability of that interpretation.Footnote 8
Norm evasion
We hypothesized that Proposers who chose (8,2) in the limited information condition did so despite believing that (8,2) was unfair, and despite believing that most Responders and other Proposers considered (8,2) to be unfair. In the limited condition, because Responders could not distinguish between (1) a choice of (8,2), and (2) a Coin choice that resulted in an offer of (8,2), Proposers could deliberately ignore normative expectations. By measuring Proposers' fairness beliefs, we were able to directly test for the presence of norm evasion. Eleven of the 15 Proposers who chose (8,2) in the limited condition believed that (8,2) was not fair. Moreover, Proposers who chose (8,2) in the limited condition believed on average that only 34% of other Proposers and 21% of Responders thought (8,2) was fair. Thus, we found direct evidence that Proposers intentionally ignored normative expectations in the limited condition in order to evade a norm of fairness.
Structure of fairness beliefs
To explore the heterogeneity in Proposers' beliefs, we subjected the 19 variables comprising the Proposers' belief data to an exploratory factor analysis. We selected a four-factor solution based on successive significance tests at the alpha = 0.05 level (oblimin rotated).Footnote 9
Table 4 shows the resulting factor solution. The pattern of loadings led to four clearly interpretable factors with a simple structure. Factor 1 loaded on Proposers' first- and second-order beliefs about the fairness of (8,2). Proposers with high scores on Factor 1 believed that (8,2) was fair across conditions, and that other Proposers and Responders also believed (8,2) was fair. Factors 2 and 4 loaded on beliefs about the fairness of Coin in, respectively, the limited information condition and the full information condition. Proposers with higher scores on Factor 2 believed that Coin was fair in the limited information condition, and that other Proposers and Responders believed the same; those with higher scores on Factor 4 had analogous beliefs about the fairness of Coin in the full information condition. Finally, Factor 3 loaded on beliefs about whether the majority of Responders would accept (8,2). Thus, Factors 1, 2 and 4 represented Proposers' first- and second-order normative beliefs about (8,2) and Coin, whereas Factor 3 represented profit-maximizing considerations.
Factor loadings for proposers' belief data from a four-factor EFA

Note: Only loadings with a magnitude of at least 0.10 are shown. An oblimin rotation was applied. Loadings used to interpret each factor are in bold.
Fairness beliefs as predictors of behaviour
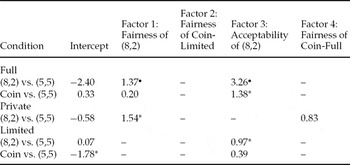
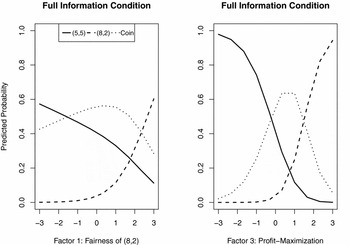
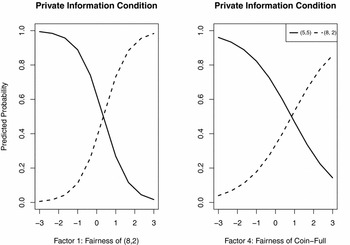
To investigate whether beliefs predicted choices, we entered standardized regression factor scores (Thurstone, Reference Thurstone1935) into multinomial logit models of choices, and used AIC-based stepwise variable selection to find a set of informative factors.Footnote 10Table 5 shows the logit estimates of the resulting models, and Figures 2–4 plot the corresponding predicted choice probabilities by factor scores.
Logit coefficients of factor scores as predictors of proposers' choice, by information condition

p < 0.10, *p < 0.05.
Note. The factors to retain as predictors were chosen by minimizing AIC through stepwise regression.
Predicted choice probabilities in the full information condition, by Factors 1 and 2, based on the model in Table 5. To compute the predicted probability as a function of Factor 1 (left graph), the value of Factor 3 was held fixed at its mean. Analogously, the value of Factor 1 was held fixed at its mean in the right graph.

Predicted choice probabilities in the private information condition by Factors 1 and 4, based on the model in Table 5. To compute the predicted probability as a function of Factor 1 (left graph), the value of Factor 4 was held fixed at its mean. Analogously, the value of Factor 1 was held fixed at its mean in the right graph.

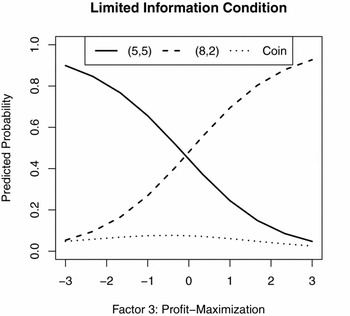
Predicted choice probabilities in the limited information condition by Factor 3.

In the full information condition, the two factors retained had qualitatively similar effects on choice probabilities. For Proposers with extremely low scores on Factor 1 or Factor 3 – respectively reflecting the belief that (8,2) was unfair and that others agreed, and the belief that Responders would reject (8,2) – the probability of choosing (8,2) was very low, and the probability of choosing (5,5) was highest (see Figure 2). As scores on Factors 1 or 3 increased from extremely low to extremely high values, the probability of (5,5) monotonically declined, whereas the probability of (8,2) monotonically increased, with the two options being equiprobable at respective factor scores of two standard deviations above the mean for Factor 1 and one standard deviation above the mean for Factor 3. The probability of choosing Coin, on the other hand, exhibited an inverted-U shaped curve as factor scores increased from extremely low to extremely high values, reaching a maximum probability of roughly 0.55–0.65 when the factor score was half a standard deviation above the mean. That Factors 1 and 3 were informative predictors of choice in a simultaneous regression model strongly supported the social norms hypothesis, as empirical and normative expectations predicted choice in the expected directions, even when controlling for the effects of profit-maximizing considerations.
In the private information condition, the predicted probability of the Proposer choosing (5,5) monotonically decreased as Factor 1 scores or Factor 4 scores increased (see Figure 3). Slightly above the mean score for Factor 1, and one standard deviation above the mean score for Factor 4, (5,5) and (8,2) were equiprobable. To reiterate, Factors 1 and 4 – which reflected beliefs that (8,2) overall and Coin in the full condition were fair and considered fair by others – were more informative predictors of choice than Factor 3, which reflected beliefs about the likelihood of (8,2) being accepted. This finding further supported the social norms hypothesis. Firstly, empirical and normative expectations were more predictive of choice than profit-maximizing considerations. Secondly, the effect of Factor 4 suggested that only Proposers who were sensitive to social norms – i.e. those who believed Coin was empirically and normatively acceptable in the full information condition – chose (8,2) over (5,5) in the private condition; those who chose (5,5) over (8,2) in the private condition held first- and second-order beliefs that Coin was not fair in the full information condition. We return to this issue of patterns of choices across conditions in subsequent analyses.
Finally, in the limited information condition, as Factor 3 scores increased, the predicted probability of the Proposer choosing (5,5) monotonically declined, whereas the probability of (8,2) monotonically increased (see Figure 4). Profit-maximizing motives therefore appeared to dominate in this condition, as Proposers knew that Responders could not distinguish between a choice of (8,2) and a choice of Coin which resulted in an offer of (8,2). In fact, only 48.3% and 53.1% of Proposers believed the majority of Responders would accept (8,2) in the full and private information conditions, respectively, but 71.0% believed the majority of Responders would accept (8,2) in the limited condition.
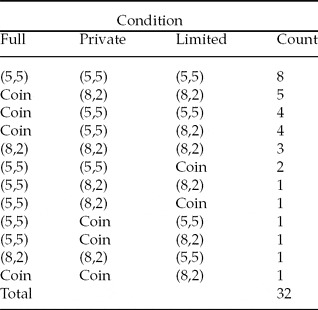
Patterns of proposers' choices across conditions
We expected different patterns of correlated choices across conditions, with some choice patterns corresponding to Proposers who were sensitive to social norms of fairness, and other choice patterns corresponding to expected value maximization. According to the social norms hypothesis, in the full information condition, norm-following Proposers should choose Coin because they believed that the majority of Responders and Proposers considered Coin to be fair (see Table 3), whereas expected value maximizers should choose (5,5) or (8,2) based on their expected values. Because normative expectations for Coin were absent in the private information condition, both types should choose (5,5) or (8,2) based on their expected values, with the constraint that expected value maximizers should make the same choice in the full information condition, as their preferences are, by definition, insensitive to normative expectations. In the limited information condition, normative expectations for Coin were present (see Table 3), but norm conformity could not be assessed by Responders due to the opacity of the offer source (a direct choice or the result of a coin flip). Thus, either (5,5) or (8,2) could be expected, with the constraint that any Proposer who chose (8,2) in the full or private conditions should choose (8,2) in the limited condition as well, as the probability of (8,2) being rejected in the latter condition is, ceteris paribus, lower than in the former conditions. To summarize, of the 27 possible patterns of choices across conditions, we expected to observe the following six patterns: Coin-(5,5)-(8,2), Coin-(8,2)-(8,2), Coin-(5,5)-(5,5), (5,5)-(5,5)-(5,5), (5,5)-(5,5)-(8,2), and (8,2)-(8,2)-(8,2).
Table 6 tabulates observed offer patterns across conditions. Twenty-four of the 32 observed patterns were contained in the list of expected patterns generated by the social norms hypothesis. The only offer pattern on our list of expected patterns for which there were no observations was (5,5)-(5,5)-(8,2). For the remaining observed offer patterns, the Proposer offered Coin in either the private or limited condition, with the exception of the pattern (8,2)-(8,2)-(5,5). On the whole, the observed patterns were consistent with predictions based on a theory of social norms.
Tabulation of offer patterns across conditions.

Note: The patterns we expected to observe are in bold.
5. CONCLUSION
Basic theories of profit maximization were inadequate in explaining Proposers' behaviour, and did not provide an explanation for differences in beliefs or choice frequencies across information conditions. A theory of social norms predicted, however, that participants would be focused on different fairness norms when we manipulated their first- and second-order fairness beliefs and that their behaviour would vary accordingly. We replicated the basic findings of Bicchieri and Chavez (Reference Bicchieri and Chavez2010) by showing that the frequency of (8,2) was highest in the limited condition, in which Proposers could take advantage of the opacity of the source of their offer, and that the frequency of Coin was highest in the full information condition, in which Proposers could not ignore normative expectations to make a fair offer. Proposers' beliefs varied in informative ways, revealing that the fairness of (8,2) and Coin and beliefs about whether (8,2) would be accepted were important directions of variation, and moreover, that they jointly explained choices. Choice patterns across conditions also followed patterns that were predicted by a theory of social norms, and individuals could be separated into two classes based on their choice patterns: those who generally offered (5,5) and believed (8,2) was unfair and unlikely to be accepted, and those who offered Coin or (8,2) whenever their likelihood of acceptance was high and who believed (8,2) was generally fair and likely to be accepted.
By measuring Proposers' beliefs about the fairness of each option and their beliefs about whether others considered each option to be fair, we were able to directly assess the presence and type of norm manipulation. In the full information condition, Proposers adopted an interpretation of the norm that best suited them by offering Coin. Under one theory of norm manipulation, Proposers could have considered Coin to be unfair but believed that Responders considered it to be fair. However, this was not the case; Proposers both believed Coin was fair and believed that others considered it fair. Moreover, Proposers exhibited self-serving biases in their beliefs when compared with Responders. Thus, in our data, norm manipulation did not operate as an explicit, calculating process in which individuals assessed whether others viewed each option as normatively acceptable, and then selected the one that best suited them. Instead, it operated as an implicit process in which individuals’ self-serving biases in assessing the normative acceptability of different options drove behaviour, consistent with the interpretations of Knez and Camerer (Reference Knez and Camerer1995) of their behavioural data.
We also found direct evidence consistent with the presence of norm evasion – the deliberate, private violation of a social norm. Despite their beliefs that (8,2) was unfair and was considered unfair by others in the limited condition, Proposers chose (8,2). Because Proposers' choices were private, they intentionally ignored normative expectations in order to evade a norm of fairness with impunity.
To conclude, we directly measured first and second-order fairness beliefs in bargaining games to understand norm manipulation and norm evasion, and add to previous behavioural studies that did not measure beliefs. In the study of Kagel et al. (Reference Kagel, Kim and Moser1996) discussed in the Background section, Proposers made even chip splits (uneven monetary splits) when both Proposers and Responders knew chip values. But in a separate condition in which only Proposers knew the chip values, Proposers also offered roughly even chip splits. Based on our findings, we hypothesize that Proposers' beliefs were very different in these two conditions. In the first, it is likely that Proposers considered even chip splits to be fair as the result of a self-serving bias, as the authors infer. In the second, however, Proposers likely suffered no such self-serving bias, and instead simply believed that they were ‘getting away’ with unfair behaviour due to the informational asymmetry. Thus, norm manipulation and norm evasion are similar phenomena in their lack of norm conformity, but differ greatly in their psychological motivations. Norm manipulation is characterized by genuine, self-serving beliefs, as opposed to deliberate, calculated violations of a norm when multiple interpretations are available. Norm evasion, on the other hand, is characterized by the deliberate violation of a norm when information is private.