INTRODUCTION
Expression of the high sugar trait in perennial ryegrass (Lolium perenne L.) cultivars has been inconsistent between previous studies, possibly reflecting the influence of a genotype×environment interaction (Edwards et al. Reference Edwards, Parsons, Rasmussen, Chapman, Clark, Macmillan and Nation2007a). Expression of the high sugar trait has been more consistent in Europe (Halling et al. Reference Halling, Longland, Martens, Nesheim, O'Kiely, Luscher, Jeangros, Kessler, Huguenin, Lobsiger, Millar and Suter2004; Tas et al. Reference Tas, Taweel, Smit, Elgersma, Dijkstra and Tamminga2006; Taweel et al. Reference Taweel, Tas, Smit, Elgersma, Dijkstra and Tamminga2006) than in New Zealand and Australia (Smith et al. Reference Smith, Simpson, Oram, Lowe, Kelly, Evans and Humphreys1998; Parsons et al. Reference Parsons, Rasmussen, Xue, Newman, Anderson and Cosgrove2004; Francis et al. Reference Francis, Chapman, Doyle and Leury2006; Hume et al. Reference Hume, Hickey, Lyons and Baird2010). Parsons et al. (Reference Parsons, Rasmussen, Xue, Newman, Anderson and Cosgrove2004) found that water-soluble carbohydrate (WSC) concentrations were not elevated in the high sugar cultivars AberDart and AberDove under field conditions in New Zealand, and their subsequent work in environmental chambers (published in the same paper) suggested that low temperatures may be necessary for consistent expression of the trait to occur. Consistent with this theory, Francis et al. (Reference Francis, Chapman, Doyle and Leury2006) reported no difference in non-structural carbohydrate (WSC plus starch) concentration between the high sugar cultivar AberDawn and the control cultivar AberElan in the warm conditions of Northern Victoria, Australia. Hume et al. (Reference Hume, Hickey, Lyons and Baird2010) measured the highest expression of WSC in a range of high sugar cultivars in the cooler of the two New Zealand sites where testing was carried out (Gore v. the warmer Palmerston North). Expression of the high sugar trait in perennial ryegrass cultivars in the cool conditions of North West Tasmania would further support this theory of a genotype×environment interaction and that low temperatures are required to trigger expression of the trait.
To infer whether elevated WSC concentrations may positively influence components of milk production, it is necessary to consider the relative proportions of WSC and crude protein (CP) in the herbage. Water soluble carbohydrates are the most readily digestible component of perennial ryegrass, and higher concentrations in consumed herbage are thought to contribute to more readily available metabolizable energy (ME) in the rumen. The higher content of readily available ME in turn enhances the efficiency of protein utilization, allowing a greater portion of nitrogen (N) to be partitioned to growth and milk production and less to urine (Beever Reference Beever, Baker, Crush and Humphreys1993; Cosgrove et al. Reference Cosgrove, Burke, Death, Hickey, Pacheco and Lane2007; Edwards et al. Reference Edwards, Parsons, Rasmussen, Chapman, Clark, Macmillan and Nation2007a). The productivity benefits are matched with the environmental benefits of less N being lost to the soil, ground water and nitrous oxide emissions (Pacheco et al. Reference Pacheco, Burke, Cosgrove, Chapman, Clark, Macmillan and Nation2007; Easton et al. Reference Easton, Stewart, Lyons, Parris and Charrier2009). However, it has been suggested that the WSC to CP ratio of consumed herbage may have a more significant influence on N partitioning than carbohydrate alone (Cosgrove et al. Reference Cosgrove, Burke, Death, Hickey, Pacheco and Lane2007; Edwards et al. Reference Edwards, Parsons, Rasmussen, Chapman, Clark, Macmillan and Nation2007a, Reference Edwards, Parsons, Rasmussen and Bryantb). In European studies, the effect of high herbage WSC concentrations on N partitioning and components of milk production indeed appears to have been mediated by herbage CP concentrations (Moorby et al. Reference Moorby, Evans, Scollan, MacRae and Theodorou2006; Tas et al. Reference Tas, Taweel, Smit, Elgersma, Dijkstra and Tamminga2006; Taweel et al. Reference Taweel, Tas, Smit, Elgersma, Dijkstra and Tamminga2006). The high CP concentrations (>200 mg/g DM) of perennial ryegrass-based pasture in Australia and New Zealand dairy systems may therefore reduce the likely benefits of higher WSC concentrations, in regards to improved protein utilization in the rumen. Edwards et al. (Reference Edwards, Parsons, Rasmussen, Chapman, Clark, Macmillan and Nation2007a) suggest that for these intensively managed dairy pastures an increase of 100–200 mg/g DM WSC is necessary to achieve a WSC : CP ratio of 0·7, which is thought to be needed to contribute to more efficient N partitioning. Parsons et al. (Reference Parsons, Edwards, Newton, Chapman, Caradus, Rasmussen and Rowarth2011) have shown that a WSC : CP ratio of 1·5 is achievable in Canterbury, New Zealand and suggest that this is an optimal ratio for ensuring more efficient N partitioning. Lee et al. (Reference Lee, Matthew, Thom and Chapman2012) reason that this ratio is often unachievable in temperate dairy systems with high N pastures and therefore high herbage CP concentrations. In the current study, trait expression in high sugar perennial ryegrass cultivars compared with a control has been measured as both the differences in herbage WSC concentration and WSC : CP ratio. The WSC : CP ratio of 0·7 has been given priority as a benchmark figure, recognizing that there is a progressive decline in the proportion of N intake excreted as urine at a WSC : CP ratio exceeding 0·7 (Parsons et al. Reference Parsons, Edwards, Newton, Chapman, Caradus, Rasmussen and Rowarth2011).
Herbage WSC and CP concentrations vary throughout the regrowth cycle in perennial ryegrass plants, as do other components of nutritive value, and this, along with DM yield, should be taken into account when assessing expression of the high sugar trait. It is widely known that the herbage CP concentration of perennial ryegrass decreases and WSC concentration increases during plant re-growth (Minson Reference Minson1990; Fulkerson & Donaghy Reference Fulkerson and Donaghy2001; Turner et al. Reference Turner, Donaghy, Lane and Rawnsley2006a; Rasmussen et al. Reference Rasmussen, Parsons, Xue and Newman2009). Leaf re-growth stage provides an objective, comparable measure of plant re-growth between cultivars and studies, based on the expansion of leaves per tiller (Donaghy & Fulkerson Reference Donaghy and Fulkerson1998). Rasmussen et al. (Reference Rasmussen, Parsons, Xue and Newman2009) measured higher levels of herbage WSC in AberDart and high sugar cultivar breeding line PG1113 than UK and New Zealand control cultivars throughout a re-growth cycle following a single defoliation. How changes in herbage WSC and other components of nutritive value occur with continuing leaf stage-based defoliation in high sugar cultivars compared with a control cultivar is of interest. Likewise, while high sugar cultivars are developed to express higher levels of herbage WSC, their DM yield capacity must also be considered. Smith et al. (Reference Smith, Simpson, Oram, Lowe, Kelly, Evans and Humphreys1998) recorded the expression of the high sugar trait in Australia across three sites in Victoria and Queensland, as well as an increased nutritive value for the high sugar cultivars Aurora and breeding line Ba 11351. However, the high sugar cultivars were found to have reduced persistence and generally lower DM yields than the control cultivars, Kangaroo Valley, Ellett and Vedette. It is therefore important to test the expression of the high sugar trait under contrasting defoliation intervals, and confirm that any elevation in WSC concentration does not occur at the expense of DM yield or nutritive value.
The current study sought to determine whether the cool temperate conditions of North West Tasmania, Australia are suitable for the expression of a high sugar trait in perennial ryegrass cultivars. Expression was defined as the herbage WSC concentration and the ratio of WSC to CP (WSC : CP) of AberMagic (developed in Aberystwyth) and SF Joule (developed in Europe) compared with that of a New Zealand control cultivar, Arrow. It was hypothesized that plant leaf stage would strongly influence expression of the high sugar trait, and this was tested through implementation of two defoliation interval treatments based on leaf re-growth stage.
MATERIALS AND METHODS
Experimental design
Twenty-four 2×3 m plots were arranged in a randomized complete block design with two treatment factors (three cultivars and two defoliation intervals) and four blocks.
Treatment details were as follows:
Cultivars: SF Joule (high sugar perennial ryegrass cultivar; developed in Europe; AR1 endophyte present), AberMagic (high sugar perennial ryegrass cultivar; developed in Aberystwyth; nil endophyte) and Arrow (control perennial ryegrass cultivar, developed in New Zealand; AR1 endophyte present).
The frequency of endophyte-infection was not verified by assaying for endophyte-infected tillers in field plots.
Defoliation interval: Defoliation interval treatments were implemented from 4 March 2011 to 1 March 2012, based on the time taken for either 1·5 or 3 leaves per tiller to fully expand. As rate of leaf appearance was constant between defoliation treatments every second defoliation at the 1·5-leaf stage coincided with defoliation at the 3-leaf stage of re-growth. The full expansion of each new leaf was termed one ‘leaf stage’ (Donaghy & Fulkerson Reference Donaghy and Fulkerson1998).
Management
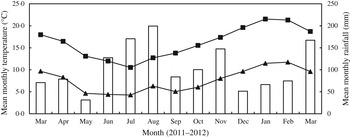
Site preparation commenced in October 2010, with the experiment commencing in March 2011 and concluding in March 2012. The site was situated on a deep clay loam ferrosol soil (red mesotrophic haplic ferrosol; Isbell Reference Isbell1996) at the Tasmanian Institute of Agriculture Dairy Research Facility in Elliott, North West Tasmania (41°4′S, 145°46′E, 155·0 m a.s.l.). This region experiences a winter-dominant pattern of rainfall and mean annual rainfall of 1202 mm. The mean daily maximum and minimum temperatures and monthly rainfall for the period of the experiment is provided in Fig. 1. Both maximum and minimum monthly temperatures were within 0·7 °C of long-term weather records (>35 years) when averaged across the year. Annual rainfall for the experimental period was 1202 mm. Climate data for this site was accessed as a Patched Point Dataset from the Bureau of Meteorology SILO database (Jeffrey et al. Reference Jeffrey, Carter, Moodie and Beswick2001). All plots were irrigated in the summer/autumn season of both years, to maintain optimal soil moisture levels. A rainfall deficit (potential evapotranspiration minus rainfall) of 20 mm was implemented to schedule irrigation, at which point 20 mm of irrigation was applied.
Mean monthly maximum (■) and minimum (▲) temperature and monthly rainfall (white bars) from March 2011 to March 2012, for Elliott, Tasmania.

Plots were hand sown in October 2010 with three perennial ryegrass cultivars (sowing rates adjusted by seed size and germination rates to give 1686 viable seeds/m): SF Joule (35·5 kg/ha), AberMagic (26·9 kg/ha) and Arrow (40·0 kg/ha). Two pre-treatment defoliations occurred prior to 4 March 2011, from which point defoliation treatments proceeded at the 1·5-leaf and 3-leaf stages of re-growth.
The site was sprayed with the non-selective herbicide RoundUp® (active ingredient (a.i.) 0·36 glyphosate; RoundUp, Columbus, Ohio, USA), and rotary-hoed prior to sowing. If the proportion of non-target grasses or weeds in any plots exceeded 0·05 (by visual assessment), all plots received Agritone® (a.i. MCPA, present as dimethylamine salt, 750 g/l) at a rate of 1·5 litres/ha. This occurred twice during the experimental phase, in March 2011 and January 2012.
The soil fertility of the site (sampled to a depth of 75 mm) prior to commencing the experiment was as follows: Olsen phosphorus (P) – 28·8 mg/kg, Colwell potassium (K) – 93 mg/kg, mono-calcium phosphate extracted sulphur (S) – 28·1 mg/kg, pH (H20) – 5·5 and electrical conductivity – 0·18 dS/m. Urea was applied at a rate of 46 kg N/ha, immediately following every defoliation of the 3-leaf stage treatment and every second defoliation of the 1·5-leaf stage treatment. Over the experimental year, therefore, 460 kg N/ha was applied to account for N being removed with each harvest. To maintain an adequate soil nutrient status following the removal of nutrients during harvests, all plots received 250 kg K/ha in the form of muriate of potash fertilizer and 52·5 kg P/ha in the form of single superphosphate fertilizer in October 2011.
Measurements
Plots were defoliated to a height of 45 mm using a rotary mower. The resultant total plot wet grass sample was weighed immediately and a sub-sample (c. 200 g fresh weight) taken and dried at 60 °C for 48 h for the determination of DM content and hence DM yield (kg DM/ha). Following determination of DM content, the samples from defoliation events when the 1·5-leaf and 3-leaf stages treatments coincided (i.e. every second 1·5-leaf stage defoliation and every 3-leaf stage defoliation) were then ground through a 1 mm screen in preparation for analyses of the herbage nutritive value.
When defoliation of the 1·5-leaf and 3-leaf stages treatments coincided, additional leaf samples were taken for WSC analyses. Care was taken to collect plants at a similar stage of phenological development (i.e. vegetative or reproductive), as the pattern of WSC accumulation and storage changes as tillers become reproductive (Sprague & Sullivan Reference Sprague and Sullivan1950). These samples were collected prior to defoliation and no later than 3 h after sunrise, to reduce the confounding effect of diurnal fluctuations in WSC concentration (Fulkerson & Slack Reference Fulkerson and Slack1994). The sample was stored on ice to minimize the loss of WSC through respiration, and samples were then frozen at −18 °C prior to freeze-drying. Following freeze-drying, samples were ground through a 1 mm screen in preparation for analysis of WSC concentration.
All analyses were conducted by DairyOne Forage Laboratory Services (Ithaca, New York). Analyses and calculations of nutritive value were as follows:
Acid-detergent fibre (ADF) and neutral-detergent fibre (NDF): Concentrations were determined using the methods outlined in AOAC (Reference Helrich1990) and Van Soest et al. (Reference Van Soest, Robertson and Lewis1991).
CP: N concentration was determined via Kjeldahl digestion followed by titration (Thiex et al. Reference Thiex, Manson, Andersson and Persson2002), and was multiplied by 6·25 for CP concentration.
ME: Estimated from measured values using the National Research Council energy model for cattle (National Research Council 2001).
WSC: Analysed using a method that involves extraction of solubilized carbohydrates with water and determination of WSC using a Thermo Scientific Genesys 10S Vis Spectrophotometer after acid hydrolysis with sulphuric acid and colorimetric reaction with potassium ferricyanide (Hall et al. Reference Hall, Hoover, Jennings and Miller Webster1999).
Statistical analyses
Changes in DM yield, nutritive value, WSC concentration and WSC : CP ratio over time were analysed by repeated measures analysis of variance (ANOVA). These analyses allowed for comparison of cultivar and defoliation interval means. All analyses were performed using the statistical procedures of Genstat (Version 9.1, Lawes Agricultural Trust, distributed by VSN). Fisher's protected least significant difference (LSD) was used for the statistical separation of means.
RESULTS
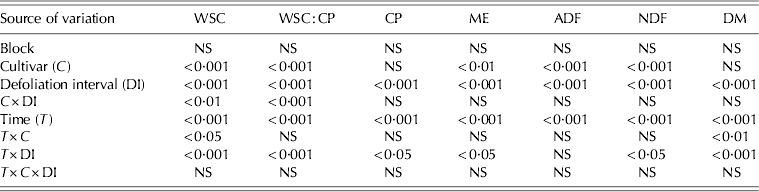
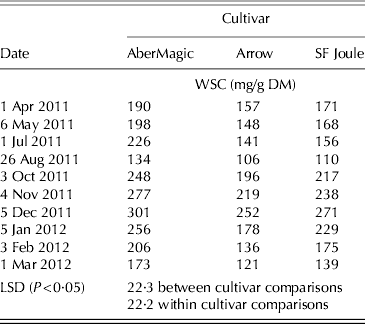
The mean WSC concentration of AberMagic was consistently higher than that of Arrow throughout the 12-month period, whereas the WSC concentration of SF Joule was similar to Arrow, with the exception of January and February 2012, when it was intermediate between the two cultivars (Tables 1 and 2).
ANOVA summary of the leaf tissue of three cultivars, defoliated 10 times over a 12-month period, at two defoliation intervals
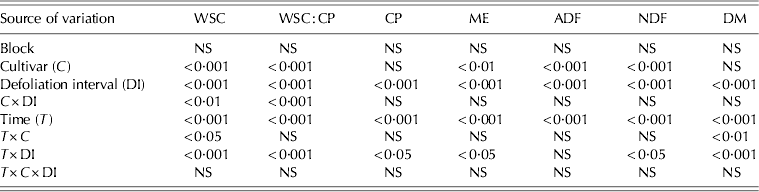
WSC, water-soluble carbohydrates; CP, crude protein; ME, metabolizable energy; ADF, acid detergent fibre; NDF, neutral detergent fibre; DM, dry matter yield.
NS: not significant at P<0·05.
Mean WSC concentration (mg/g DM) for each cultivar, at each defoliation date
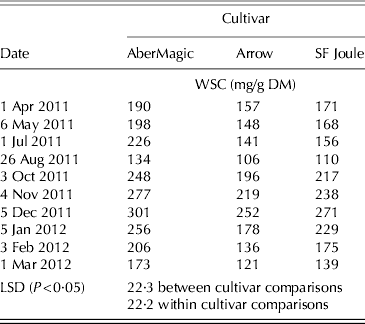
DM, dry matter.
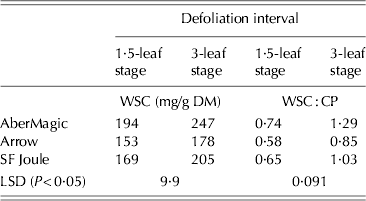
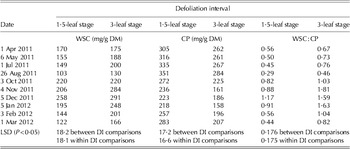
For all cultivars, higher herbage WSC concentrations were measured at the 3-leaf stage of re-growth rather than at the 1·5-leaf stage (Tables 1 and 3). The increase in WSC concentration by increasing the defoliation interval for AberMagic was more than twice that for Arrow (53 v. 25 mg/g DM, respectively), resulting in a difference of 69 mg/g DM WSC between the two cultivars under the 3-leaf defoliation interval. The effect of defoliation interval on mean WSC concentration varied over time (Tables 1 and 4), with defoliation at the 1·5-leaf stage resulting in WSC concentrations equal to or less than 155 mg/g DM at five of the defoliation dates, compared with once under defoliation at the 3-leaf stage of re-growth.
Mean WSC concentration and WSC to CP ratio (WSC : CP) for each cultivar under 1·5-leaf and 3-leaf stage defoliation intervals
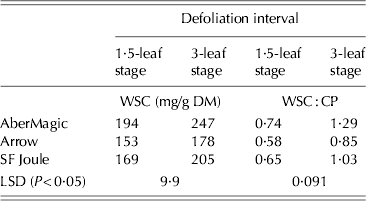
DM, dry matter.
Mean WSC concentration (mg/g DM), CP concentration (mg/g DM) and WSC to CP ratio (WSC:CP) for the 1·5-leaf and 3-leaf stages defoliation intervals, at each defoliation interval

DM, dry matter.
Maintenance of a desirable ratio (>0·7) of WSC : CP was achieved under the 3-leaf stage defoliation interval for all cultivars, whereas under the 1·5-leaf stage defoliation interval a mean WSC : CP above 0·7 was only measured for AberMagic (Tables 1 and 3). The effect of defoliation interval on mean WSC : CP varied over time (Tables 1 and 4), with defoliation at the 1·5-leaf stage of re-growth between April and August 2011, and in February and March 2012, leading to a lower mean pasture WSC : CP. Under the 3-leaf stage defoliation interval a mean WSC : CP ratio above 0·7 was maintained with greater consistency.
There was a seasonal influence on the effect of defoliation interval on pasture CP concentration (Tables 1 and 4), with the difference between defoliation interval treatments ranging from 37 mg/g DM (December 2011) to 76 mg/g DM (March 2012). However, pasture defoliated at the 1·5-leaf stage of re-growth maintained a higher CP concentration compared with the pasture defoliated at the 3-leaf stage across every defoliation event, with a mean of 280 v. 221 mg/g DM, respectively. The highest CP concentrations of 351 and 284 mg/g DM (1·5-leaf and 3-leaf stages, respectively) were measured in August 2011 (late winter) and the lowest CP concentrations of 218 and 158 mg/g DM were measured during January 2012 (mid-summer). Crude protein concentration did not vary between cultivars (Table 1).
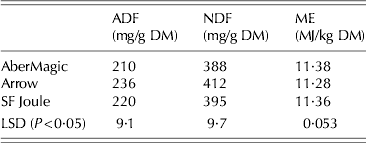
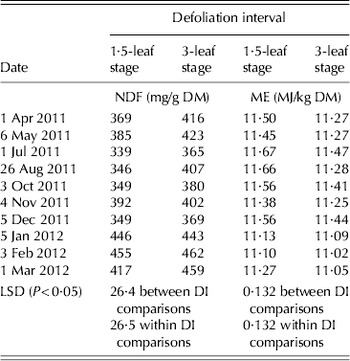
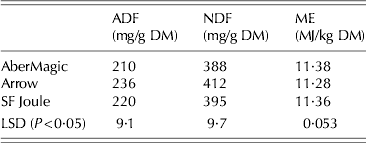
Estimated ME content and fibre concentrations varied between cultivars (Tables 1 and 5). Arrow contained higher fibre levels, and a lower estimated ME content than the high sugar perennial ryegrass cultivars. The effect of defoliation interval on NDF concentration and ME content varied with time (Tables 1 and 6), with no difference in NDF concentration and ME content between defoliation interval treatments from November 2011 to February 2012. At the remaining defoliation events, NDF concentrations were lower and estimated ME content was higher when pasture was defoliated at the 1·5-leaf stage compared with the 3-leaf stage of re-growth. The ADF concentration was consistently lower at the 1·5-leaf stage compared with the 3-leaf stage of re-growth throughout the study period, at a mean 213 v. 231 mg/g DM, respectively (Table 1).
Mean ADF and NDF concentrations (mg/g DM) and estimated ME content (MJ/kg DM) for AberMagic, Arrow and SF Joule
DM, dry matter.
Mean NDF concentrations (mg/g DM) and estimated ME content (MJ/kg DM) for the 1·5-leaf and 3-leaf stages defoliation intervals (DI), at each defoliation date

DM, dry matter.
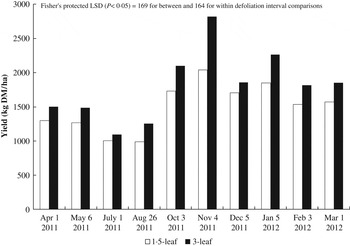
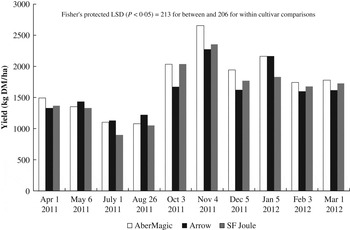
Over the 12-month period, each cultivar produced on average 20% more (P<0·001) DM when defoliated at the 3-leaf stage compared with the 1·5-leaf stage (mean of 18·0 v. 15·0 t DM/ha; Table 1). The difference in DM yield as a result of defoliation interval varied over time (Table 1; Fig. 2), with the greatest increase in DM with increasing defoliation interval occurring in November 2011 (spring). The difference in DM yield between cultivars was also influenced by time (Table 1; Fig. 3). AberMagic produced at least 300 kg DM/ha more than Arrow at the defoliation events in October, November and 5 December 2011, and SF Joule in November 2011 and January 2012. In October 2011, the DM yield of SF Joule was also greater than that of Arrow, whereas in January 2012 the DM yield of Arrow was greater than that of SF Joule. Over the 12-month period of measurements, AberMagic yielded 17·0 t DM/ha, compared with (P=0·51) 16·3 and 16·2 t DM/ha for SF Joule and the control cultivar Arrow, respectively.
Mean DM yield (kg DM/ha) for the 1·5-leaf and 3-leaf stages defoliation intervals at each defoliation date (averaged across cultivars).

Mean DM yield (kg DM/ha) for AberMagic, Arrow and SF Joule at each defoliation date (averaged across defoliation intervals).

DISCUSSION
The cool temperate conditions of Tasmania were conducive for the expression of the high sugar trait, with consistently higher WSC concentrations for AberMagic throughout the 12 months of measurements compared with the control cultivar Arrow. Conditions in North West Tasmania where the current study took place were represented by average daily maximum temperatures that ranged annually between 10·5 and 21·5 °C, and average daily minimum temperatures that ranged between 4·3 and 11·7 °C (Jeffrey et al. Reference Jeffrey, Carter, Moodie and Beswick2001). The resulting expression of the high sugar trait in AberMagic and to a lesser extent SF Joule under these conditions is supported by the genotype×environment interaction theory proposed by Edwards et al. (Reference Edwards, Parsons, Rasmussen, Chapman, Clark, Macmillan and Nation2007a). This theory was founded on the work of Parsons et al. (Reference Parsons, Rasmussen, Xue, Newman, Anderson and Cosgrove2004), who measured significantly higher WSC concentrations in high sugar cultivars AberDart and AberDove, compared with control cultivar Fennema, when they were grown at day/night temperatures of 20 °C/10 °C. These differences were amplified when these day/night conditions followed 10 weeks at 5 °C. It has therefore been suggested that the inconsistent expression of the high sugar trait in Australia and New Zealand, compared with the more consistent expression in Europe (Halling et al. Reference Halling, Longland, Martens, Nesheim, O'Kiely, Luscher, Jeangros, Kessler, Huguenin, Lobsiger, Millar and Suter2004; Tas et al. Reference Tas, Taweel, Smit, Elgersma, Dijkstra and Tamminga2006; Taweel et al. Reference Taweel, Tas, Smit, Elgersma, Dijkstra and Tamminga2006), could be due to a genotype×environment interaction (Edwards et al. Reference Edwards, Parsons, Rasmussen, Chapman, Clark, Macmillan and Nation2007a), with lower temperatures (<10 °C) required for expression of the trait (Parsons et al. Reference Parsons, Rasmussen, Xue, Newman, Anderson and Cosgrove2004). While the high sugar trait failed to be expressed in the warmer conditions of Northern Victoria, Australia (Francis et al. Reference Francis, Chapman, Doyle and Leury2006), the current study confirmed that the lower temperatures in Tasmania led to consistent expression across seasons in the cultivar AberMagic. In New Zealand, the work of Hume et al. (Reference Hume, Hickey, Lyons and Baird2010) also showed that cool temperate conditions of Gore resulted in higher WSC expressions from high sugar cultivars than the warm temperate conditions of Palmerston North.
AberMagic maintained a higher mean herbage WSC concentration than the other cultivars throughout the study, peaking at 301 mg/g DM at the December defoliation event. The seasonal changes in WSC concentration involved an increase from early spring to peak during reproductive development in summer (which was not formally monitored but occurred to a limited extent in the current study), then declining towards the end of the growing season. A similar pattern of seasonal change in WSC concentrations was also reported in previous studies (Radojevic et al. Reference Radojevic, Simpson, St John and Humphreys1994; Smith et al. Reference Smith, Simpson, Oram, Lowe, Kelly, Evans and Humphreys1998; Miller et al. Reference Miller, Moorby, Davies, Humphreys, Scollan, MacRae and Theodorou2001). The higher expression in AberMagic compared with other high sugar cultivars and control cultivars, was reported by Stewart et al. (Reference Stewart, Easton, Lyons, Parris, Charrier and Berding2009) in Canterbury and Manawatu, New Zealand. However, it was only at the latter site that the difference in WSC concentration was of a similar magnitude to the current study (about 70 mg/g DM). Comparisons of actual WSC values with other studies are somewhat impractical however, due to variation between sites in time and stage of plant re-growth at sampling, both proven to influence WSC concentration (Sprague & Sullivan Reference Sprague and Sullivan1950; Fulkerson & Slack Reference Fulkerson and Slack1994). While defoliation interval was quantified by plant height by Stewart et al. (Reference Stewart, Easton, Lyons, Parris, Charrier and Berding2009) and by number of days by Tas et al. (Reference Tas, Taweel, Smit, Elgersma, Dijkstra and Tamminga2006) and Taweel et al. (Reference Taweel, Tas, Smit, Elgersma, Dijkstra and Tamminga2006), in the current study it was quantified by the leaf re-growth stage. While AberMagic expressed the high sugar trait to a greater extent though maintenance of a higher WSC concentration than SF Joule, the influence of defoliation interval on expression for both cultivars was also considered.
Each cultivar was subjected to two contrasting defoliation interval treatments to allow an assessment of the influence of grazing management on the expression of the high sugar trait. For all cultivars, higher WSC concentrations were measured at the 3-leaf stage, reflecting the increase in WSC concentration that occurs with advancing plant re-growth, both in leaves and in reserve-form with in plant stubble (Fulkerson & Donaghy Reference Fulkerson and Donaghy2001; Turner et al. Reference Turner, Donaghy, Lane and Rawnsley2006b; Rasmussen et al. Reference Rasmussen, Parsons, Xue and Newman2009). The difference in WSC concentration between the high sugar cultivars AberMagic and SF Joule and the control cultivar Arrow was also greater under the 3-leaf compared with the 1·5-leaf defoliation interval, with the greatest difference (69 mg/g DM) measured between AberMagic and Arrow when defoliated at the 3-leaf stage of re-growth. Defoliation at the 3-leaf stage of re-growth was therefore found to support a greater expression of the high sugar trait as measured by WSC concentrations, for both AberMagic and SF Joule. Defoliation interval was also found to influence expression of the high sugar trait, as measured by herbage WSC : CP ratio. Maintenance of a desirable ratio (>0·7; Edwards et al. Reference Edwards, Parsons, Rasmussen, Chapman, Clark, Macmillan and Nation2007a) of WSC : CP for all cultivars was ensured by defoliation at the 3-leaf stage of re-growth, whereas it was achieved only by AberMagic under defoliation at the 1·5-leaf stage of re-growth. While AberMagic displayed the highest WSC : CP ratio regardless of defoliation interval, defoliation at the 3-leaf stage of re-growth ensured that both AberMagic and SF Joule maintained a greater mean WSC : CP ratio than the control cultivar Arrow. The higher leaf WSC concentrations and WSC : CP ratios in the current study confirm the 3-leaf stage as the preferred defoliation interval for high sugar perennial ryegrass cultivars from the perspective of a grazing ruminant. The mean WSC : CP ratio for AberMagic when defoliated at the 3-leaf stage was 1·29; approaching the higher benchmark of 1·5 discussed by Parsons et al. (Reference Parsons, Edwards, Newton, Chapman, Caradus, Rasmussen and Rowarth2011).
Grazing at the 3-leaf stage of re-growth (or close to it) is widely recognized as the best management practice for perennial ryegrass in temperate pasture-based dairying regions of Australia (Fulkerson & Donaghy Reference Fulkerson and Donaghy2001), and maintenance of higher DM yields and suitable herbage nutritive value in the current study provide further support for this best practice recommendation. Despite decreasing with plant maturity, the CP concentration was maintained at an optimal level at the 3-leaf stage (mean 221 mg/g DM). In fact, the highest mean CP concentration (average of three cultivars) of 351 mg/g DM under the 1·5-leaf defoliation interval in August 2011 (winter) is considered to be far in excess of dairy cow requirements (National Research Council 2001). The maximum NDF measured in the current study was 413 mg/g DM for plants at the 3-leaf stage of re-growth, which is relatively low compared with concentrations over 500 mg/g DM reported in previous Australian and European studies (Smith et al. Reference Smith, Simpson, Oram, Lowe, Kelly, Evans and Humphreys1998; Miller et al. Reference Miller, Moorby, Davies, Humphreys, Scollan, MacRae and Theodorou2001; Moorby et al. Reference Moorby, Evans, Scollan, MacRae and Theodorou2006). Defoliation of plants at either the 1·5-leaf or 3-leaf re-growth stages in the current study maintained all perennial ryegrass cultivars in a largely vegetative state, and subsequently fibre levels did not peak as high as in studies where full reproductive development proceeded. Similarly, while ME content was lower during the summer months, it remained at or above 11·0 MJ/kg DM throughout the study, regardless of defoliation interval. While there were some significant differences in fibre concentrations and ME content between defoliation interval treatments, they were not consistent over time nor considered to be of a magnitude that is biologically meaningful. All herbage measurements taken in the current study therefore support the 3-leaf stage of re-growth as the preferred defoliation interval in temperate pasture-based dairy systems.
The high sugar cultivars displayed the same or superior herbage nutritive value and DM yields compared with the control cultivar Arrow. Crude protein concentration did not vary between the high sugar and control cultivars in the current study, as it occurred in a study by Smith et al. (Reference Smith, Simpson, Oram, Lowe, Kelly, Evans and Humphreys1998). The similar results of these two studies support the conclusion of Radojevic et al. (1994) that selection for high WSC concentration has not been at the expense of CP concentration. The negative relationship between WSC and CP reported previously (Dent & Aldrich Reference Dent and Aldrich1963; Thompson & Rogers Reference Thompson and Rogers1971; Stewart et al. Reference Stewart, Easton, Lyons, Parris, Charrier and Berding2009) was suggested by Radojevic et al. (1994) to be more likely a result of environmental, rather than genetic factors. While CP concentration did not vary between cultivars, lower fibre concentrations were measured in both the high sugar cultivars compared to the control. The difference in NDF concentration in the current study between high sugar cultivar AberMagic and the control Arrow was 24 mg/g DM, consistent with differences between cultivars reported in other Australian studies (30–50 mg/g DM; Smith et al. Reference Smith, Simpson, Oram, Lowe, Kelly, Evans and Humphreys1998). AberMagic and SF Joule both maintained DM yields as high as Arrow in the current study, with AberMagic yielding 17·0 t DM/ha, compared with 16·3 and 16·2 t DM/ha for SF Joule and the control cultivar Arrow, respectively. With a couple of exceptions in Australia (Smith et al. Reference Smith, Simpson, Oram, Lowe, Kelly, Evans and Humphreys1998) and Northern Europe (Halling et al. Reference Halling, Longland, Martens, Nesheim, O'Kiely, Luscher, Jeangros, Kessler, Huguenin, Lobsiger, Millar and Suter2004), there is solid evidence for maintenance of the same or higher DM yields from high sugar perennial ryegrass cultivars compared with control cultivars not selected for high sugar traits (Edwards et al. Reference Edwards, Parsons, Rasmussen and Bryant2007b). Smith et al. (Reference Smith, Simpson, Oram, Lowe, Kelly, Evans and Humphreys1998) concluded that the low DM yields over three sites on mainland Australia were due to the poor adaptation of the Northern European cultivars in Australian conditions. The high DM yields and herbage nutritive value measured for AberMagic in the current study, alongside consistent expression of the high sugar trait, suggest that this cultivar developed in Aberystwyth was well suited to the cool temperate conditions of North West Tasmania.
While the literature reports significant variation in the degree to which the high sugar trait is expressed in Australian and New Zealand dairy environments, the current study shows that two European high sugar cultivars consistently expressed the high sugar trait in North West Tasmanian conditions. The current study highlighted the importance of grazing management in providing an optimal balance between nutritive value and DM yields for all perennial ryegrass cultivars – adding the maintenance of a desirable WSC : CP ratio as a further reason to defoliate at the 3-leaf stage of re-growth. While expression of the high sugar trait occurred in both high sugar cultivars, a significantly higher WSC concentration and WSC : CP ratio, and increased DM yield and nutritive value for AberMagic support the premise of further research in Tasmania to quantify the influence of this high sugar cultivar on N partitioning and associated components of milk production.
The authors would like to acknowledge Dairy Australia for funding this study, and thank Peter Chamberlain for his excellent technical assistance.