Introduction
The pollution problem has caused great concern around the world [Reference Li, Yu, Jaroniec and Chen1], especially water pollution [Reference Qiao, Chen, Tian, Wang, Yang, Shi, Zhang, Peng, Luo and Ding2, Reference Xue and Kannan3]. As previously reported, physical and chemical methods are effective sewage treatment methods. At present, physical adsorption [Reference Kameda, Ito and Yoshioka4, Reference GilPavas, Dobrosz-Gomez and Gomez-Garcia5] and photocatalytic degradation [Reference Konstantinou and Albanis6, Reference Turchi and Ollis7, Reference Xie, Huang, Zhang, Zhang, Wen, Liu, Fang and Wu8, Reference Han, Liu, Singhal, Wang and Gao9, Reference Yan, Yuan, Wang, Wang, Zhou, Wang, Tang, Pan and Cheng10, Reference Ding, Wang, Zhang, Zhang and Yu11] are environmentally friendly and convenient methods. However, physical adsorption method has the problems that contaminants are not broken down into clean products and easily desorb [Reference Mohan and Pittman12]. Thus, there is still a possibility of recontamination due to leakage. Photocatalysis can decompose pollutants into clean products [Reference Wu, Hu, Wang, Zhou, Han, Jin and Chen13, Reference Wada, Yokomizo, Yogi, Katayama, Tanaka, Kojima, Inada and Ozutsumi14, Reference Challagulla and Roy15, Reference Zammouri, Aboulaich, Capoen, Bouazaoui, Sarakha, Stitou and Mahiou16, Reference Liu, Wang, Ma and Zhang17], but its efficiency is poor [Reference Gao, Peng, Tang, Guo and Luo18]. In previous studies, the construction of heterojunction semiconductors has proven to be one of the most effective methods to enhance photocatalytic performance [Reference Chai, Kim, Jung, Chakraborty, Jung and Lee19, Reference Han, Sun, Chuah and Jaenicke20, Reference Lu, Hao, Chen, Zhang, Chen, Ma, Yao and Zhu21, Reference Qin, Chen, Feng, Chen, Li and Gao22, Reference Xie, Luo, Huang, Huang, Liu, Fang, Wu and Min23, Reference Low, Yu, Jaroniec, Wageh and Al-Ghamdi24, Reference Wang, Liu, Fu, Wang, Yu and Wang25]. Currently, bismuth (Bi)-based semiconductor photocatalytic materials [Reference Sun, Liao, Dong, Wu and Sun26, Reference Zhong, Qiu, Zhang, Li, Zhang and Chen27, Reference Li, Zhu, Wang, Min, Fang, Huang, Liu and Wu28, Reference Feng, Zeng, Chen, Ma, Zhao, Jin, Lu, Wu and He29, Reference He, Xu, Cheng, Yu and Ho30], such as Bi2O3 [Reference Jung, Park, Kim, Kim, Choi and Lee31, Reference Zhou, Wang, Xu, Sun and Shang32], BiOX [Reference Li, Yu and Zhang33, Reference Wang, Shi, Yang, Chang, Zhang, Liu, Lu, Ao and Chu34, Reference Zhang, Ai, Jia and Zhang35, Reference Liu, Zhao, He, Zhong, Ding and Chen36, Reference Liang, Guo, Cao, Tian and Lui37, Reference Zhang, Wang, Xiao, Liu, Xu and Du38], and BiVO4 [Reference Chen, Yang, Yao, Ma, Wang, Li, Wang, Wang and Yu39, Reference Wang, Jiang, Ding, Noh, Moon, Choi, Shi and Jeong40], exhibit excellent performance in photocatalysis and are highly valued in the environmental field. Heterojunction photocatalysts have better photocatalytic performance than single-phase photocatalysts [Reference Han, Li, Yang and Lin41, Reference Li, Xie, Jiang, Yu and Zhang42, Reference Wang, Ren, Zhang, Hao, Gong, Xiao, Jiang and Tong43]. For example, You et al. reported the effective application of the Bi2O3–TiO2 composite under visible light irradiation to remove refractory organic dibutyl phthalate and heavy metal Pb(II) from wastewater [Reference You, Hu, Liu and Wei44]. The photoinduced electrons and holes separately transfer to different locations on the composite, thereby greatly improving the photocatalytic efficiency of both reactions. Lu et al. successfully prepared a Bi2O3/Bi2SiO5 p–n heterojunction photocatalyst with enhanced photocatalytic activity due to its larger specific surface area and larger contact angle [Reference Lu, Hao, Chen, Zhang, Chen, Ma, Yao and Zhu21]. Accordingly, we undertook the search for a photocatalyst with a large specific surface area. Miao et al. reported that bismuth(III) oxybromide (BiOBr) has a nanosheet structure, high activity, excellent stability, and superior mineralization ability in the photocatalytic degradation [Reference Miao, Lian, Huo and Li45], and its band gap as a photocatalysts was 2.56–2.66 eV. Shan et al. prepared an α-Bi2O3/BiOBr core–shell heterojunction and found that the photocatalytic activity of α-Bi2O3 was clearly enhanced when assembled with ultrathin BiOBr compared with α-Bi2O3/BiOBr and the individual phase [Reference Shan, Liu, Chen, Wu and Han46]. They considered that the oxygen vacancy effect and suitable band alignment were the reason for the enhancement of the photocatalytic performance. Degradation tests were conducted in each study. The catalysts samples (0.1 g) were added into 100 mL of a 20 mg/L solution of RhB, and the degradation rate reached about 85% after 210 min. It is well established that the band gap of β-Bi2O3 is about 2.3 eV and the light absorption property of β-Bi2O3 is much stronger than that of α-Bi2O3 [Reference Lu, Hao, Chen, Zhang, Chen, Ma, Yao and Zhu21]. As a result, β-Bi2O3 exhibits better photocatalytic performance than α-Bi2O3. In this study, the prepared β-Bi2O3/BiOBr heterojunction photocatalyst was expected to achieve better photocatalytic performance than α-Bi2O3/BiOBr. Physical adsorption has the advantage of having a quick effect, and it is useful to use physical adsorption in the field of photocatalytic degradation.
To further improve the catalytic efficiency of the photocatalyst, here we propose an innovative approach utilizing a pore structure to adsorb contaminants in the β-Bi2O3/BiOBr heterojunction photocatalysts, which can be used for photocatalytic degradation under visible light. A pore structure can increase the specific surface area and enhance the adsorption performance. At the same time, it is possible to construct a heterojunction photocatalyst using β-Bi2O3 and BiOBr suitable structures. The separation ability of photogenerated electron–hole pairs can be increased by heterojunction [Reference Cipagauta-Díaz, Estrella-González and Gómez47, Reference Guo, Dai, Zhao, Li, Xu and Sun48]. Thus, the photocatalytic efficiency will be greatly improved by this method.
In this study, the β-Bi2O3/BiOBr heterojunction photocatalyst was prepared by an in situ chemical transformation method [Reference Yan, Xu, Chai, Wang, Wang and Ren49, Reference Tang, Wang, Wu, Liu and Liu50]. The in situ chemical transformation method produced a pore structure, which improved the adsorption performance and increased the specific surface area of the samples. The photocatalytic efficiency of β-Bi2O3/BiOBr was higher than that β-Bi2O3 and BiOBr. The enhancement of the photocatalytic efficiency of β-Bi2O3/BiOBr was largely attributed to the pore structure, large specific surface area, and heterostructure.
Results and discussion
Phase structure and morphology
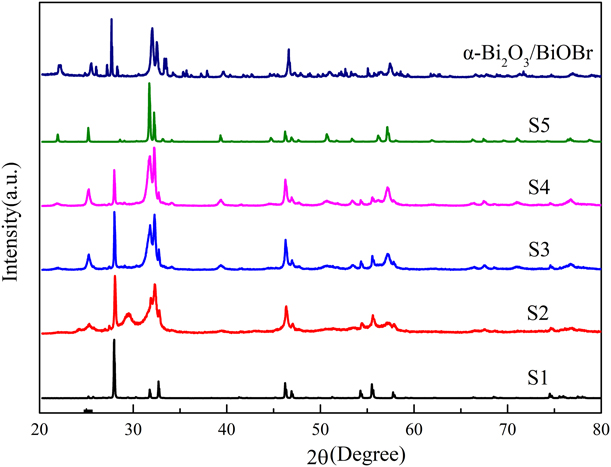
X-ray diffraction (XRD) analysis was used to identify the phase structure and composition of the prepared samples. As shown in Fig. 1, the XRD pattern of S1 could be attributed to the tetragonal phase Bi2O3 (JCPDS, No. 65-1209). The XRD pattern of S5 was found to belong to the tetragonal phase BiOBr (JCPDS, No. 78-348). For the XRD patterns of the samples that contained a different ratio of BiOBr, these diffraction peaks were compared by the characteristic diffraction peak (BiOBr) of 25.27°. In addition, as the HBr addition increased, there was no detectable change in the BiOBr phase structure in the samples and no other phases in the samples except for β-Bi2O3 and BiOBr.
XRD patterns of α-Bi2O3–BiOBr and different samples.

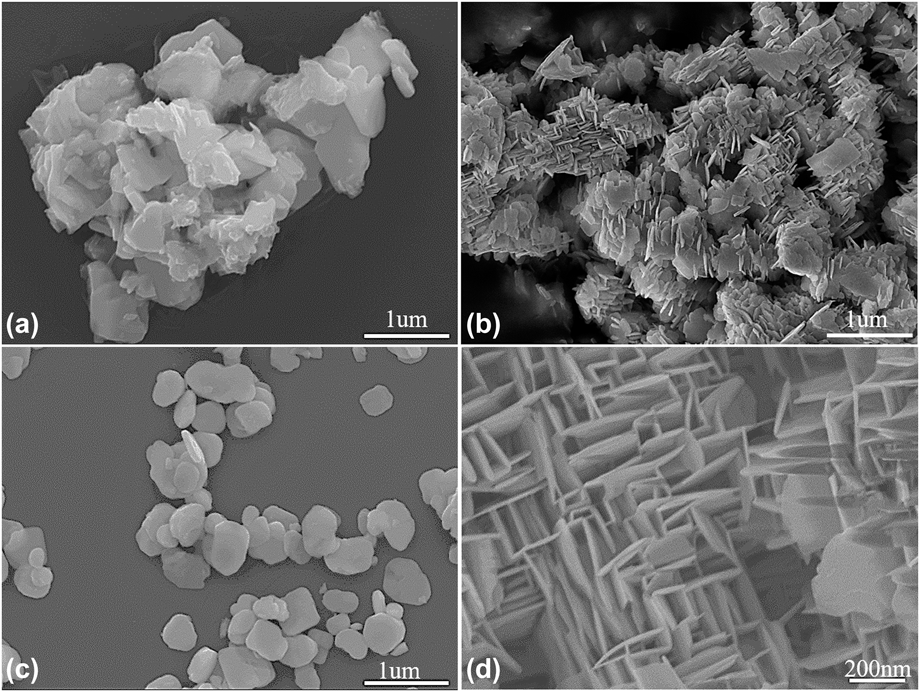
To investigate the microstructure of β-Bi2O3, β-Bi2O3/BiOBr, and BiOBr, scanning electronic microscopy (SEM) analysis was performed. The SEM image in Fig. 2(a) reveals that β-Bi2O3 consists of particles of about 1 µm. BiOBr is characteristic of nanoplatelets with a scale of about 300 nm [Fig. 2(c)]. The SEM images in Figs. 2(b) and 2(d) reveal that the BiOBr nanosheets, formed by in situ transformation, cross-link each other to form a frame structure. This structure can increase its specific surface area; large specific surface area is beneficial for increasing interface contact. To further prove the existence of β-Bi2O3 and analyze the interface between β-Bi2O3 and BiOBr, transmission electron microscopy (TEM) and high-resolution TEM (HRTEM) were performed.
Scanning electron microscopy (SEM) images of (a) β-Bi2O3 (S1), (b and d) β-Bi2O3/BiOBr (S3), and (c) BiOBr (S5).

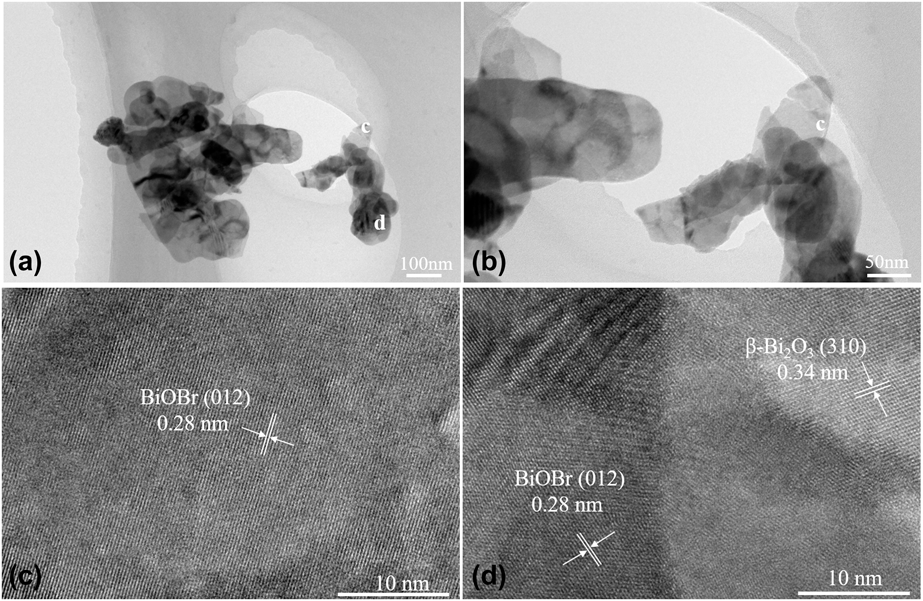
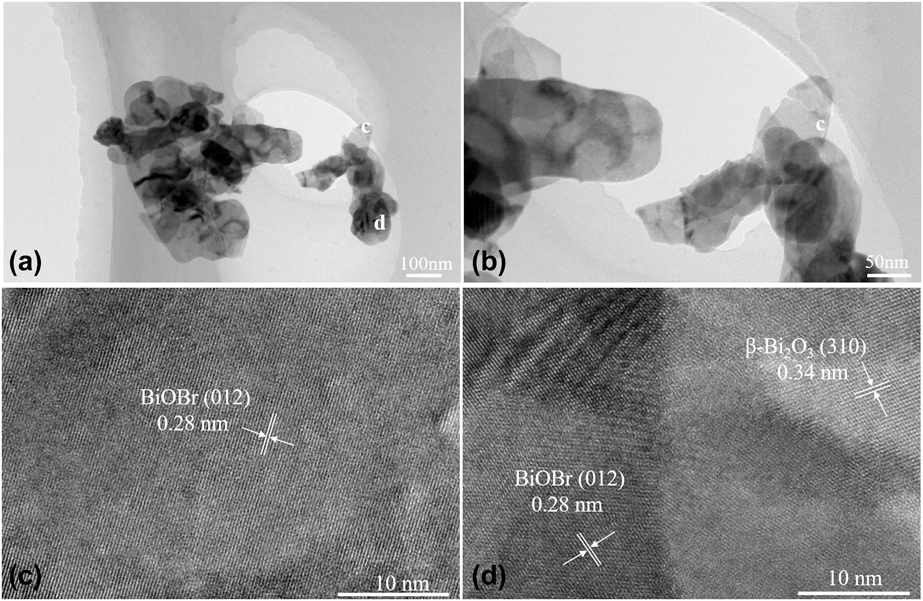
The TEM image in Fig. 3(a) shows that the sample was a combination of BiOBr and β-Bi2O3, with BiOBr as the major component. The TEM image in Fig. 3(b) indicates that BiOBr consists of nanoplatelet of about 200 nm. The spacing between the layered lattice diffraction fringes of 0.28 nm and the (012) plane of the BiOBr were well matched [Fig. 3(c)], which indicated that BiOBr was present in S3. The HRTEM image in Fig. 3(d) shows that the lattice diffraction fringes with a lattice spacing of 0.28 nm and 0.34 nm correspond well with the (012) plane of BiOBr and (310) plane of β-Bi2O3, respectively. They were well combined with each other with tight interfaces. Thus, these results suggest that β-Bi2O3 and BiOBr were present and well combined at the nanoscale level. This combination is beneficial to increase the lifetime of electron–hole pairs in the photocatalytic process.
(a and b) TEM and (c and d) HRTEM analysis of β-Bi2O3/BiOBr (S3).
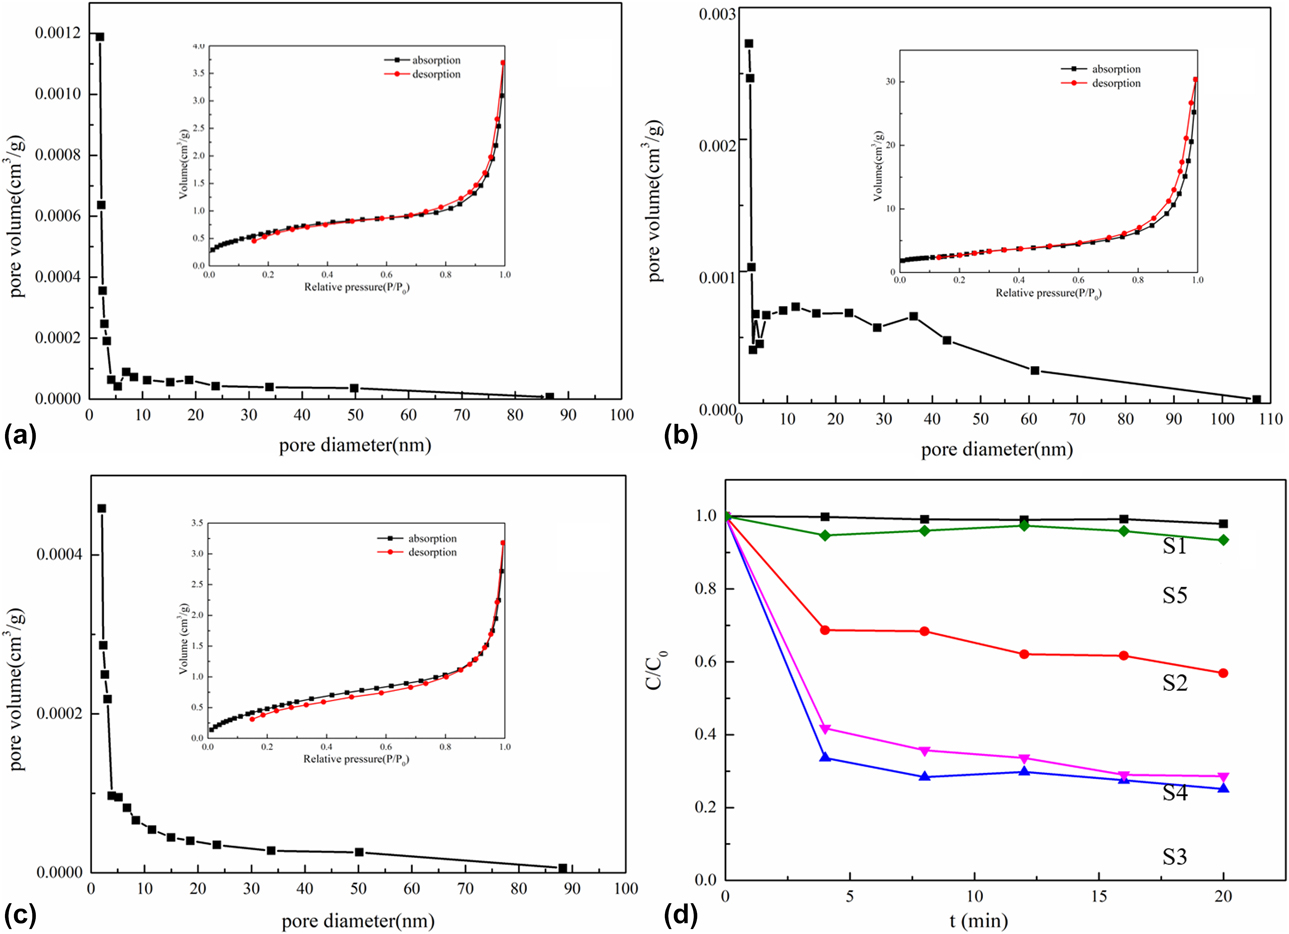
Brunauer–Emmett–Teller (BET) theory analysis was used to determine the specific surface area and porosity of the samples. The specific surface areas of S1, S3, and S5 were 2.29, 10.28, and 2.05 m2/g, respectively. The results also clearly showed that the specific surface area of β-Bi2O3/BiOBr was greatly improved compared with that of BiOBr and β-Bi2O3. The large specific surface area was beneficial to increase the contact area of the photocatalyst with target contaminants. This means that more active sites can participate in the reaction, which will greatly improve the photocatalytic efficiency.
The pore size distribution curve of the samples and the corresponding N2 adsorption–desorption isotherm are shown in Fig. 4. The β-Bi2O3/BiOBr isotherms in the inset [Fig. 4(b)] reveal a type IV isotherm with a typical hysteresis loop, indicating that the β-Bi2O3/BiOBr powders are mesoporous. The pore size distribution diagram of β-Bi2O3/BiOBr shown in Fig. 4(b) reveals that the pore size distribution was mainly concentrated in the range of 2–60 nm. The pore structure is clearly observed in the SEM image of the β-Bi2O3/BiOBr [Fig. 2(d)]. Since the pore volume content of the β-Bi2O3 was low, the relationship between the volume and relative pressure could not be detected, and this also was proved by SEM.
Pore size distribution and N2 adsorption–desorption isotherms (inset) of (a) β-Bi2O3 (S1), (b) β-Bi2O3/BiOBr (S3), (c) BiOBr (S5), and (d) dark reaction versus time curve of the different samples.
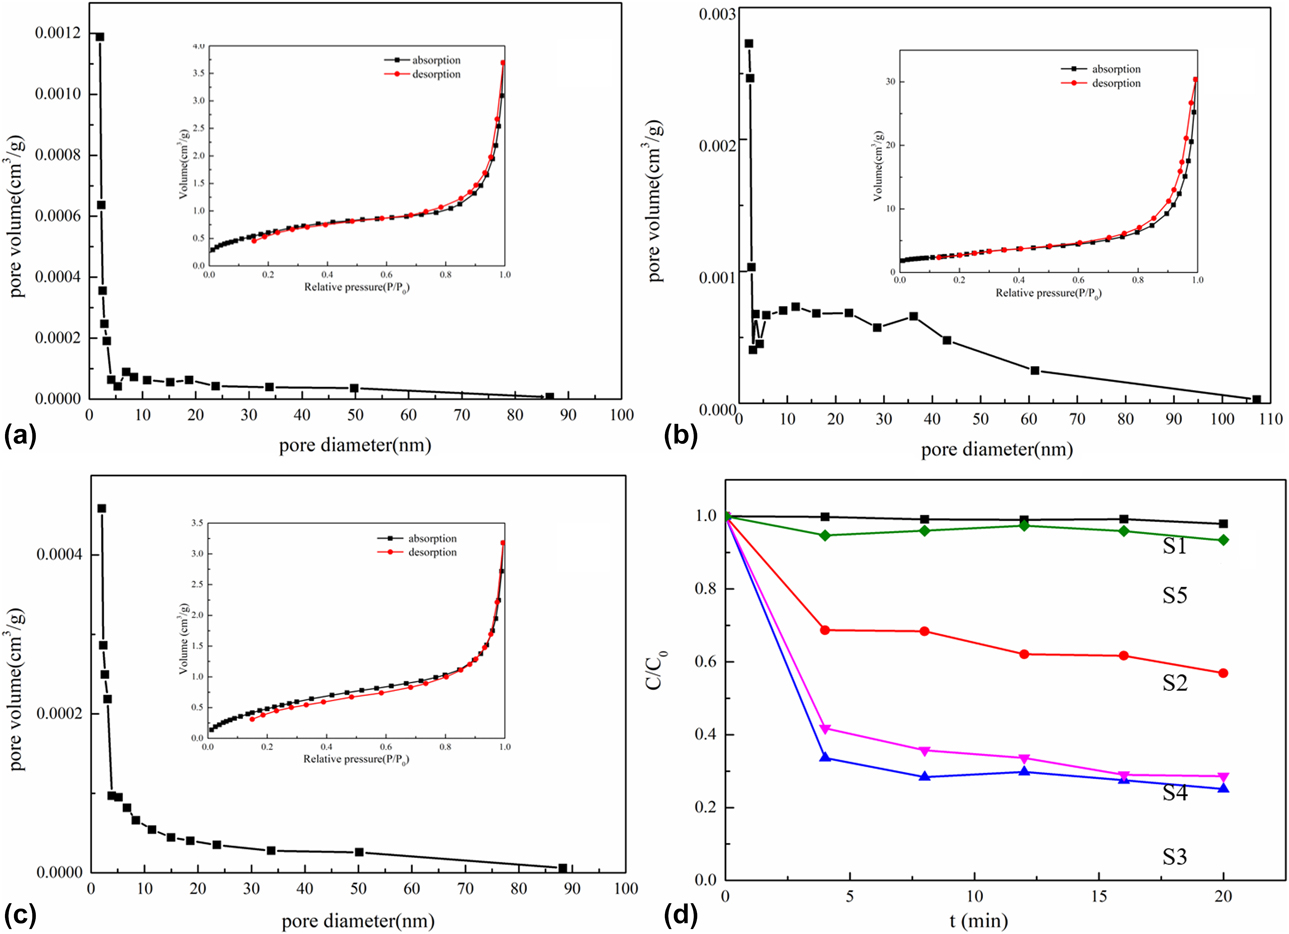
To evaluate the adsorption performance of the samples, we conducted an adsorption experiment with RhB as an indicator under dark conditions. The graphical representation of the results in Fig. 4(d) shows the change in RhB content in the supernatant during the reaction time in the dark. The horizontal axis is time and the vertical axis is the actual RhB concentration divided by the original RhB concentration. In samples S1 and S5, no changes could be observed in the RhB content, while in samples S2, S3, and S4, the RhB content decreased significantly. Specifically, the decrease was the highest in S3, and the RhB content remained almost unchanged after 15 min. The RhB adsorption efficiency of S3 reached 70% within 15 min. The combined findings of BET theory and SEM analysis show that this may be due to the physical adsorption of the pore structure. At the same time, the RhB content in the sewage decreases rapidly and can achieve the effect of rapid treatment of sewage. Under dark conditions, the content of pollutants in sewage rapidly decreases and can achieve rapid removal of pollutants.
Photocatalytic activity
To determine the photocatalytic performance of the prepared samples, RhB degradation analysis was performed. The photocatalytic activity of the RhB degradation was evaluated under visible light irradiation (λ > 420 nm). We used 5 mg/L of RhB as the target contaminant to detect the degradation performance of the photocatalyst. The sample was subjected to a reaction in the dark for 20 min before the photoreaction.
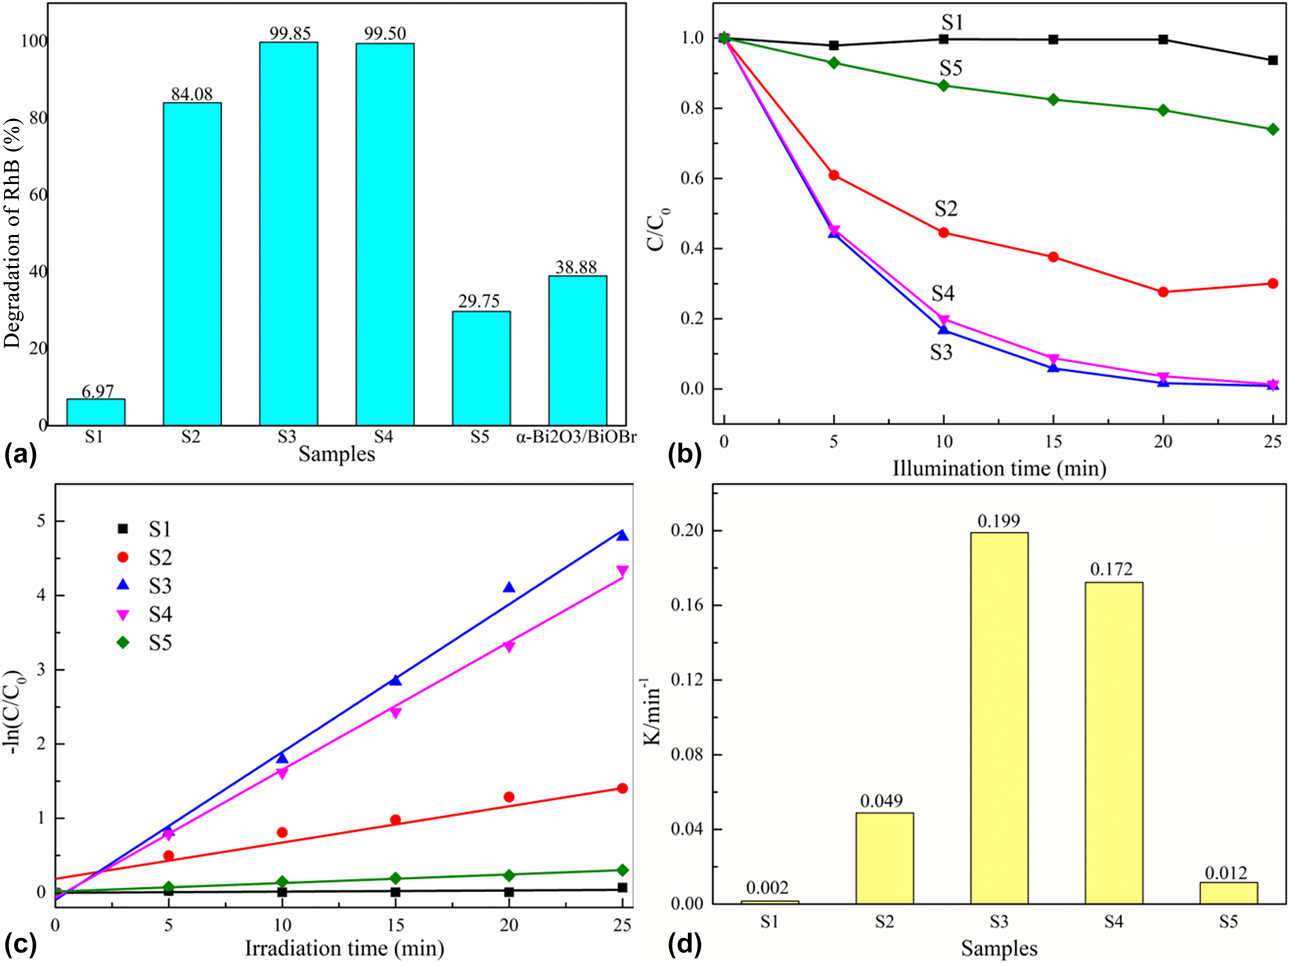
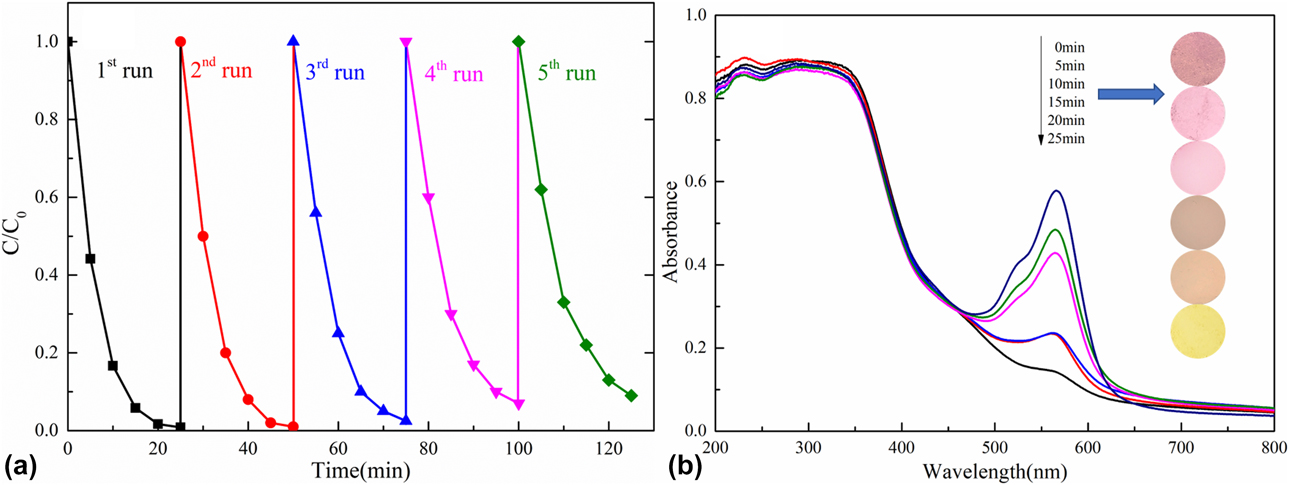
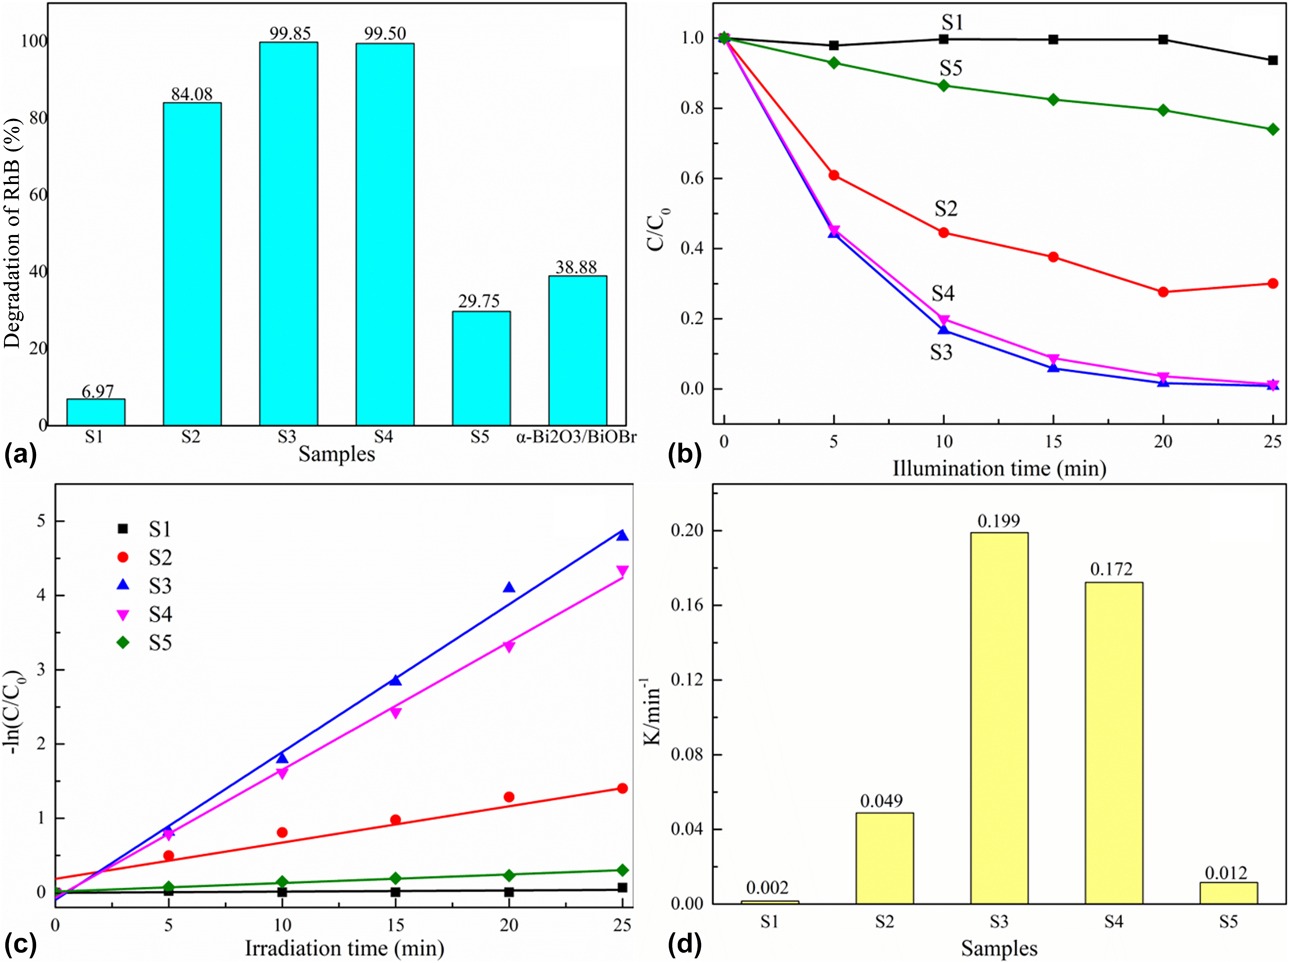
All samples for the degradation rate of RhB under light irradiation for 25 min are shown in Fig. 5(a). The degradation rate of β-Bi2O3 was only 6.97% and that of BiOBr was 29.75%. However, the degradation rate of S3 reached 99.85%. Thus, compared with β-Bi2O3 and BiOBr, the photocatalytic performance of S3 had been considerably improved. This result indicated that β-Bi2O3/BiOBr was not independently reacting in the sample. Compared with samples with the same molar ratio, α-Bi2O3/BiOBr, S3, showed higher degradation rate. A graphical representation of the degradation rate of RhB with time under photoreaction is shown in Fig. 5(b). Under visible light irradiation, the degradation rate was fast at 0–20 min. And after 20 min, the degradation rate decreased and there was almost no degradation, indicating that the degradation reaction of the sample occurred mainly in the first 20 min, after which there is almost no RhB in solution. The apparent rate constant k was obtained from fitting the first-order equation. The kinetic fits for the degradation of RhB using the as-prepared photocatalysts and the corresponding apparent rate constant k are shown in Figs. 5(c) and 5(d), respectively. The results showed that the catalytic activity of sample S3 is higher than that of other samples. After five cycles, S3 still has good photocatalytic activity [Fig. 6(a)]. In the work of by Liu et al., the k values of P25 and AgBr/TiO2 were 0.00154 and 0.00758, respectively [Reference Liu, Sun, Yue, Yan, He, Yu, Li, Wang, Zhu and Jing51]. Our sample k values were much higher than those reported by Liu et al. This shows that our samples have good photocatalytic activity. Different from α-Bi2O3/BiOBr, our pollutant removal rate was higher and required less time to achieve the same degradation rate [Reference Han, Sun, Chuah and Jaenicke20]. To determine whether RhB appears in the photocatalyst, it is necessary to obtain the ultraviolet–violet (UV-Vis) spectra.
(a) Different samples analyzed for the degradation effect after 25 min and (b) different samples analyzed for the degradation rate with time. (c) Kinetic fit for the degradation of RhB with the as-prepared photocatalysts. (d) Corresponding kinetic constant k for various samples.
(a) Cycling curves of S3. (b) UV-Vis absorption spectra and color changes for different illumination times with β-Bi2O3/BiOBr (S3) heterojunction photocatalyst.
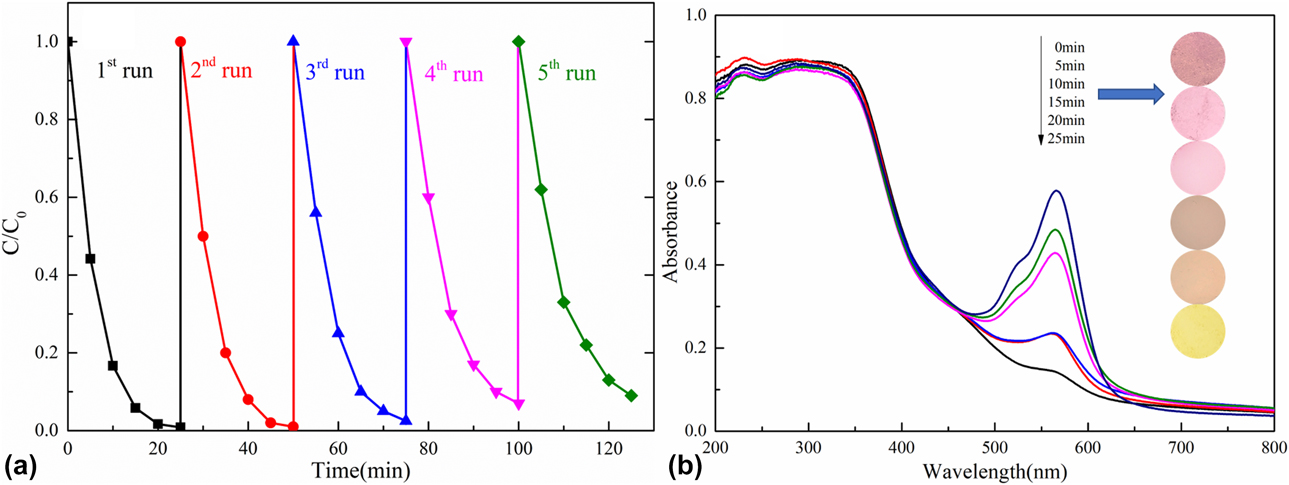
In the photodegradation process of S3, the degradation mechanism can be inferred by analyzing the spectral change in the UV-Vis spectrum of the degraded photocatalyst [Fig. 6(b)]. RhB is known to exhibit a strong absorption band at 554 nm. When only the dark reaction was carried out without photoreaction, RhB was adsorbed to the surface of the sample due to the physical adsorption of the pore structure and showed a strong absorption band at 554 nm. The UV-Vis spectra of the photocatalyst used for the samples irradiated for 5, 10, 15, 20, and 25 min are shown in Fig. 6(b). It reveals that as the visible illumination time increased, the absorption band at 554 nm became weaker, indicating that the content of RhB was decreasing. This was also indicated by the color change at the different illumination times of the β-Bi2O3/BiOBr heterojunction photocatalyst [Fig. 6(b)]. After 25 min, the sample was showed the original color. A comparison with the UV-Vis spectrum of only the reactions in the dark indicated that the RhB was degraded by the reaction process in the light. The reason why RhB was actually degraded is that under light irradiation it underwent a redox reaction on the pollutants adsorbed on the surface. The pore structure of S3 facilitated the adsorption of contaminant molecules onto the surface of the pores during the reaction process in the dark. In the photoreaction process, due to the greatly increased contact area between the contaminant molecules and the photocatalyst, the photocatalytic efficiency was improved. Accordingly, we utilize a pore structure to adsorb contaminants in the β-Bi2O3/BiOBr heterojunction photocatalysts, which can be used for photocatalytic degradation under visible light.
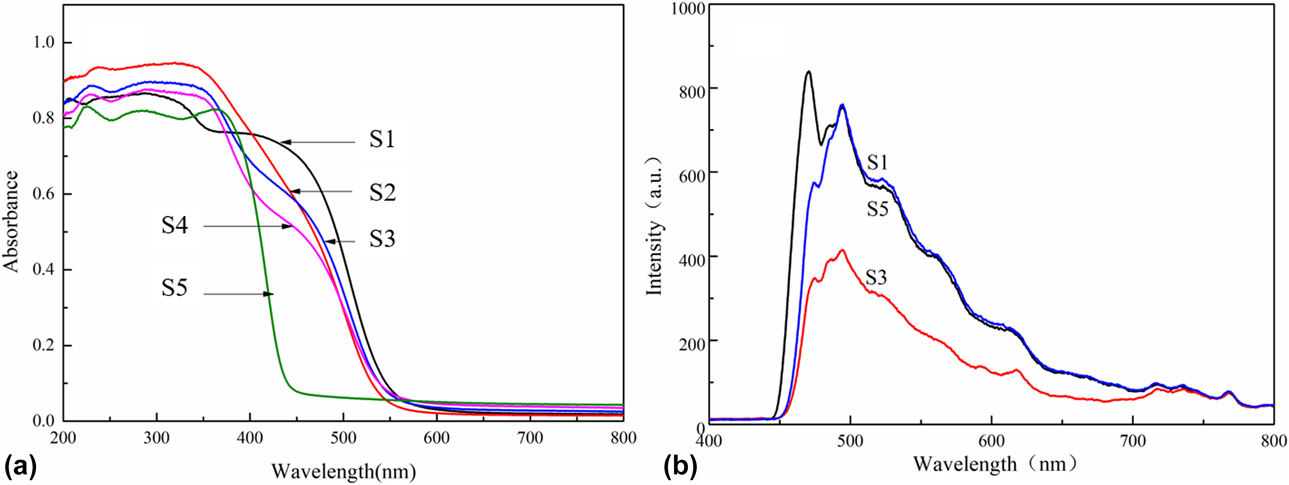
The optical properties of the prepared samples were investigated by UV-Vis diffuse reflectance spectroscopy, as shown in Fig. 7(a). All samples showed strong absorption in the visible region. β-Bi2O3 had a strong absorption at a wavelength near 535 nm and BiOBr at 440 nm. The edge of the absorption band of the β-Bi2O3/BiOBr heterojunction was between β-Bi2O3 and BiOBr and gradually changed into the edge of the absorption band of BiOBr. The band gap transition is shown in the steep shape of the spectrum of visible light absorption [Reference Lei52]. The electronic structural properties of the semiconductor markedly influenced light absorption and migration of photogenerated electrons and holes in photocatalysis [Reference Shan, Liu, Chen, Wu and Han46].
(a) UV-DRS of different samples. (b) PL spectra of β-Bi2O3 (S1), BiOBr (S5), and β-Bi2O3/BiOBr (S3).
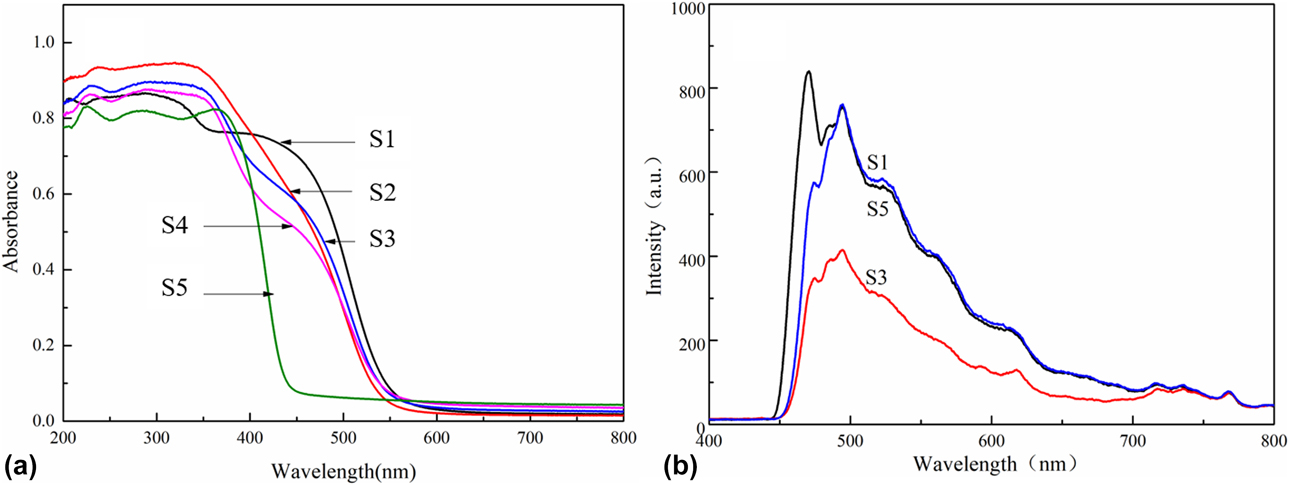
The comparison of the photoluminescence (PL) spectra of β-Bi2O3, BiOBr, and β-Bi2O3/BiOBr at room temperature is shown in Fig. 7(b). A strong emission peak can be observed around 470 nm in the β-Bi2O3 spectrum, which is produced by the recombination of electron–hole pairs. However, the emission peak of β-Bi2O3/BiOBr is strongly decreased compared with that of β-Bi2O3. It is well known that when the lifetime of an electron–hole pair increases, the energy loss increases and the peak intensity of the PL spectrum is decreased. The PL emission peak intensity of the β-Bi2O3/BiOBr heterojunction (S3) was significantly lower than those of β-Bi2O3 and BiOBr, indicating that the separation of photogenerated electron–hole pairs was increased.
According to the absorption spectrum shown in Fig. 7(a), the band gap energy (E g) of the semiconductor could be evaluated from the following formula [Reference Ohko, Tryk, Hashimoto and Fujishima53]:
 $$\alpha hv = A{\left( {hv - {E_{\rm{g}}}} \right)^{{n / 2}}}\quad ,$$
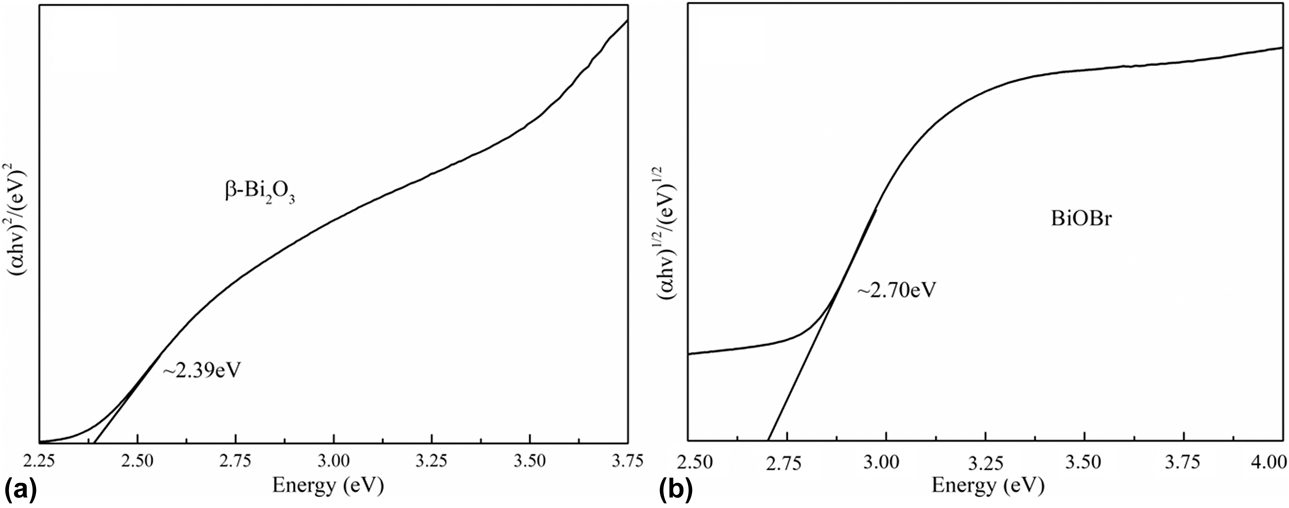
where α, hv, E g, and A are the optical absorption coefficient, photo energy, band gap energy, and a constant, respectively. The value of n depends on the characteristic of the transition in a semiconductor (n = 1 for direct transition and n = 4 for indirect transition) [Reference Shan, Wang, Li, San, Liu, Dong and Wu54]. In this study, n is 1 for β-Bi2O3 and 4 for BiOBr. In the plots of (αhv)2 versus hv for β-Bi2O3 and (αhv)1/2 versus hv for BiOBr, shown in Figs. 8(a) and 8(b), respectively, the band gap energies of β-Bi2O3 and BiOBr are estimated from the tangent lines to be 2.39 and 2.70 eV, respectively.
(a) Plots of (αhv)2 versus hv for β-Bi2O3 (S1) and (b) plots of (αhv)1/2 versus hv for BiOBr (S5).
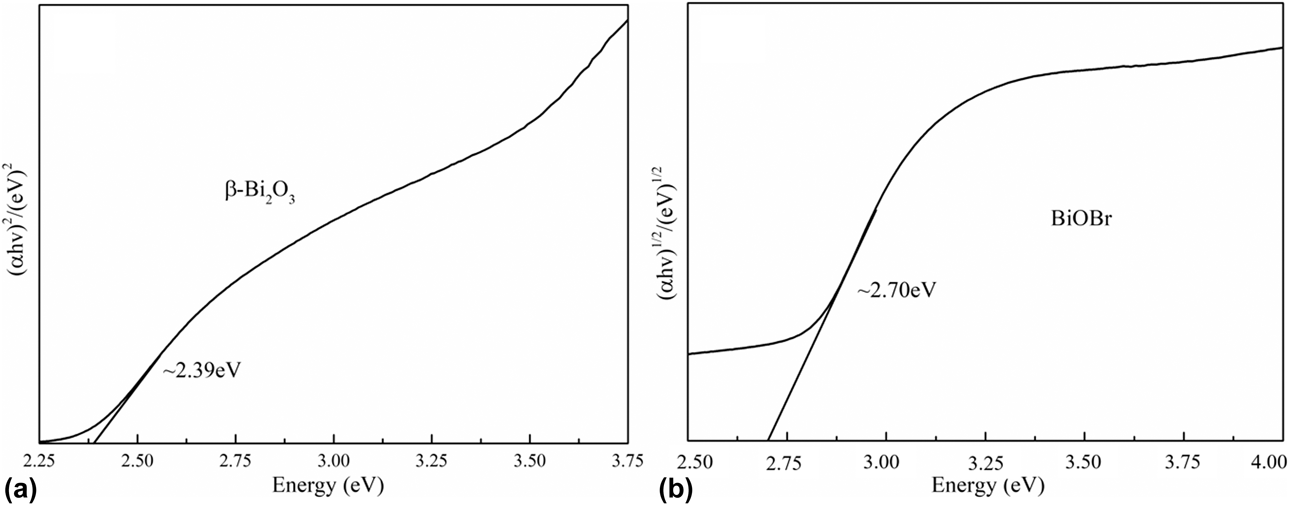
To understand the effect of the β-Bi2O3/BiOBr heterojunction on the photoelectron–hole separation, the band structure of β-Bi2O3 and BiOBr was investigated.
 $${E_{{\rm{VB}}}} = \chi - {E_{\rm{e}}} + 0.5{E_{\rm{g}}}\quad ,$$
 $${E_{{\rm{CB}}}} = {E_{{\rm{VB}}}} - {E_{\rm{g}}}\quad ,$$
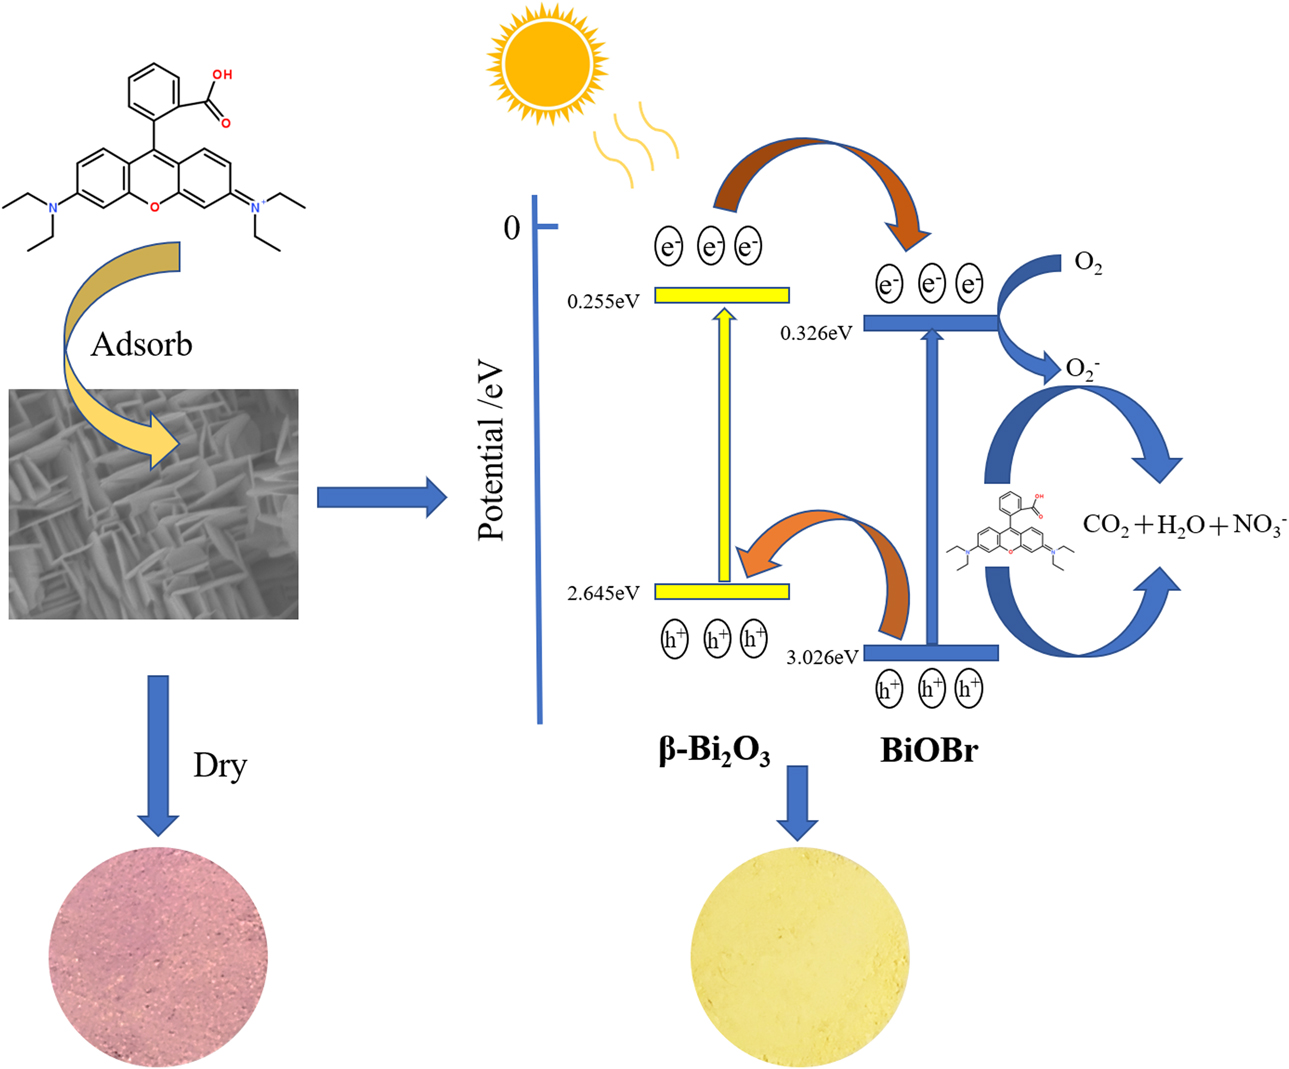
where E VB and E CB are the valence band (VB) and conduction band (CB) potentials, respectively. χ is the absolute electronegativity of the semiconductor, E e is the energy of free electrons on the hydrogen level (about 4.5 eV), and E g is the band gap energy. The absolute electronegativity of β-Bi2O3 and BiOBr is about 5.950 eV and 6.176 eV [Reference Han, Li, Yang and Lin41, Reference Hu, Yang, Dai, Zhang and Liang55], respectively. Given the band gap value from Figs. 8(a) and 8(b), the E VB and E CB of β-Bi2O3 can be calculated to be 2.645 and 0.255 eV, respectively. The E VB and E CB of BiOBr can be calculated to be 3.026 and 0.326 eV, respectively.
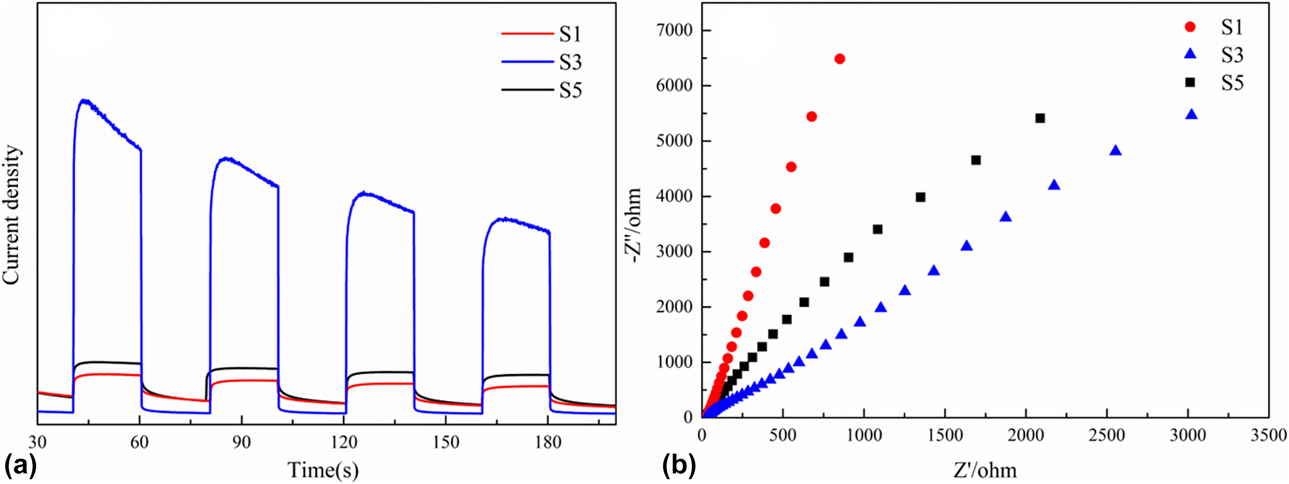
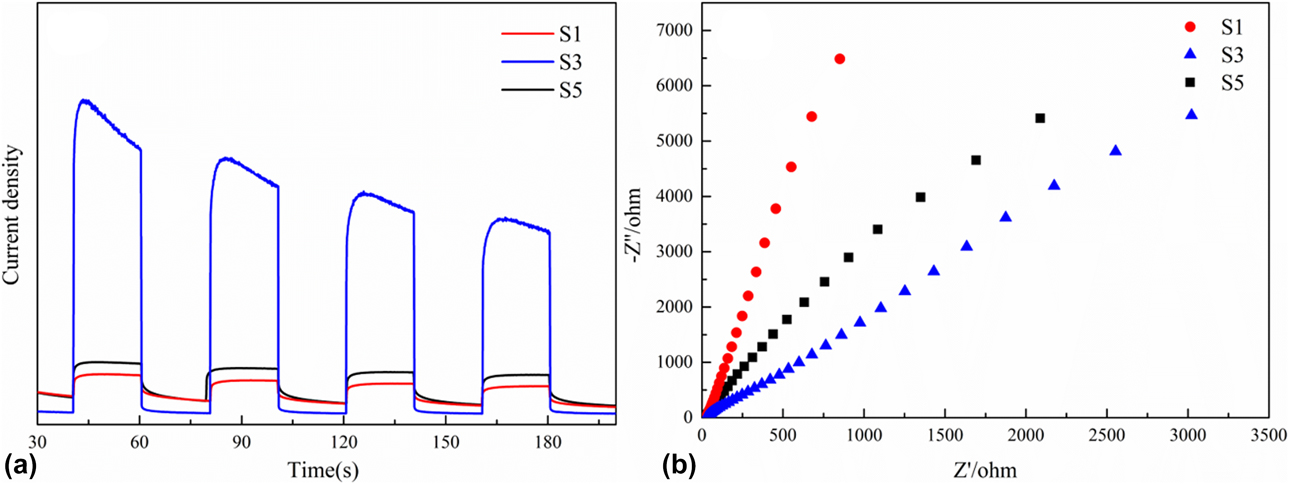
Electrochemical impedance spectroscopy and photocurrent test were performed to investigate the electron transfer and recombination process [Figs. 9(a) and 9(b)]. As shown in Fig. 9(a), the photocurrent and conversion efficiency of S3 was higher than that of S1 and S3. Higher photocurrent response indicates higher electron–hole separation efficiency. Based on the equivalent circuit model, smaller arc radius in high frequency region indicates faster charge transfer. The arc radius of S3 is smaller than that of S1 and S3, which indicates that S3 has higher charge transfer efficiency than S1 and S3 and confirms the PL results.
(a) Photoelectric conversion performances and (b) electrochemical impedance spectra.
In addition, we also explored the mechanism of heterojunction formation. When excited by visible light with energy above the band gap, the transition of electrons from VB to the CB of BiOBr can produce electron–hole pairs. Similarly, the electrons of β-Bi2O3 can jump to CB in the VB of β-Bi2O3. The altered band structure between BiOBr and β-Bi2O3 with staggered levels enables the efficient interfacial transfer of photoinduced charge, as shown in Fig. 10. The electrons on β-Bi2O3 can easily jump to VB and inject into the less electron CB of the surrounding BiOBr molecules. A large number of large BiOBr nanosheets provide an excellent platform for transferring electrons, thereby facilitating the transfer of electrons to BiOBr. At the same time, the photoexcited holes (h+) in the VB of BiOBr are transferred to the VB of β-Bi2O3. The lifetime of photogenerated electrons and holes was improved [Reference Li, Yu, Jaroniec and Chen1, Reference Han, Sun, Chuah and Jaenicke20, Reference Qin, Chen, Feng, Chen, Li and Gao22, Reference Low, Yu, Jaroniec, Wageh and Al-Ghamdi24, Reference Tang, Wang, Wu, Liu and Liu50]. Therefore, efficient separation of photogenerated electron–hole pairs was successfully achieved at the interface of the heterojunction between β-Bi2O3 and BiOBr, resulting in photocatalytic enhancement of the heterojunction. The degradation process of RhB is depicted in Fig. 10. Through its adsorption ability the sample will quickly adsorb pollutants. Under the light, the pollutants are decomposed and, in this way, the RhB degradation efficiency is greatly improved.
The degradation of organic pollutants with the β-Bi2O3/BiOBr heterojunction photocatalysts under simulated solar light irradiation.

Conclusion
In summary, the β-Bi2O3/BiOBr heterojunction photocatalysts were prepared by an in situ chemical transformation method. Under visible light irradiation for 25 min, the RhB degradation rate with β-Bi2O3/BiOBr, β-Bi2O3, and BiOBr were 99.85, 6.97, and 29.75%, respectively. The photocatalytic efficiency of β-Bi2O3/BiOBr was significantly improved compared with those of β-Bi2O3 and BiOBr due to the utilization of a pore structure to adsorb contaminants and enhance the separation ability of electron–hole pairs by constructing a heterojunction. The combination of adsorption and degradation processes greatly enhanced the efficiency of the photocatalytic degradation. The β-Bi2O3/BiOBr heterojunction photocatalysts with high adsorption performance offer a new approach to control water pollution. Compared with other sewage treatment agents, the β-Bi2O3/BiOBr heterojunction photocatalyst is more efficient and is therefore a very promising photocatalyst for water pollution treatment.
Experimental
Materials
Bismuth nitrate pentahydrate [Bi(NO3)3·5H2O, AR], nitric acid (HNO3, 65%), sodium carbonate (NaCO3, AR), hydrobromic acid (HBr, 48%), absolute ethyl alcohol, and deionized (DI) water were purchased from Sinopharm Chemical Reagent Co., Ltd. (Shanghai, China). Rhodamine B (RhB, AR) was obtained from Amethyst Chemicals (J&K Scientific, Beijing, China). All chemicals were of analytical grade and used as received without further purification.
Sample preparation
Bismuth carbonate (Bi2O2CO3) was used as a precursor to prepare β-Bi2O3, as previously reported [Reference Jiang, Li, liu, Ye and Lin56]. Initially, 11.64 g of Bi(NO3)3·5H2O was dissolved in 60 mL of 1 mol/L solution of HNO3. Under constant stirring, a large amount of white precipitate was produced by adding 240 mL of 0.6 mol/L aqueous Na2CO3 solution to the mixture. The mixture was stirred for 15 min and kept at 60 °C for 12 h in a water bath. Eventually, the precipitate was collected by centrifugation and washed 3 times with DI water and then dried for 6 h in an oven at 60 °C to obtain the Bi2O2CO3 precursor. β-Bi2O3 was obtained by calcining Bi2O2CO3 at 350 °C for 2 h.
The β-Bi2O3/BiOBr heterojunctions were prepared by treating β-Bi2O3 in situ with HBr (48%). Specifically, 0.7 g of freshly prepared β-Bi2O3 was dispersed into a 20-mL mixture of ethanol and DI water (5 mL ethanol and 15 mL DI water). To obtain different amounts of BiOBr in β-Bi2O3/BiOBr heterojunctions, the molar ratio of HBr (48%) to β-Bi2O3 in the dispersion was controlled to 0.2, 0.4, 0.8, 1.2, 1.6, 2.0, separately. Then, the mixture was sonicated for 10 min and stirred at room temperature for 30 min. The precipitate was recovered by centrifugation, washed several times with ethanol, and ultimately dried in an oven at 80 °C for 24 h. By following this procedure, BiOBr was synthesized in the presence of excess HBr. For comparison, β-Bi2O3 was also treated in the same manner in the absence of HBr. The experimental results show that the degradation of RhB is best when the molar ratio of HBr to β-Bi2O3 is 1.6. The molar ratios of HBr to β-Bi2O3 were, respectively, controlled to 0, 1.2, 1.6, 1.8 and the excesses. The molecular ratios of β-Bi2O3/BiOBr were 100, 25, 11.1, 5.5, and 0%, which were recorded as S1, S2, S3, S4, and S5, respectively.
Characterization
The crystal phases of the Bi2O3/BiOBr heterojunction photocatalysts were analyzed by XRD on a Shimadzu X-ray diffractometer Model XD-3 (Shimadzu Corp., Kyoto, Japan) with Cu Kα radiation in the range of 20–80°. The microstructure of the photocatalyst was examined by TEM using an FEI Tecnai G2 F30 transmission electron microscope (FEI Company, Hillsboro, Oregon). The morphology of the photocatalysts was investigated by SEM on a JEOL JSM-7001F scanning electron microscope (JEOL Ltd., Tokyo, Japan). The diffuse reflectance spectra were recorded on a Cary 5000 UV-Vis spectrometer (Varian, Palo Alto, California) in the range of 200–800 nm, using BaSO4 as the reflectance standard material. The PL spectra of the photocatalyst powders were measured at room temperature using a Hitachi F-4600 system (Hitachi Ltd., Tokyo, Japan) equipped with a solid sample holder. The specific surface area and pore size distribution were determined using a Micromeritics ASAP 2020 Plus multifunction adsorption instrument (Micromeritics Instrument Corp., Norcross, Georgia) at YanHao Material Laboratory. The samples were degassed under vacuum at 150 °C for 2 h before measurement.
Evaluation of photocatalytic activity
The photocatalytic activity of the prepared β-Bi2O3/BiOBr photocatalyst was evaluated by measuring the degradation of RhB. In this experiment, 0.05 g of photocatalyst was dispersed in 100 mL of an aqueous RhB solution (5 mg/L). Prior to degradation, the suspension was magnetically stirred in the dark for 20 min to establish an adsorption–desorption equilibrium between the pre-irradiation β-Bi2O3/BiOBr photocatalyst and RhB. The visible light was irradiated using a Xe lamp (350 W) with a cut filter of 420 nm. After a specific time, 3 mL of the solution was taken out and the photocatalyst was removed by centrifugation. The dye solution was analyzed using a UV-Vis spectrometer to monitor its concentration in real time, which was determined by the height of the maximum absorbance. The change in the organic contaminant concentration was evaluated using the large absorption of RhB at 554 nm.
Supplementary material
To view supplementary material for this article, please visit https://doi.org/10.1557/jmr.2019.243.
Author contributions
S.Z. Wu, Z.H. Huang, and X.M. Zhang conceived and designed the experiments. S.Z. Wu carried out the experiments. S.Z. Wu, Y. Xie, X.M. Zhang, Y.G. Liu, M.H. Fang, X.W. Wu, and X. Min analyzed the data and discussed the results. S.Z. Wu wrote the paper.
Acknowledgments
This present work was supported by the Fundamental Research Funds for the Central Universities for financial support (Grant Nos. 2652018325, 2652018321, and 2652018320) and National Key R&D Program of China (Grant No. 2018YFC190503).