I. INTRODUCTION
Photocatalysis has drawn much attention because it is an efficient and energy-saving way to solve the shortage of nonrenewable energy resource, Reference Chen, Shen, Guo and Mao1 in which perovskite structured semiconductors have become one of the promising catalysts due to its low cost, high chemical stability, and excellent photocatalytic performance. Reference Rao, Lee, Prater, Smirnov and Narayan2,Reference Macaraig, Chuangchote and Sagawa3 To improve the photocatalytic performance of semiconductor catalysts, the band gap should be close to 1.23 eV, which, thus, can response to full spectrum of solar light. But the indirect band gap energy of SrTiO3 (STO) is 3.25 eV, while its direct band gap energy is 3.75 eV, which is active only under the region of ultraviolet light. Reference Benthem, Elsasser and French4 And it is well-known that narrowing the band gap of semiconductor catalysts, adjusting the band gap position and increasing the activity of electrons and holes can efficiently enhance their photocatalytic performance under visible light. Reference Queisser and Haller5 So, in literature, many researchers have tried to tune the band gap of STO catalysts through doping with metal, Reference Jiao, Chen, Xiong, Wang, Lu, Ye and Bi6–Reference Ham, Hisatomi, Goto, Moriya, Sakata, Yamakata, Kubota and Domen8 or nonmetal, Reference Xian, Yang, Di, Ma, Zhang and Dai9,Reference Ribeiro10 and combining with other cocatalysts. Reference Sasaki, Nemoto, Saito and Kudo11,Reference Liu, Wang, Yang, Du, Jiang, Shen, Liang and Xu12 Doping efficiently creates a middle state in the band gap, which successfully narrows the band gap, thus letting the catalysts absorb more visible part of sunlight. Reference Chen, Huang, Wu and Lin13 For example, Xie et al. synthesized Fe-doped STO through sol–gel method, which presented better photocatalytic performance than the original pure STO. Reference Xie, Sun and Lin14 The enhancement of photocatalytic performance of Fe-doped STO under visible light was mainly attributed to the metal-to-metal charge-transfer between ionic bond. A Z-scheme system, mixing Ru/SrTiO3:Rh and BiVO4 particles in acidified aqueous solution, can efficiently accelerate the electron transfer, which will strengthen the absorption of sunlight. Reference Sasaki, Nemoto, Saito and Kudo11
Doping a semiconductor using foreign atoms can lift the maximum of valence band without changing the minimum of conduction band and add new energy level in the band gap, which could definitely narrow the band gap of STO. Reference Kawasaki, Nakatsuji, Yoshinobu, Komori, Takahashi, Lippma, Mase and Kudo15 But doping will introduce impurity phase, which may cause high recombination rate of the photo-generated electrons and holes, and thus, can limit the photocatalytic performance. Reference Yang, Wang, Han and Li16 In addition, foreign atoms from doping can also make catalyst inhomogeneous and unstable. Reference Ronning, Borschel, Geburt and Niepelt17 On the other hand, experimental measurements and theoretical calculations have recently proved that defect engineering is an efficient way to narrow band gap, without inducing any impurity phase. Reference Venkatesan, Fitzgerald and Coey18–Reference Zhang, Hu, Xu, Qin, Sun, Gao, Zhang and Jiang20 Defect engineering is practicable for adjusting band gap, due to that point defects of oxide materials can be obtained through experiments. Reference Warren, Vanheusden, Dimos, Pike and Tuttle21,Reference Hong, Sakai and Brize22 And there have been some literatures reporting that both cationic and anionic vacancies can be created in STO. Reference Tan, Zhao, Zhu, Coker, Li, Zheng, Yu, Fan and Sun23–Reference Xu, Yang, Bai, Tan, Zhang and Tang26 For instance, Tan et al. synthesized a crystalline core/amorphous shell structure (SrTiO3@SrTiO3−x ) through a facile solid-state reaction of NaBH4 and STO. Reference Tan, Zhao, Zhu, Coker, Li, Zheng, Yu, Fan and Sun23 The defective STO can produce H2 under simulated solar light at a rate of about 2.2 mmol/h g, which is 2.3 times higher than that of the untreated STO. Xie and co-workers prepared self-doped STO through a carbon-free one-step combustion method, followed by heat treatment in Ar atmosphere. Reference Xie, Umezawa, Zhang, Reunchan, Zhang and Ye24 Ti3+ and oxygen vacancies were implanted into STO by forming Ruddlesden–Popper crystallographic shears, resulting in narrowed band gap and enhanced absorption of visible light, thus improving the photocatalytic performance of STO under solar light.
Moreover, it is commonly accepted that oxygen vacancies play a significant role in photocatalytic process. Reference Wang, Ling and Li27 There are two kinds of oxygen vacancies in STO, including surface oxygen vacancies and bulk oxygen vacancies inside the bulk materials. Reference Tan, Zhao, Zhu, Coker, Li, Zheng, Yu, Fan and Sun23 Surface oxygen vacancies can prevent the recombination of electron and hole pairs, which act as both the charge traps and the adsorption sites. Because the electrons and holes can transport themselves to the adsorption sites, the photocatalytic performance of semiconductor catalysts can be improved. Bulk oxygen vacancies can only be the charge traps of the photo-generated electron and hole pairs, which will result in bad photocatalytic performance. Reference Lv, Zhu and Zhu28,Reference Bai, Wang, Zong, Lv, Sun and Zhu29 There is no doubt that Ti4+ in STO can be transformed into Ti3+ when oxygen vacancies were built up inside STO, and Ti3+ will contribute itself to promoting the light absorption performance of STO. Reference Cronemeyer30
In addition, to implant oxygen defects into oxide materials, fast cooling process has been proved to have the ability to produce a great amount of oxygen vacancies in a short period time. Reference Ou, Li, Pan, Zhang, Xu, Gu, Nan and Wu31 There have been a number of researches that introduced oxygen defects inside STO by using such techniques. Reference Tan, Zhao, Zhu, Coker, Li, Zheng, Yu, Fan and Sun23,Reference Xie, Umezawa, Zhang, Reunchan, Zhang and Ye24 But researchers still want to find a more efficient and rapid way to implant defects with lower cost. Fortunately, laser-melting treatment is an efficient way to introduce oxygen defects into oxide materials, Reference Molaei, Bayati, Alipour, Nori and Narayan32 thus enhancing its photocatalytic performance, because laser-melting process can heat up and cool down materials in just a few seconds. But there are no data on STO using laser-melting treatment. In this paper, defective STO was successfully synthesized by using a laser-melting process, narrowing the band gap of STO and thus resulting in excellent photocatalytic performance under simulated visible light.
II. EXPERIMENTAL PROCEDURE
A. Samples preparation
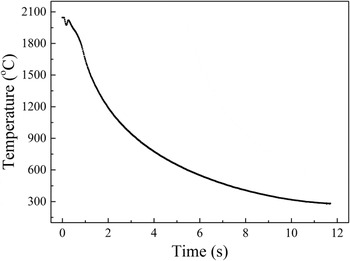
Pure pristine SrTiO3 was melted using a pneumatic suspension laser platform (HY-HV CO2/1.8) with forced air cooling device, providing the rapid heating and cooling process. The open laser chamber was filled with suspended gas of Ar. In a typical laser-melting process, pristine SrTiO3 powders were heated and melted into a pellet in a few seconds and then cooled rapidly in 15 s from 2000 to around 200 °C. The cooling temperature recorded by an infrared thermometer during laser-melting treatment is shown in Fig. 1. After the laser-melting treatment, the obtained STO pellets were grounded into powders for further characterization.
Cooling temperature recorded by infrared thermometer during laser-melting treatment.

B. Materials characterization
Power x-ray diffraction patterns and crystal structure were measured by using an x-ray diffractometer (XRD; Smartlab, Tokyo, Japan) in a 2θ range from 20° to 90° with Cu target. Raman spectra of the samples were recorded on a Raman spectroscope (LabRAM HR Evolution, Horiba, Japan) from 100 to 1200 cm−1 using a 633 nm excitation light source and a CCD detector at room temperature. The sample was exposed to 10 mW power laser and the spectral resolution was lower than 1.6 cm−1. An UV–Vis–NIR spectroscope (UV-2600, Shimadzu, Kyoto, Japan) was used to record the diffuse reflectance spectra of the samples in the wave length range from 200 to 1400 nm, during which the reflectance standard material is BaSO4. X-ray photoelectron spectroscopy (XPS) measurements for pristine and laser-melted SrTiO3 were performed by using an Escalab 250Xi spectrometer (Thermo Fisher Scientific, Waltham, Massachusetts) equipped with an Al Kα radiation source (1487.6 eV) and hemispherical analyzer with a pass energy of 30.0 eV at an energy step size of 0.05 eV. The collected data were calibrated for charging effect-induced peak shifts using the binding energy of C 1s peak (284.8 eV). Spectral deconvolution was performed by Shirley background subtraction using a Voigt function convoluting the Gaussian and Lorentzian functions. The magnetic properties were measured on a vibrating sample magnetometer (VSM; 7307, Lake Shore Cryotronics, Inc., Westerville, Ohio). The morphology of the samples was examined by a field-emission scanning electron microscope (SEM; JSM-6701F, JEOL Ltd., Tokyo, Japan) with an operated accelerating voltage of 15 kV. Transmission electron microscopy (TEM) images were obtained by a JEOL-2010 microscope (JEOL Ltd.). The specific surface area is acquired through the Brunauer–Emmett–Teller (BET) N2 adsorption measurement by a Micromeritics ASAP2020 surface analyzer (Micromeritics, Norcross, Georgia).
C. Band energy evaluation
The calculation of band gap energy of semiconductors is based on Tauc’ method and the data were acquired from the UV–Vis–NIR spectra through testing pristine STO and laser-melted STO. The Tauc’ method can extrapolate the linear portion of the Kubelka–Munk function to zero, which can be used to obtain the approximate value of band gap energy. Reference Zhang, Guo, Wang, Javed and Hu33 It means that the linear part of the value of energy to (hαv)2 can be extrapolated to the horizontal axis, which is the band gap energy of pristine STO and laser-melted STO.
The Mott–Schottky plot measurement is carried out using a conventional three-electrodes electrochemical workstation (CHI 600B, CH Instruments, Beijing, China). The pristine and laser-melted STO were prepared by spin-coating, acting as working electrodes. Pt net as the counter electrode and Ag/AgCl as the reference electrode were both used in 1 M KOH aqueous solution which can maintain the stability of the film. Then, Mott–Schottky plots were derived from impedance-potential tests conducted at a frequency of 1 kHz in the dark.
D. Photocatalytic activity measurement
100 mg of the laser-melted STO and pristine powders were used as photocatalysts, respectively, to measure the photocatalytic activity under simulated visible light. The sample was dispersed in 50 mL deionized water and 1 wt% Pt was added in the solution as cocatalyst from H2PtCl6 solution. After intensive mixing by magnetic stirring, to load Pt onto the catalyst, the solution was exposed to ultraviolet light for 2 h. Then 50 mL methanol was added into the solution as sacrificial agent. Later, the well-mixed solution was poured into a Pyrex top-irradiation reaction vessel, which is connected to a vacuum condition system and a closed gas circulation. During the reaction, the irradiation of Xe lamp (Microsolar 300, Microsolar Inc., Beijing, China) was acted as a light source (approximately 200 mW/cm2) to simulate solar light, and 400 nm cutter and other optical filters were used for limiting light source to pure visible light. After evacuating the entire system for 30 min, the photocatalytic activity of the sample was tested under Xe lamp irradiation for 6 h. The amount of hydrogen evolution was automatically measured by gas chromatograph. The cycling test was conducted by using the laser-melted STO as photocatalyst. During each cycle, the sample was irradiated with Xe lamp for 6 h to produce hydrogen, and then it was kept in the dark overnight before the hydrogen evolution test was repeated.
III. RESULTS AND DISCUSSION
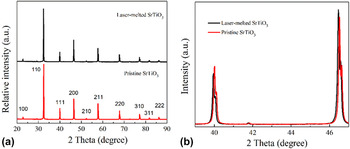
The XRD patterns for the pristine and laser-melted STO are shown in Fig. 2(a). As can be seen from this figure, both samples posses the same cubic structure (JCPDS card no. 79–0175), indicating no structural change and no impurity phases induced inside STO after the laser-melting process. Moreover, the laser-melted STO samples are polycrystalline without any additional phase. However, the positions of the XRD peaks of the obtained laser-melted STO samples shift to low 2θ angle compared with those of the pristine STO without laser-melting treatment [see Fig. 2(b)], suggesting that the interplanar spacing of STO was reduced during the fast heating and cooling process. Since there was no any impurity doping during the processing, this result implies that rich defects were induced and implanted into STO during the fast heating and cooling process. Besides, the XRD peaks of the laser-melted STO as shown in Fig. 2(b) become a little bit narrower in their widths compared to those of pristine STO, revealing that the laser treatment to some extent enhances the crystallinity of the STO semiconductor. In addition, the color of STO samples changed from white to gray after the laser-melting treatment, implying that the laser-melted STO presented an increasingly wider optical absorption.
(a) XRD patterns of the pristine and laser-melted SrTiO3 samples; (b) XRD peak shift after laser-melting treatment.

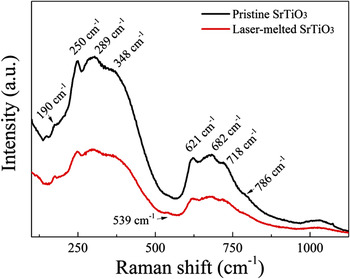
The Raman spectra shown in Fig. 3 demonstrate two main regions of second order broadband in 250–400 cm−1 and 600–750 cm−1, which are consistent with the results in literature. Reference Rabuffetti, Kim, Enterkin, Wang, Lanier, Marks, Poeppelmeier and Stair34 The standard Raman spectrum at room temperature is dominated by the second order of scattering rather than first order Raman activity according to the rules of selection. Here the Raman peaks of both samples at 190, 250–348, 539, 621–718, and 786 cm−1 were found, which could be assigned to the different modes of TO2 (O–Sr–O), TO3 (O–Sr–O), TO4 (O–Sr–O), LO (Ti–O–Ti), and LO4 (Ti–O). Reference Silva, Avansi, Andre, Ribeiro, Moreira, Longo and Mastelaro35 These Raman peaks indicate that the laser-melted STO had good symmetry as the pristine STO, which is confirmed by the result of XRD that the laser melting treatment did not change the crystalline structure of STO.
Raman spectra of the pristine and laser-melted SrTiO3 samples.

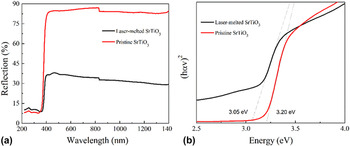
The UV–Vis–NIR diffuse reflectance spectra of both samples are shown in Fig. 4(a). It reveals that the pristine STO exhibits an absorption onset at 390 nm, which is consistent with the band gap edge of absorption of pristine STO [3.20 eV for STO as shown in Fig. 4(b)]. Compared with the pristine STO, an absorption band close to 400 nm reaching to the infrared region was observed for the laser-melted STO samples [see Fig. 4(a)]. The red-shift of the absorption band agrees with the narrowed band gap of STO samples (3.05 eV) after the laser-melting treatment [see Fig. 4(b)], which also indicates that some defect energy levels may be created inside the band gap of STO during the laser treatment. It is well accepted that the variable band gap is caused by the increasing defects, especially oxygen vacancies, on the surface, by which some reduced titanium states such as Ti3+ could be formed during the process, owing to the light absorption beyond 400 nm Reference Wang, Ling and Li27,Reference Cronemeyer30
UV–Vis–NIR diffuse reflectance spectra of the pristine and laser-melted SrTiO3 samples: (a) the absorption in UV–Vis–NIR range; and (b) optical band gap using Tauc’ method.

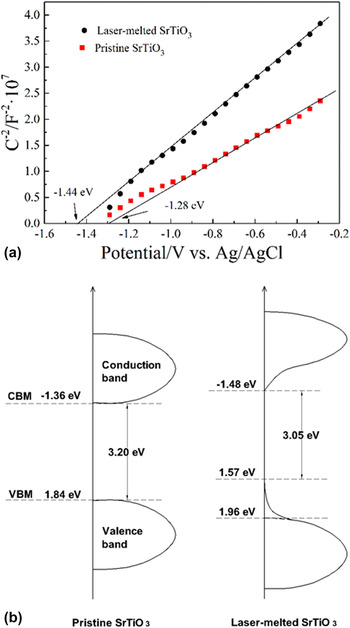
To further investigate and identify the implantation of defects in STO, the chemical bonding state and valence band position of the samples were examined by XPS. Figure 5 presents the spectra of Ti 2p, Sr 3d, and O 1s, and the valence band positions of the raw pristine STO and the obtained laser-melted STO samples. Two strong peaks of Ti 2p spectrum in pristine STO samples are located at 457.9 and 463.7 eV, respectively, originating from the Ti 2p 3/2 and Ti 2p 1/2 bonding states separated by 5.8 eV, which is assigned to the spin orbit interaction. Reference Jiang, Zhang, Jiang, Rong, Wang, Wu and Pan36 Furthermore, the Ti 2p can be divided into two sets of peaks assigned to the chemical states of Ti3+ and Ti4+. The peaks centered at 457.0 and 463.1 eV can be attributed to the chemical state of Ti3+, while the other two peaks at 458.1 and 463.9 eV are the feature peaks of Ti4+. Reference Jiang, Zhang, Jiang, Rong, Wang, Wu and Pan36 As the peak area of Ti3+ at 457.0 eV is too small to detect, only Ti 2p 1/2 can be fitted for Ti4+ and Ti3+ peaks. Comparing the Ti3+/Ti4+ ratios of the pristine STO and laser-melted STO samples, it is seen that the ratio has been increased by nearly 2% from 9.24% to 11.37% after the laser treatment, which means that Ti3+ is created inside the semiconductor through the laser treatment and oxygen vacancies are formed during the process. In addition, it has been noted that the peaks of Sr 3d spectrum for the pristine STO sample are located at 132.4 and 134.2 eV, corresponding to the binding energy of Sr 3d 5/2 and Sr 3d 3/2, respectively. Reference Chen and Mao37 However, after the laser-melting treatment, the peaks of Ti 2p and Sr 3d shift to higher binding energy direction of about 0.2 ± 0.05 eV, compared with those of the pristine STO sample. It should be contributed by the rich defects in the obtained laser-melted STO samples, such as oxygen vacancies. Reference Rao, Lee, Prater, Smirnov and Narayan2 Moreover, the induced defects in obtained STO samples during laser-melting process push the Fermi level upward, in which the defects obtained from that process enlarge the equilibrium electron and hole density. Reference Sun and Lu38 Therefore, the shifts of Ti 2p and Sr 3d peaks in the laser-melted STO samples can be observed. Figure 5(c) presents the O 1s core-level spectra of the pristine and laser-melted STO samples. For the pristine STO sample, the fitted three peaks located at binding energies of 529.0, 530.5, and 531.5 eV, assigning to the lattice oxygen ion, oxygen vacancy, and adsorption oxygen in STO, respectively. Reference Miot, Husson, Proust, Erre and Coutures39 After the laser-melting treatment, the O 1s peak of lattice oxygen shifts toward higher binding energy direction, which is consistent with the previous results of Ti 2p and Sr 3d for the same reason. Reference Miot, Husson, Proust, Erre and Coutures39 It is clear that the peak intensity of defect oxygen in the laser-melted STO sample at 530.5 eV becomes stronger than that in pristine STO sample, indicating an increasing oxygen vacancies concentration in the obtained laser-melted STO samples under nonequilibrium laser-melting condition. Reference Lv, Yao, Ma, Pan, Zong and Zhu40 The valence band calculated from XPS for the pristine STO samples as shown in Fig. 5(d) reveals that the pristine sample displays the characteristic VB of STO with the band edge at 1.84 eV, blowing the Fermi level. Since the optical band gap of pristine STO is 3.20 eV, the conduction band minimum (CBM) would occur at −1.36 eV. Nevertheless, two slopes can be observed in the laser-melted STO samples, in which the main absorption onset is located at 1.96 eV, while the band tail shifts to a lower energy of 1.57 eV. As is well-known, the maximum value of valance band of STO coincides with O 2p. Reference Chambers, Droubay, Kaspar, Gutowski and van Schilfgaarde41 Thus, the shift in valence band towards lower energy after laser-melting treatment is on account of the generation of defects in the obtained laser-melted STO samples. In addition, the appearance of band tail is originated from surface and bulk defects, particularly oxygen vacancies, Reference Aiura, Hase, Bando, Yasue, Saitoh and Dessau42 and thus the substantial defects and disorders exit in conduction band. As shown in Fig. 4(b), the narrowed band gap of defective STO sample is 3.05 eV. As a result, the CBM of the laser-melted STO sample lies at −1.48 eV with a small band tail, which is also due to the defects inside STO. Reference Aiura, Hase, Bando, Yasue, Saitoh and Dessau42 According to Mott–Schottky plot (see in Fig. 6(a)), it can be confirmed that STO is a n-type semiconductor, Reference Li, Yu, Low, Fang, Xiao and Chen43 and the minimum values of conduction band of the pristine STO and laser-melted STO lie in −1.28 eV and −1.44 eV, respectively. It is obvious that the result of Mott–Schottky plot is not exactly the same as the calculated value from the results of XPS and UV–Vis–NIR diffuse reflectance spectra, because the reading value from Mott–Schottky plot is the flat-band potential, which is 0.1–0.2 eV higher than the accurate minimum value of conduction band. Reference Wen, Xie, Chen and Li44 So, there is a slight difference between them. On the basis of the results of XPS and UV–Vis–NIR diffuse reflectance spectra, the band diagrams of the pristine and laser-melted STO samples can be presented in Fig. 6(b). It is seen from this figure that the induced defects not only drove the decrease in the valence band of the laser-melted STO samples, but also push its conduction band to a more negative value. The narrowed band gap and changed band may enhance the photocatalytic activity of STO and provide wider applications in photocatalysis. Moreover, defects implanted during laser-melted process can introduce mid-gap states and prevent the photo-generated electrons and holes pairs in STO from recombination, which can also enhance the photocatalytic performance for the laser-melted STO samples. Reference Bai, Wang, Zong, Lv, Sun and Zhu29
XPS spectra of the pristine and laser-melted SrTiO3 samples: (a) Ti 2p; (b) Sr 3d; (c) O 1s; and (d) valence band.

(a) Mott–Schottky plot of the pristine and laser-melted SrTiO3 samples; (b) band diagram of both pristine and laser-melted SrTiO3.

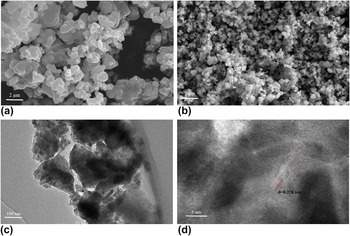
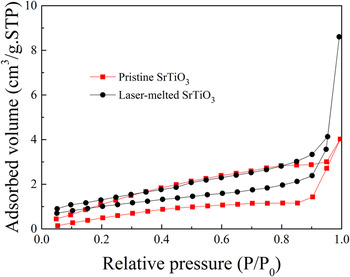
To further study the microstructures of both pristine and laser-melted STO samples, SEM, TEM, and high resolution (HR) TEM examinations were carried out, and typical images were shown in Fig. 7. As is seen from Figs. 7(a) and 7(b), the size of STO nanoparticles is reduced from around 500 nm for the pristine STO sample to approximately 200 nm for the laser-melted STO sample, but the grains of the pristine STO sample alone is uniform and well dispersed. The laser-melting treatment might lead to the grain agglomeration of STO samples [see in Fig. 7(c)], resulting in larger nanoparticles of STO, compared with that of the pristine STO. Moreover, as shown in the HRTEM image in Fig. 7(d), there is obvious lattice fringes in the laser-melted STO samples, which can be assigned to the interplanar spacing d = 0.278 nm of the laser-melted STO samples. And the interplanar spacing d = 0.278 nm corresponding to the (110) plane of STO is in agreement with the result of XRD analysis. Meanwhile, a number of disorders exist in the laser-melted STO samples, which were implanted during laser-melting process [see the broken circles in Fig. 7(d)]. In addition, nitrogen isothermal adsorption as shown in Fig. 8 can be cataloged as type IV isotherm with H2 hysteresis loop, indicating that the samples are mesoporous. Reference Qian, Zhao, Shen, Zhang, Peng and Fu45 The area of hysteresis loop decreased after laser melting treatment, revealing that the mesopores inside becomes more homogeneous through the treatment. And the specific surface areas of the pristine and laser-melted SrTiO3 samples are 3.306 and 3.688 m2/g, respectively. Due to the increase in the specific surface area, the transmission of photo-generated electrons could be accelerated and the recombination rate could be decreased, thus the hydrogen evolution could be enhanced.
(a) SEM micrograph of pristine SrTiO3 sample; (b) SEM micrograph of laser-melted SrTiO3 sample; (c) TEM micrograph of laser-melted SrTiO3 sample; (d) HRTEM micrograph of laser-melted SrTiO3 sample, where the broken circles indicated the defects.

N2 adsorption–desorption isotherm of the pristine and laser-melted SrTiO3 samples.

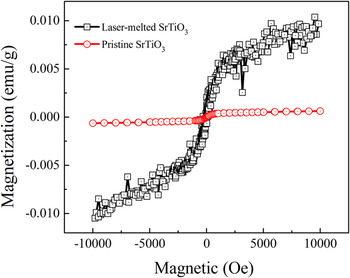
As is well known, STO is usually regarded as a kind of paramagnetic material. However, the present STO samples after laser-melting treatment exhibit enhanced magnetism, which can be seen from Fig. 9. It is noted that the calculated saturation magnetization of the laser-melted STO samples increases from 6.3 × 10⁻⁴ to 1.0 × 10⁻² emu/g (with an approximately two orders of magnitude increase), while the coercivity of the samples declines to 1.9 Oe. According to the previous research, Reference Zhang, Hu, Cao, Sun and Qin46 the existence of Sr vacancies cannot change the magnetism state of STO. Hence, here vacancies of oxygen and/or titanium ions should be responsible for the change of the paramagnetism for the pristine STO to magnetism for the laser-melted STO. As is known in literature, Lee et al. Reference Lee, Xie, Sato, Bell, Hikita, Hwang and Kao47 ever reported that the electrons of the regional Ti 3d can act as magnetic centers to create magnetism state inside STO, which is one of the reasons that ferromagnetism is introduced. In this work, the laser-melting treatment can result in unpaired electrons, because the high energy of the laser treatment can change the orbital structure and electronic configuration, thus significantly enhancing the magnetism of STO. Reference Rao, Lee, Prater, Smirnov and Narayan2 In summary, the magnetism of STO was obviously enhanced after the laser-melting process, since rich defects and traps were induced during the treatment, which can confirm that defects are successfully implanted inside STO.
Hysteresis loops of the pristine and laser-melted SrTiO3 samples.

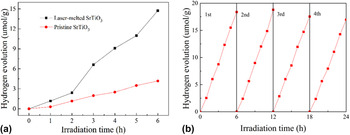
It is well known that oxygen vacancies can significantly affect the photocatalytic performance of catalysts. Reference Wang, Ling and Li27 The obtained laser-melted STO samples with rich defects and narrowed band gap can present an enhanced photocatalytic performance in the visible light region. The hydrogen evolutions of the pristine and laser-melted STO samples are compared in Fig. 10(a). The pristine STO sample exhibits a relatively stable hydrogen evolution rate of 0.70 μmol/(h g), while the laser-melted STO sample presents an increased, stable hydrogen evolution rate of 2.46 μmol/(h g), which is approximately 3.5 times higher than that of the pristine STO. Moreover, as shown in Fig. 10(b), the hydrogen evolution rate is almost not changed after cycling test for four times, indicating that the laser-melted STO has relatively stable photocatalytic performance. For these results, it can be explained as follows. Defects, such as oxygen vacancies, can provide extra electrons, which can efficiently improve the density of electrons inside the semiconductors, Reference Tan, Zhao, Zhu, Coker, Li, Zheng, Yu, Fan and Sun23,Reference Liu, Chen, Xia, Tian and Chen48 thus also enhancing the transport of charge in the STO. In addition, the Fermi level is driven a little to the conduction band of STO, which is confirmed by the calculation of band gap energy as shown in Fig. 6(b). The shifted Fermi level can accelerate the separation of photo-generated electrons and holes on the surface of the catalysts, which might be the reason that the photocatalytic performance of STO is improved after laser-melting treatment.
(a) Hydrogen evolution of the pristine and laser-melted SrTiO3 samples; and (b) cycling tests on the hydrogen evolution of the laser-melted SrTiO3 sample.

IV. CONCLUSIONS
STO samples with narrowed band gap were efficiently obtained by rapid and highly efficient laser-melting treatment, shortening the reaction time to only a few seconds. Moreover, during the process, a great amount of defects were introduced into STO, due to the heating and cooling process in just a short period of time. The obtained laser-melted STO powder has significantly enhanced performance in photocatalytic hydrogen evolution under visible light, which is approximately 3.5 times higher than that of the pristine STO. All the results presented above have proved that laser-melting treatment is a new method to modify oxide semiconductors to obtain rich point defects and narrowed band gap.
ACKNOWLEDGMENT
The authors would like to thank the financial support for this work from the National Natural Science Foundation of China (grant no. 61274015).