1. Introduction
Ancient in origin, the Mexican milpa system refers to a complex combination of agronomic practices, crop associations, and rotation sequences that varies by cultural context and agro-environment. The most fundamental components of the system are landraces of maize, bean, and squash, some more extensively cultivated than others, depending on the soil and agronomic features of the farm and consumption needs of the family. Each year, approximately two million farm households across Mexico continue to cultivate milpas on around six million hectares of land; most of these households depend on milpa production for food security and the quality of their diet (Bellon and Berthaud, Reference Bellon and Berthaud2004).
In addition to generating private benefits for farm families, the milpa systems of Mexico generate public economic value of global importance. One of the last reservoirs of maize genetic resources for humanity, these poly-cropping systems are characterized by richness of species and varieties as well as genetic diversity, particularly in maize (Bellon and Berthaud, Reference Bellon and Berthaud2004; Van Dusen and Taylor, Reference Van Dusen and Taylor2005).Footnote 1 Maize landraces found in these systems have the potential to contribute unique traits needed by plant breeders (genetic resistance to certain plant diseases, pests and abiotic stresses) to improve crops, supporting global food security (Fowler and Hodgkin, Reference Fowler and Hodgkin2004; Harlan, Reference Harlan1992). Maize is the most heavily traded staple food on a world scale after wheat.
Despite general recognition of these points, the sustainability of the milpa system is uncertain (Van Dusen and Taylor, Reference Van Dusen and Taylor2005). Off-farm employment, and particularly long-distance migration, competes for labor and diminishes transmission of knowledge among farmers and from one generation to another (Taylor et al., Reference Taylor, Yunez-Naude and Dyer1999; Taylor and Martin, Reference Taylor, Martin, Rausser and Gardner2000; Bellon, Reference Bellon2004; Van Dusen, Reference Van Dusen and Smale2006). In zones with higher potential productivity, the continued management of milpa systems has long been threatened by the commercialization and intensification of maize production (Bellon, Reference Bellon2004).
Since 2001, Mexico has been the focal point of the debate over GM maize.Footnote 2 The intensity of the debate is compounded by lack of scientific consensus with respect to the long-run impact of GM crops on the environment and human health. Bellon and Berthaud (Reference Bellon and Berthaud2004) concluded that as long as Mexican farmers continue to manage their maize landraces as open, dynamic systems, the cultivation of GM maize poses little direct threat to landraces from a biological standpoint. However, they state that the high rate of gene flow in this heavily cross-pollinating species, combined with the continual mixing and exchange of seed, could create situations that have not yet been considered in the biosafety assessments conducted in the commercial farming systems for which GM maize was developed.
The aim of this paper is to estimate Mexican farmers' valuation of the most important components of agrobiodiversity found in the milpa system, and the option to cultivate GM maize in this system. Economic theory predicts that those farmers who derive the highest values from components of agrobiodiversity would need the least economic incentive to continue managing them (Meng, Reference Meng1997; Brown, Reference Brown, Orians, Brown, Kunin and Swierzbinski1990). These ‘least cost’ farmers would be ranked the highest as candidate farmers for in situ conservation. Similarly, it is expected that those farmers who derive the most (least) disutility from cultivation of GM maize, would be least (most) likely to adopt GM maize varieties.
The agrobiodiversity components examined in this study are crop species richness (maize, beans, and squash), maize variety richness, cultivation of a maize landrace, and the option to grow GM maize. Since these agrobiodiversity components are not traded in markets (Van Dusen and Taylor, Reference Van Dusen and Taylor2005) and cultivation of GM maize is currently prohibited in Mexico, we apply a stated preference choice experiment approach. Choice modeling allows us to estimate the value of each one of the milpa attributes, including new milpa attributes that are not part of farmers’ current system, such as the cultivation of GM maize varieties. Data were collected from 382 farm households in the states of Jalisco, Michoacán, and Oaxaca.
We analyse the heterogeneity of farmer preferences across cultural contexts and agro-environments with a latent class model (LCM), which enables us to identify the characteristics of farmers who are most likely to continue managing milpa systems and those least likely to cultivate GM maize. Understanding the heterogeneity of farmer preferences is important in order to target conservation effectively and accurately predict the costs and benefits of conservation. Identifying those farmers who would derive the highest potential benefits (or costs) from adopting GM maize is also crucial for understanding its probable impacts.
This paper contributes to the literature in three ways. First, only a few previous applied economics studies have investigated the determinants of milpa and maize diversity in Mexico, and these have been based on the theoretic framework of the household farm (Smale et al., Reference Smale, Bellon and Aguirre Gomez2001; Van Dusen and Taylor, Reference Van Dusen and Taylor2005), a revealed preference method. Second, this study adds to the growing literature that employs the choice experiment method to estimate farmer valuation of agrobiodiversity (Scarpa et al., Reference Scarpa, Drucker, Anderson, Ferraes-Ehuan, Gomez, Risopatron and Rubio-Leonel2003a, Reference Scarpa, Ruto, Kristjanson, Radeny, Drucker and Regeb; Ndjeunga and Nelson, Reference Ndjeunga and Nelson2005; Ruto, Reference Ruto2005; Birol et al., Reference Birol, Smale and Gyovai2006). Third, it contributes to an emerging literature that employs this method to value non-market goods in developing countries (Othman et al., Reference Othman, Bennett and Blamey2004; Naidoo and Adamowicz, Reference Naidoo and Adamowicz2005).
The next section (section 2) presents the theoretical framework and explains the choice experiment design. Section 3 describes the research design. Econometric results are presented in section 4. Conclusions are drawn and policy implications discussed in section 5.
2. The choice experiment method
2.1. Theoretical framework
The choice experiment approach has a theoretical grounding in Lancaster's model of consumer choice (Lancaster, Reference Lancaster1966), wherein the author proposed that consumers derive satisfaction not from the goods themselves, but from the attributes they provide. The approach also has an econometric basis in models of random utility (Luce, Reference Luce1959; McFadden, Reference McFadden and Zarembka1974), which are used to integrate behavior with economic valuation in the choice experiment. In this approach, the utility of a choice is comprised of both a deterministic component and an error component that is independent of the deterministic part and follows a predetermined distribution. The error component implies that predictions cannot be made with certainty; choices made among alternatives will be a function of the probability that the utility associated with a particular option is higher than that associated with other alternatives.Footnote 3
Earlier applications of the approach assumed homogeneous preferences across respondents. However, preferences are in fact heterogeneous, and accounting for this heterogeneity enables unbiased estimation of individual preferences, enhancing the accuracy and reliability when estimating demand, participation, marginal welfare, and total welfare (Greene, Reference Greene1997). Furthermore, accounting for heterogeneity enables the formulation of policy recommendations that take equity concerns into account. Information about who will be affected by a policy change and the aggregate economic value associated with such change is necessary for the crafting of efficient and equitable policies (Boxall and Adamowicz, Reference Boxall and Adamowicz2002).
The latent class model is one of the most recent models employed to investigate preference heterogeneity. The LCM casts heterogeneity as a discrete distribution, i.e. a specification based on the concept of endogenous (or latent) preference segmentation (Wedel and Kamakura, Reference Wedel and Kamakura2000). The approach depicts a population as consisting of a finite and identifiable number of segments, or groups of individuals. Preferences are relatively homogeneous within segments, but differ substantially from one segment to another. The number of segments is determined endogenously by the data. The slotting of an individual into a specific segment is probabilistic, and depends on the social, economic, and demographic characteristics of the respondents, as well as their perceptions and attitudes. Furthermore, respondent characteristics affect choices indirectly through their impact on segment membership. Scarpa et al. (Reference Scarpa, Drucker, Anderson, Ferraes-Ehuan, Gomez, Risopatron and Rubio-Leonel2003a) and Ruto (Reference Ruto2005) employed this model to value livestock attributes, whereas Hu et al. (Reference Hu, Hünnemeyer, Veeman, Adamowicz and Srivastava2004) and Kontoleon and Yabe (Reference Kontoleon and Yabe2006) used it to investigate consumer preferences for GM food.
Formally, in the LCM employed here, the utility that farmer i, who belongs to a particular segment s, derives from choosing milpa alternative J ∈ C can be written as

where Xij is a vector of attributes associated with milpa alternative j and farmer i, and βs is a segment-specific vector of taste parameters. The differences in βs vectors enable this approach to capture heterogeneity in milpa attribute preferences across segments. Assuming that the error terms are identically and independently distributed and follow a Type I (or Gumbel) distribution, the probabilistic response function is given by
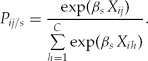
M* is a segment membership likelihood function that classifies the farmer into one of the S finite number of latent segments with some probability, Pis. The membership likelihood function for farmer i and segment s is given by  , where Z represents the observed characteristics of the farm family, such as their social, economic, and demographic characteristics, perceptions and attitudes, and farm agro-ecology. Assuming the error terms in the farmer membership likelihood function are independently and identically distributed across farmers and segments, and following a Gumbel distribution, the probability that farmer i belongs to segment s can be expressed as
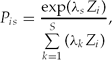
where λk(k = 1, 2, . . .S) are the segment-specific parameters to be estimated. These denote the contribution of the various farmer characteristics to the probability of segment membership. A positive (negative) and significant λ implies that the associated farmer characteristic, Zi, increases (decreases) the probability that the farmer i belongs to segment s. Pis sums to one across the S latent segments, where 0 ≤ Pis ≤ 1.
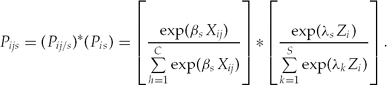
In order to derive a mixed-logit model that simultaneously accounts for milpa choice and segment membership, (2) and (3) are brought together. The joint probability that individual i belongs to segment s and chooses milpa alternative j is given by
2.2. Choice experiment design
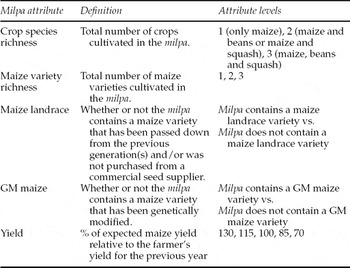
In this study, utility function (1) is associated with the preferred milpa alternative, j ∈ C. The first step in choice experiment design is defining the milpa in terms of its attributes and the levels of these attributes. The most important milpa attributes and their levels were identified in consultation with experts from the Instituto Nacional de Ecologia (INE, the Mexican National Institute of Ecology), drawing on the results of informal interviews and workshops with milpa farmers in the study sites and a thorough review of previous research on milpa management (Bellon and Brush, Reference Bellon and Brush1994; Louette and Berthaud, Reference Louette and Berthaud1997; Bellon, Reference Bellon2004; Bellon and Berthaud, Reference Bellon and Berthaud2004). The chosen attributes and their levels are given in table 1.
Milpa attributes and attribute levels used in the choice experiment

The first three attributes reflect the various components of agrobiodiversity found in the milpa. Crop species richness refers to the count of major species cultivated in the field (maize, beans, squash). Maize variety richness refers to the number of maize varieties grown. Previous studies found that multiple maize populations still coexist in milpa systems (Bellon and Brush, Reference Bellon and Brush1994; Louette et al., Reference Louette and Berthaud1997). These maize populations are not limited to landraces, but may also include modern varieties (hybrid or non-hybrid), as well as ‘creolized’ modern varieties purposefully crossed and selected by the farmers (Bellon, Reference Bellon2004). The richness of both maize varieties and crop species should be considered when studying milpa management choices, because milpa diversity is an outcome of competition both within and among species. Thus, focusing only on a single species or variety could cause biased results and misleading policy prescriptions (Van Dusen and Taylor, Reference Van Dusen and Taylor2005). The third agrobiodiversity component is the presence of a maize landrace.
The fourth attribute included in the choice set, the option to grow GM maize, was defined by INE scientists following various workshops (2001 to 2003) involving farmers from the Oaxaca and Michoacán sites. GM maize was defined simply as a maize variety that has ‘new genetic information’. The enumerators explained to the farmers that genetic material (DNA) is similar to a book of instructions used to build living organisms such as humans, plants, and animals, and biotechnology enables scientists to insert a paragraph from the book of one organism into the book of another. The enumerators did not specify any (positive or negative) traits pertaining to GM maize, in order to avoid biasing the farmers’ choices.
The fifth attribute, that of maize yield, is included in the choice set as a proxy monetary variable used to estimate welfare changes. The maize yield attribute was defined as the yield that the hypothetical milpa is expected to provide as a percentage of the yield obtained by the farmer in the previous season. A percentage specification was preferred since it was difficult to include exact yield measures in the choice experiments due to the differences in yields, milpa areas, and the intensity of maize production across the study sites. Since the property rights of the agrobiodiversity in the milpa reside with the farmers, this proxy monetary attribute represents willingness to accept (WTA) compensation for agrobiodiversity attributes, but a willingness to pay (WTP) value for the GM maize attribute (Freeman, Reference Freeman2002). This indirect measure is preferred over a direct monetary variable, because, for most families, maize produce from the milpa is not traded in markets but rather is consumed by the farm families themselves. Hence, the respondents are not likely to be familiar with a direct monetary measure of their output. The proxy monetary attribute can easily be converted into actual monetary units by using secondary data on the price of maize.
A large number of unique milpa profiles can be constructed from the attributes and levels shown in table 1. Statistical design methods (see Louviere et al., Reference Louviere, Hensher, Swait and Adamowicz2000) are used to structure the presentation of the levels of the five attributes into choice sets. More specifically, an orthogonalization procedure is employed to recover only the main effects. Twenty-four pair-wise comparisons of milpa profiles are randomly blocked into four different versions, each having six choice sets. Each farmer is presented with a version of the six choice sets, each of which contain two milpa profiles and the decision to ‘opt out’ by selecting neither of the milpa profiles presented to them. A farmer who selects neither profile is choosing to continue cultivating his/her own milpa, the attribute levels of which are recorded by the interviewers.
3. Data
The choice experiment survey was implemented in October and November 2004 with face-to-face interviews. The survey consisted of four parts. The first three parts were designed to collect information on the farmers’ observed characteristics (vector Z). First, each respondent was asked questions about his/her perceptions of and attitudes towards GM crops and food. The second part was used to obtain information on the farmer's milpa management practices and the agrobiodiversity managed on their milpas. In part three, the enumerators collected social, demographic, and economic information on the farm households and milpa decision-maker(s) within each household. Descriptive statistics of these variables are reported in Birol et al. (Reference Birol, Villalba Rayn and Smale2007). The final part consisted of the choice experiment. Prior to the presentation of the six choice sets, farmers were told the context in which choices were to be made and each attribute was described, so as to ensure uniformity in comprehension of the attributes and their levels. Farmers were reminded that there were no right or wrong answers and that the interviewers were only interested in their opinions.
3.1. Selection of study sites
In the first stage of the sampling design, three sites were selected. These included four communities of the Sierra de Manantlán District in the state of Jalisco, five communities of the Lago de Patzcuaro District in the state of Michoacán, and eight communities of the Ixtlan de Juarez District in the state of Oaxaca.
These three sites were selected based on several criteria. First, farmers practice milpa cultivation in all three sites. Second, according to the INE's collection missions, each site is also considered to be an important center of maize diversity in Mexico. Third, the three sites represent different agro-ecologies, patterns of participation in labor and maize markets, and levels of economic development. The Oaxaca site includes communities where the INE previously investigated claims that transgenic maize constructs had been found in local maize landraces. The communities studied in the Michoacán site include those where the INE held informative workshops regarding the issue of GM maize following the discovery of transgenic maize constructs in the state of Oaxaca. The communities studied in Jalisco are all located in the southern part of the state, in the buffer zone of Biosphere Reserve Sierra de Manantlán, where teosinte, the nearest wild relative of maize, still grows. A detailed description of these three sites is presented in Birol et al. (Reference Birol, Villalba Rayn and Smale2007).
3.2. Selection of farmers
In the second stage of the sample design the population considered was comprised of those farm families who had been planting maize in the milpa system at least in the past two years. The sample of farmers was selected using stratified random sampling: the study population was divided into non-overlapping strata, comprising 17 communities selected across the three sites.
The list of farm households for each community was obtained from the local authorities. Overall a minimum final sample of 150 farmers in Jalisco and Oaxaca and 200 farmers in Michoacán was thought sufficient to avoid any systematic bias from the sampling process, and was within the project budget. Therefore, in each community, depending on the number of farmers on the list, 4 per cent to 10 per cent of listed households was randomly selected and visited at their dwellings or milpas, with the help of the ‘local informant’ farmer with whom INE had past contacts. These local informant farmers facilitated enumerators’ access to the sampled farm families. Response rates of 82.7 per cent, 68.5 per cent, and 80.7 per cent were achieved in Jalisco, Michoacán, and Oaxaca respectively. A total of 420 randomly selected milpa cultivating farm households were interviewed across 17 communities in three sites. After dropping those households with several missing responses, the final sample consisted of 382 households.
3.3. Perceptions and attitudes towards GM crops and food
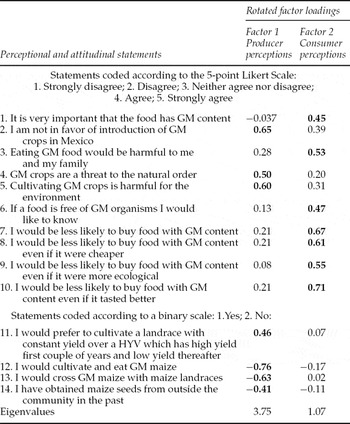
Factor analysis of responses to questions about perceptions and attitudes toward GM crops and food suggested two factors. These were named on the basis of the variables that ‘factored’ together as well as the relative magnitude of the factor loadings in absolute terms (table 2, coefficients presented in bold).
Factor analysis of perceptions of and attitudes towards GM food and crops

Source:Encuesta percepciones del productores de maíz en comunidades rurales con respecto a la liberación de materiales transgénicos dentro de alimentos y cultivos, y su impacto en la diversidad de su cultivo. Programa de Bioseguridad GEF/CIBIOGEM-INE 2004.
The first factor, labeled Producer perceptions, consisted of questions related to attitudes and behavior of farmers as milpa producers. This factor included questions on introduction of GM crops, cultivation of high-yielding varieties (HYVs) and landraces, acquisition of maize seed, and the relationship of GM crops to the environment. The second factor, Consumer perceptions, consisted of attitudes and behavior of farmers as consumers of food. The questions that were grouped together included those related to taste, price, threat to family health, and being informed about the GM content of food. A Producer Perception Index (PPI) and a Consumer Perception Index (CPI) were created by calculating the factor scores for each household. For both indices, higher values indicate a greater dislike of GM food and crops. A detailed description of the factor analysis is presented in Birol et al. (Reference Birol, Villalba Rayn and Smale2007).
4. Results
4.1. Latent class model
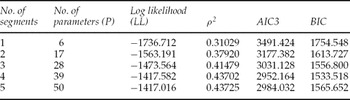
To account for heterogeneity of preferences, the LCM specification included the CPI and PPI for each farmer, the marginalization indexFootnote 4 (MI) of the farmer's community, the years of experience of the milpa decision-maker, and area of the milpa. The model was estimated with two, three, four, and five segments. The log likelihood, ρ2, Bozdogan Akaike Information Criterion (AIC3) and Bayesian Information Criterion (BIC) statistics for these models are given in table 3.
Criteria for determining the optimal number of segments

Notes: The sample size is 2292 choices from 382 farmers (N); ρ 2 is calculated as 1 − (LL)/LL(0); AIC3 (Bozdogan AIC) is (−2LL + 3P); BIC (Bayesian Information Criterion) is –LL + (P/2)*ln(N).
Determination of the optimal numbers of segments requires a balanced assessment of the statistics reported in table 3 (Louviere et al., Reference Louviere, Hensher, Swait and Adamowicz2000; Wedel and Kamakura, Reference Wedel and Kamakura2000; Andrews and Currim, Reference Andrews and Currim2003). The log likelihood decreases and ρ2 increases as more segments are added, indicating the presence of multiple segments in the sample. The BIC and AIC3 statistics decrease monotonically as the number of segments increases, but for all four statistics, the marginal effect becomes very small after the three-segment model. The BIC and AIC3 statistics are both minimized at four segments, indicating that a model with four segments is the optimal solution in this empirical application. However, Andrews and Currim (Reference Andrews and Currim2003) demonstrated that the BIC and AIC3 statistics never under-fit the number of segments but may sometimes over-fit, and that over-fitting the true number of segments produces larger parameter bias. Therefore, we chose the three-segment model, as shown in table 4.
Three-segment LCM estimates for milpa attributes

Notes: Two-tailed tests showed 10% (*), 5% (**) and 1% (***) significance levels. Source: Encuesta percepciones del productores de maíz en comunidades rurales con respecto a la liberación de materiales transgénicos dentro de alimentos y cultivos, y su impacto en la diversidad de su cultivo. Programa de Bioseguridad GEF/CIBIOGEM-INE 2004.
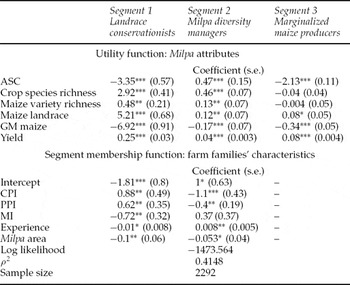
The first part of table 4 displays the utility coefficients associated with milpa attributes, while the second part reflects the coefficients for membership in the various segments. The membership coefficients for the third segment are normalized to zero, allowing us to identify the remaining coefficients of the model. All other coefficients are interpreted relative to this normalized segment (Boxall and Adamowicz, Reference Boxall and Adamowicz2002).
For segment one, the utility coefficients reveal that higher levels of crop species richness, maize variety richness, maize yield, and the presence of a landrace in the milpa have positive and significant effects on utility. The GM maize attribute has the largest absolute size, indicating that this attribute is the most important determinant of milpa choice, and has a negative and highly significant effect on utility. When the yield attribute is used as the normalizing variable, the most important agrobiodiversity attribute in the milpa is the presence of a maize landrace, followed by crop species richness and maize variety richness. The negative and significant ASC reveals that farmers in segment one prefer the status quo, which is their current milpa profiles.
The membership coefficients for segment one reveal that having a greater dislike of GM foods both as a producer and a consumer, as evidenced by higher CPI and PPI indices, increases the probability that a farmer belongs to this first segment. Households located in more marginalized communities, those with more experienced milpa decision-markers, and those with larger milpa areas are less likely to belong to this segment. We have labeled segment one the Landrace conservationists, because farmers in this segment derive the highest benefits from the maize landrace attribute and ascribe the highest costs to the GM maize attribute.
For the second segment, we see changes in the ranking of the attributes and the sign on the ASC. When the yield attribute is used as the normalizing variable, the most important milpa attribute for farm families in this segment is crop species richness, and the second most important attribute is GM maize, though this attribute affects utility only a third as much as the crop species diversity attribute. Maize landrace and maize variety richness affect farmer utility at only a fourth the level of crop species richness. The positive and significant ASC reveals that, unlike the farmers of segment one, farmers in this segment prefer the alternative milpa profiles presented to them to their current milpa profiles.
Membership coefficients for segment two reveal that those farm households with a greater dislike of GM foods and crops (higher CPI and PPI) are less likely to belong to this segment. Those with larger milpa areas and more experienced (older) farmers are more likely to belong to segment two. We have labeled this segment Milpa diversity managers, since these farmers derive positive, significant, and more equally distributed values from all agrobiodiversity components of the milpa compared to the Landrace conservationists. Interestingly, farmers in segment two have a less negative attitude toward GM foods and crops.
The utility coefficients for the third segment reveal that only maize landrace, GM maize, and yield attributes significantly affect utility. When the yield attribute is used as the normalizing variable, the GM maize attribute is a more important determinant of milpa choice than the maize landrace attribute. The negative and significant ASC indicates that farmers in this segment prefer their current milpa management practices.
The membership coefficients of this segment can be implicitly interpreted in relation to the signs of the estimated statistically significant parameters for the other two segments, as long as the parameters have the same signs in segments one and two (Kontoleon and Yabe, Reference Kontoleon and Yabe2006). Consequently, farmers who are located in more marginalized communities and those who cultivate larger milpa areas are more likely to belong to segment three. It is likely that these households depend relatively more on their milpa production for subsistence, although they would prefer a change from the status quo. Accordingly, we have labeled this segment the Marginalized maize producers.
4.2. Characterization of the segments
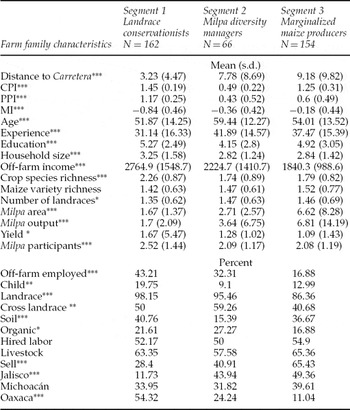
The relative size of each segment is estimated by inserting the estimated coefficients into equation (3), which generates a series of probabilities that a given farm household belongs to each of the three segments. Farm households are then assigned to a segment based on the largest probability score among the three segments. Using this procedure, we find that 42.4 per cent of the sample belongs to the first segment, 17.3 per cent to the second, and 40.3 per cent to the third. Descriptive statistics for the characteristics of each segment are given in table 5.
Characteristics of farm families belonging to the three segments

Notes: T-tests and Pearson Chi square tests show significant differences among at least one pair of segments at the 10% (*), 5% (**), and 1% (***) significance levels.
Over half of the farmers in the Landrace conservationists segment are located in Oaxaca, the state where most of the public debate on GM maize has taken place. As expected, farmers in this segment have the highest CPI and PPI, indicating that they dislike GM food and crops the most, as both producers and consumers. Even though farmers in this segment manage the smallest milpa areas and have the lowest maize outputs across the three segments, their yield per hectare (i.e. their maize productivity) is the highest across the three segments. As a result of their smaller milpa areas and lower maize outputs, a significantly lower percentage of households in this segment sell their milpa produce compared to the other two segments. The percentage of households that hire labor and the percentage that engage in livestock production do not significantly differ across the three segments. In terms of the agrobiodiversity levels managed on farms, farmers in the Landrace conservationists segment manage the highest levels of crop species richness across the three segments, though maize variety richness does not differ significantly across the segments. As expected, a statistically higher percentage of farm households in the Landrace conservationists segment manage at least one landrace in their milpas.
Households in this segment are the largest and have the highest number of milpa participants across the three segments. Milpa managers in this segment are also the youngest, least experienced, and most educated across the three segments. A higher percentage of households have at least one child younger than 12 years of age, compared to the other two segments. This result, combined with the finding that this segment produces mainly for household consumption, could help explain why this segment dislikes GM maize the most across the three segments. A higher percentage of households in this segment have at least one household member working off-farm, and they have the highest average off-farm income across the three segments. Finally, these households are located closest to the main roads, in the least marginalized communities across the three segments. Therefore they have better access to labor markets (and thus, off-farm income) and food markets, and hence do not depend on their milpa yield for food self-sufficiency. This result could explain why food safety (in the form of the highest dislike for GM maize) and food quality (reflected in a high demand for agrobiodiversity components) are more pressing issues for farmers in this segment.
Almost 44 per cent of farmers in the Milpa diversity managers segment are located in Jalisco, and over a third in Michoacán. The average size of the milpa they manage and their average output and productivity levels are intermediate between those from segments one and three. These farmers have the smallest percentage of milpas with high soil quality across the three segments, and the highest percentage of milpas managed without any chemicals. The percentage of farm families that manage landraces is similar between this group and segment one, both of which are higher than segment three. A significantly higher proportion of farmers in this segment cross maize landraces with other maize types, indicating that they like to experiment with maize varieties. Interestingly, farmers in this segment reported the least dislike for GM food and crops. Farm families in this segment manage significantly lower levels of crop species richness compared to those in segment one, showing levels similar to those in segment three. Compared to segment one, a higher proportion of farm households in segment two sell at least some of their milpa produce, but significantly less than those in segment three.
Households in the Milpa diversity managers segment are smaller than and have fewer milpa participants than those in the first segment, though these parameters do not significantly differ from those in segment three. Almost a third of the households have at least one family member working off-farm, and the household off-farm incomes are lower than those in segment one, but higher than those in segment three. Milpa managers in segment two are the oldest and have the least education. A significantly lower percentage of households have at least one child residing with them. Households in segment two are found at an intermediate distance from main roads, and the marginalization index of the communities in which they live is between those of segments one and three.
Similar to the case of segment two, almost half of the farmers in segment three, the Marginalized maize producers, are located in Jalisco and over a third are located in Michoacán. Farmers in this segment specialize in large-scale production that is the least oriented toward organic methods. The milpas in this segment are the largest, and the milpa outputs are the highest across the three segments. Average yields are the lowest among the segments, however, suggesting that producing more maize is a consequence of planting a larger area. A higher percentage of milpa producers in this segment sell their produce in markets, as opposed to household consumption. A lower percentage of households in segment three have at least one member employed off-farm, and off-farm income is the lowest in this segment, implying that most of these farmers depend on maize sales for their livelihoods. Farm households in this segment are located furthest away from the main roads, in the most marginalized communities.
4.3. Farmer valuation of milpa attributes
The marginal value of each milpa attribute represents the farmer's WTA compensation to forego an attribute or marginal WTP to adopt an attribute. The marginal value can be derived from the parameter estimates reported in table 4, by using the formula:  , where βy is the marginal utility of income, which is the coefficient of the monetary attribute (i.e. yield in this study) and βk is the coefficient of the crop species richness or maize variety richness attributes. For the binary milpa attributes (maize landrace and GM maize) the formula becomes (see Hu et al., Reference Hu, Hünnemeyer, Veeman, Adamowicz and Srivastava2004):
 .
The marginal value figures reported in table 6 were estimated for each of the three segments. The numerical results represent the percentage of the current milpa yield that farmers are WTA in order to forego an attribute (in the case of agrobiodiversity components) or WTP in order to adopt an attribute (in the case of GM maize attribute).
Segment-specific valuation of milpa attributes: % change in yield (95% confidence interval)

Notes: Welfare measures are calculated with the Delta method of the Wald procedure contained within LIMDEP 8.0 NLOGIT 3.0. Numbers represent percentage change in total maize yield. * – indicates that the Wald procedure resulted in insignificant WTA values for this attribute. T-tests show significant differences among at least one pair of segments at the 1% (***) and (**) 5% significance levels.
Across the three segments, the marginal value of GM maize attribute is consistently negative and significant, implying that farmers in all three segments are WTP in order to not adopt this attribute. The maize landrace attribute is positive and significant for all three segments, revealing that farmers would be willing to accept compensation in order to forego the cultivation of a landrace. Furthermore, we see variation in the ranking of both milpa attributes and their impact on farmer utility. These results highlight the importance of analyzing the heterogeneity of farm households.
Landrace conservationists derive the highest positive values from maize landraces, and would require the highest level of compensation to forego growing landraces. They are also willing to pay the most to not cultivate GM maize. Farmers in this segment also derive significant values from crop species richness and maize variety richness, but to a smaller extent.
Milpa diversity managers value all the agrobiodiversity attributes of the milpa, and their valuation of milpa attributes is more evenly distributed compared to members of segment one. Among the examined attributes, they derive the highest values from crop species richness, followed by the presence of a maize landrace and cultivation of an additional maize variety. Compared to segment one, farmers in segment two are WTP less in order to not cultivate GM maize.
Marginalized maize producers derive the lowest value from maize landrace cultivation in the milpa across the three segments. Their willingness to accept GM maize is not significantly different from that of the Milpa diversity managers. Farmers in this segment do not derive any significant benefits from the attributes of crop species richness and maize variety richness.
5. Conclusions and policy implications
This paper has investigated farmer valuation of milpa diversity and GM maize in traditional milpas of Mexico. A choice experiment survey was conducted with a random sample of 382 milpa farmers from three sites, which were selected based on their importance as centers of maize diversity, milpa cultivation, and public concerns about the unintentional introduction of transgenic constructs. A latent class model was estimated to simultaneously identify the characteristics that differentiate milpa producers and the values that different types of producers derive from milpa attributes, such as the presence of a maize landrace, GM maize, crop species richness, maize variety richness, and maize yield. Derivation of welfare estimates from the LCM, combined with the characterization of different producer types, enabled us to characterize the sampled milpa farmers in terms of their propensity to continue managing milpas and their (un)willingness to cultivate GM maize.
Three segments were identified. The first, characterized as Landrace conservationists, value maize landraces the most and derive the highest level of disutility from cultivation of GM maize. These farmers manage the smallest milpas, have younger and larger families, are better integrated into labor markets, and have the highest off-farm incomes. Most of the milpa farmers in this segment are located in the state of Oaxaca, where transgenic constructs were found in maize landraces and most of the public debate on GM maize has taken place. Furthermore, Oaxaca is the site with the highest percentage of population speaking an indigenous language, and previous studies have found that cultural (ethno-linguistic) diversity has a significant and positive effect on maize diversity (Brush and Perales, Reference Brush and Perales2007). Landrace conservationists also derive significant values from other agrobiodiversity attributes of the milpa (i.e. crop species richness and maize variety richness), and thus would be the least-cost targets for maize landrace conservation within the milpa system, where landraces historically evolved.
By comparison, Milpa diversity managers (members of the second segment) derive the highest values from crop species richness and maize variety richness, although they also value maize landraces. Most of these farmers are located in Jalisco, followed very closely by Michoacán. They are the oldest and most experienced milpa farmers, managing milpas with the lowest soil quality and least use of chemicals. Milpa diversity managers are curious and like to experiment with maize varieties. Thus, although they express a dislike for GM maize, they are less reluctant to try it than Landrace conservationists. Farmers in the Milpa diversity managers segment would be the least-cost targets for conservation of the milpa system.
Marginalized maize producers (members of segment three) derive the lowest values from maize landraces, and insignificant value from higher levels of crop species and maize variety richness. About 90 per cent of this segment is comprised of farmers located in Jalisco and Michoacán. Though migration from Oaxaca has been increasing steadily, Jalisco and Michoacán have historically exhibited and continue to exhibit higher rates of migration to the United States (Canales, Reference Canales2003). As suggested elsewhere (Van Dusen and Taylor, Reference Van Dusen and Taylor2005; Van Dusen, Reference Van Dusen and Smale2006), a major threat to agrobiodiversity in the milpa system is posed by long-distance migration, as compared to local off-farm employment or regional migration.
Marginalized maize producers farm the largest milpa areas and harvest the most maize, but have the lowest yields. They also sell the most maize, although they are farthest from the main roads and participate the least in local labor markets. Based on marginal value estimates, they would be the least reluctant to adopt GM maize. This is of major policy interest since most of the farmers in this segment are located in the Jalisco site, where the introduction of GM maize could have serious impact on teosinte, the nearest wild relative of maize.
Thus, the results of this choice experiment support the a priori assumption that the multiple attributes of the milpa production system, especially maize landraces, provide private benefits to the farm households of the studied sites. However, the findings also demonstrate that there is significant heterogeneity in preferences among milpa farmers in our sample. This should be taken into consideration when designing in situ conservation programs to conserve maize-based systems in these sites, as well as when estimating the losses and gains to farmers arising from the introduction of GM maize in Mexico.