Introduction
Climatic change and global warming are acknowledged as key research areas of importance, both to the scientific community and the wider population. Whilst much attention is rightly concentrated on predictions of future change, such forecasts require the support of a comprehensive knowledge and understanding of how climate has changed in the past. For many years natural ‘proxy’ records from ice cores and tree rings have provided a foundation for such undertakings. Valuable though these sources are, and they provide a view of changing climate going back over many millennia, they lack a high degree of temporal resolution, being often resolved only at annual or, at best, seasonal levels. Documentary sources of the character discussed in this paper, whilst not spanning the same time scale and being confined to the past three centuries, have the advantage of being resolved at the daily level, often with reasonably precise locations and dates and times at which those observations were made.
Following the lead set by Lamb (Reference Lamb1982) and in particular his attention to the Greenland Viking colonies, a number of researchers have made use of documentary sources in order to extend the Arctic climate record (for example Lüdecke Reference Lüdecke2005; Przybylak and Vızi Reference Przybylak and Vizi2005; Klimenko and Astrina Reference Klimenko and Astrina2006; Vinther and others Reference Vinther, Andersen, Jones, Briffa and Cappellen2006; Cappellen and others Reference Cappellen, Laursen, Jørgensen and Kern-Hansen2007). Also noteworthy are the many contributions of Wilson (Reference Wilson1982, Reference Wilson1983a, Reference Wilson1983b, Reference Wilson1985, Reference Wilson1988) although most of these used land based observations, whilst Alt (Reference Alt1978, Reference Alt1979) used weather types (based on synoptic chart evidence) to examine Arctic glacier mass balances.
Marine climate data for this region remains, however, relatively deficient over the so-called pre-instrumental period although not entirely absent and, for example, Kay Reference Kay1995; Przybylak Reference Przybylak2000, Reference Przybylak2004; Przybylak and Vizi Reference Przybylak and Vizi2005; Przybalak and others Reference Przybylak, Vizi and Wyszy'nski2010; Wood and Overland Reference Wood and Overland2003, Reference Wood and Overland2006; and Ward and Dowdeswell Reference Ward and Dowdeswell2006 have used instrumental observations kept on board Royal Navy ships voyaging to the Canadian Arctic in search of a northwest passage to extend the record to the early nineteenth century.
Most of the data in the internationally acknowledged ICOADS (International Climate Atmosphere Data Set: http://icoads.noaa.gov/) are, however, for the years after the mid-nineteenth century and follow the agreements reached at Matthew Maury's (Reference Maury1854) first maritime conference held in Brussels in 1853. However, the recently completed CLIWOC project (Climatological database of the world's oceans 1750–1850) succeeded in its objective of digitising over a million early meteorological observations from ships’ logbooks and demonstrated through its methodological developments (Garcia-Herrera and others Reference García-Herrera, Wilkinson, Koek, Prieto, Calvo and Hernández2005a, Reference Garcia-Herrera, Können, Wheeler, Prieto, Jones and Koek2005b; Wheeler Reference Wheeler2005; Jones and Salmon Reference Jones and Salmon2005) and through its online database (www.ucm.es/info/cliwoc), the scientific potential of such early logbook data for reconstructing pre-instrumental marine climates.
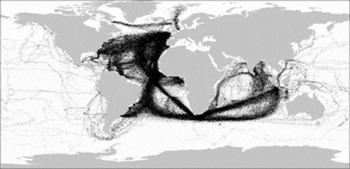
In common with the distribution of modern data, observations tended to cluster along established routes (Fig. 1) and it is apparent that certain regions remained data deficient, in particular the high northern latitudes, where Royal Navy and other shipping movements were less common. The logbooks kept by ships’ officers in the employment of the Hudson's Bay Company (HBC), with annual voyages from 1750 to the 1870, constitute therefore a particularly valuable source of weather observations, providing much information that can be used to build upon the relatively limited numbers of studies for the far North Atlantic region. Such endeavours have usually concentrated on ice cover and those by Newell (Reference Newell1983) for the Labrador Sea and Ogilvie (Reference Ogilvie1984) for the seas around Iceland are the most notable, following the early work of Speerschneider (Reference Speerschneider1931) who produced a long data series for drifting ice cover for western Greenland from 1821. Yet this remains a data deficient but climatologically sensitive region, for which no opportunity for gaining further historical insight should be overlooked.
Coverage of data points provided from the activities of the CLIWOC project. Particular note should be made of the contribution made by HBC records that produced the ‘thread’ of observations across the far North Atlantic to the immediate south of Greenland towards Canada.

Despite the need for a more adequate coverage of the region's climate, the HBC logbooks have hitherto been employed only in a very limited fashion, Catchpole and Moodie (Reference Catchpole and Moodie1976) and Catchpole (Reference Catchpole, Bradley and Jones1992) having used them profitably, but confining their researches to sea conditions and ice formation in the area of Hudson's Bay and the adjacent seas. By contrast, the CLIWOC project sought to extract data from these eighteenth and nineteenth century logbooks in order to examine the climatic environment of the wider high latitudes of the North Atlantic ocean across which the vessels sailed every year as part of their commercial duties. This paper demonstrates, drawing heavily on the CLIWOC experiences, how research can now move beyond the sea-ice index system used by Catchpole and his colleagues and into a theatre of wider scale, synoptic reconstructions, drawing upon the huge number of logbooks available for the North Atlantic region.
This paper provides a brief history of the HBC, the background to the logbooks and where they can be found and consulted. This will be followed by a review of the preservation, style and form of presentation of the logbooks, together with an example from one outward and return voyage to demonstrate how the data can be used as a source of information for past weather events. Interestingly, and despite the antiquity of the HBC, the earliest surviving logbooks date from 1751 (the Royal Navy logbook series dates back to the 1670s and that of the English East India Company even further back to the mid-seventeenth century). Their appearance at this time may be linked to the parliamentary attacks on the Company's monopoly during the 1740s. The HBC survived these attacks, but the need to prevent interlopers and to preserve their records and navigational accounts may have prompted the more assiduous record keeping which has provided this legacy.
The Hudson's Bay Company
For nearly two centuries, following its creation in 1670 when its first charter was granted by Charles II, the Hudson's Bay Company controlled fully one third of present day Canadian territory, and, latterly, large areas of the present northwestern USA. Control over this enormous domain was granted by Royal Charter following the successful voyage of the vessel Nonsuch to trade for beaver pelts with the Cree Indians near James Bay. What began as a simple fur trading enterprise evolved into a trading and exploration company that reached to the west coast of Canada and the United States, south to Oregon, north to the Arctic and east to Ungava Bay, with agents in Chile, Hawaii, California and Siberia (Williams Reference Williams1983). From its London headquarters, the Hudson Bay Company extended its communication and trade routes, using a fleet of merchant vessels. As part of this network, its ships sailed annually between London and the HBC trading posts in the bay.
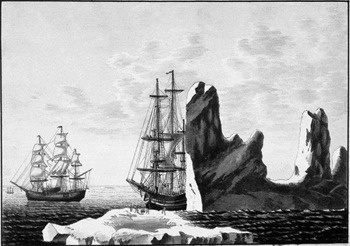
Fig. 2. shows the typical design of such vessels for the period in question. These frigates are described by Falconer's Dictionary of the marine (Reference Falconer1780) as ‘light, nimble’ ships, ‘built for the purposes of sailing swiftly, These vessels mount from twenty to thirty eight guns, and are esteemed to be excellent cruisers’. They needed, however, to be more durable than the usual trading vessel as they had to withstand possible battering from ice and the seas of the North Atlantic and of Hudson Bay.
The Swiss settler ship Lord Wellington in danger of being crushed by ice in July 1821 whilst in the company of the HBC ships Prince of Wales and Eddystone, by Peter Rindisbacher.By courtesy of the Public Archives of Canada ref. No. C-1915.

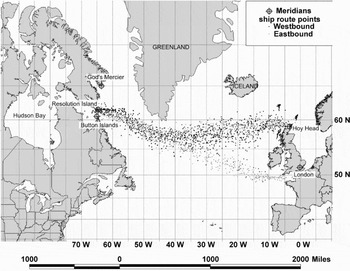
Ships were expected to set sail on their outward voyage from the Thames estuary on 31 May, but this date was not strictly adhered to, although ships rarely made their departure more than a week prior to or after this time (Catchpole and Ball Reference Catchpole and Ball1981). Once out of the Thames, they sailed northwards along the east coast of the British Isles to Stromness in the Orkney Islands, where Company servants were hired and fresh water and provisions were embarked. From here, the ships sailed round Cape Farewell in Greenland and entered Hudson Strait, south of Resolution Island. Once in the bay, the routes diverged, either south to Moose Factory or more westerly to Churchill or York Factory. On the return voyage, the majority of ships travelled back to London again via the Orkney Islands, but occasionally taking a more southerly route (depicted in Fig. 3) towards the English Channel and Thames Estuary. These voyages tended, therefore, the effects of being blown off course by unfavourable winds notwithstanding, to follow the same routes (Fig. 3). This feature is useful for the climatological interpretation of the observations as it secures a consistent spatial sampling framework, allowing for almost direct comparisons between logbook records. Although it is recognised that from the observational point of view these were mobile platforms not tied to any one place, their data can be regarded as serving much the same purpose as today's VOS (Voluntary Observing Ships) service, the data from which are used in professional meteorology without reservation concerning their ‘mobile’ character.
Map showing transatlantic route taken by the HBC ships 1760 to 1799. Note should be taken of the ‘southerly’ route that plots the return voyage of many vessels that sailed directly back to London.

The content and character of logbooks
It has always been the practice of ocean navigators to keep a record of their voyages; indeed it is probable that, long before the fifteenth century, early seafarers kept some kind of account of their passages in the Mediterranean and elsewhere (Taylor Reference Taylor1956); that of Columbus on his epic voyages to the new world being the most well known (Fuson Reference Fuson1987). Because of the many difficulties peculiar to deep water voyaging, especially in the earlier days, when no records or sailing directions existed to aid the mariner in uncharted oceans, it was necessary for safe sailing to keep a permanent record of all matters that concerned the navigation of the ship. Of these, few were more important than the wind, weather and state of the sea, all of which would influence the vessel's speed and direction of travel, and it is scarcely surprising that much attention was given to these phenomena. This assiduous keeping of weather records was not therefore a scientific exercise of the sort promoted a few decades earlier by the Royal Society and the promptings of its one time secretary, James Jurin; rather, they fulfilled the much more pragmatic role of helping to ensure safe navigation.
As maritime empires developed through the seventeenth and eighteenth centuries and trade routes were more frequented, the keeping of a logbook continued to be important but assumed a more formal character. Rather than being just a navigational guide, the logbook was a record of life on board and, as time went on, became an official document describing all management matters, from which sails were deployed to the behaviour and health of the crew and much else. The model for the HBC records may well have been derived from the Admiralty Instructions of 1731 that placed on officers a clear obligation to maintain a logbook in which
. . . He [the officer] is, from the Time of his going on board, to keep a Journal . . . and be careful to note therein all Occurrences, viz. Place where the Ship is at Noon: Changes of Wind and Weather . . . remarks on unknown Places; and in general, every Circumstance that concerns the Ship . . . he is to send a Copy of his journal for the said time, to the Secretary of the Admiralty (Great Britain, Admiralty 1731).
By 1750, the keeping of logbooks, was universal amongst commanders of all British vessels and the HBC logbooks together with those kept by the Royal Navy and the English East India Company, have fortunately survived in the great numbers, there being over 100,000 of the former and 4000 of the latter, to add to the few hundred, but important, HBC logbooks.
Hudson's Bay Company logbooks
The original logbooks of the HBC vessels are kept in the archives of Manitoba in Winnipeg, Canada (HBC 1750–1838, 1842–1870). Microfilm copies, together with additional company records, are held at the National Archives in London.
The ships’ logbook record extends from 1750 to 1870, with a gap (for unknown reasons) in the years 1839, 1840 and 1841, providing 485 logbooks from 316 vessels, each documenting the daily record of the vessel's progress whilst at sea (Catchpole Reference Catchpole, Bradley and Jones1992). Equally importantly, the ships tended to make their annual outward and return journeys from England to Hudson Bay within very much the same window of climatic opportunity each year. Catchpole (Reference Catchpole, Bradley and Jones1992) has drawn attention to the very narrow time range within which the voyages were made. The logbooks, whilst not spanning the whole year, offer climate observations gathered using a spatially and temporally highly structured sampling frame.
It is also important to note the exceptional degree of homogeneity that these documents possess. This is a feature they share with other logbooks of the period (Wheeler and Garcia-Herrera Reference Wheeler and Garcia-Herrera2009) by virtue of consistent vocabularies and observational practices, but in this case the consistency was greater as a result of the small number of officers the HBC chose to maintain on their books at any one time. For example, just three officers were responsible for 87 of the logbooks in the collection. Such a system provided ample opportunity for the persistence and probable uniformity of procedures and practices and their transmission down the generations of officers.
In this context Brázdil and others (Reference Brázdil, Pfister, Wanner, von Storch and Luterbacher2005) have drawn attention to the distinction between institutional sources of documentary evidence for climate change and records kept by individuals. The former are generally to be preferred as they tend towards homogeneity of style, content and language, and because they offer the possibility of providing evidence over much longer time periods than the life of an individual diarist or recorder. These are all advantages that are notably evident in this case.
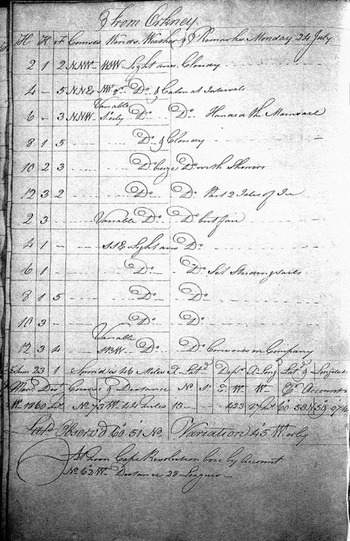
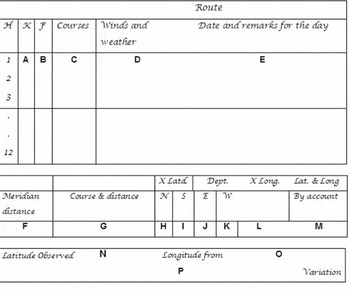
The format of the logbook page remained largely unchanged throughout the period of the record, with one page per day (although occasionally one page was split into two days). For each day, the page (Fig. 4) is partitioned to accommodate routine observations made at two hour intervals and occasional comments recorded in the remarks column. Fig. 5 is a schematic representation of a typical logbook page, although officers would sometimes adapt the layout slightly to suit their particular preferences. The quantity of information gathered on each sheet, some meteorological, some navigational and some of a more general nature, is notably impressive, but requires a degree of explanation.
A typical HBC logbook page. This example is an entry for 24 July 1797 in logbook of Queen Charlotte on her voyage from London to Churchill and York Fort, Hudson Bay. Courtesy of the archives of Manitoba.

Summary layout of HBC ship logbook page. Although differing slightly from logbook to logbook, this representation is broadly typical of the study period (1750–1800).

The day and date
This essential information was either written in full, or sometimes abbreviated using astronomical symbols (for example ⊙ denotes Sunday,  denotes Monday) at the head of each page. In 1797, officers would have been using the Gregorian calendar, which had replaced the less reliable Julian calendar in use in England until 1752 and some 11 days behind the former. It needs also to be recalled that for ships at sea the nautical day begins at midday and twelve hours ahead of the civil day (Harries Reference Harries1928), hence midday observation would be recorded one day in advance of the civil calendar. Thus, for example, the first entry in Fig. 4 would be for midday on 23 July although the concluding navigational information at the foot of the day's entries would be for midday on 24 July. This practice continued until 1805 when Admiralty orders required the civil day to be used in Royal Navy vessels. The changeover took several years in the case of the Royal Navy logbooks and the practice continued yet longer in other documents.
Time of day and speed of vessel
The column marked (H) gives the hour of the day. Once the ships entered port however, the logbook would then usually revert to the civil day so caution is needed when consulting logbooks that include both port based and voyage entries.
The columns marked (K) and (F) show the speed of the ship in knots and fathoms at that hour. The latter is commonly thought to refer to water depth (one fathom is equal to six feet), however in this case a fathom is the nautical equivalent of the land based ‘furlong’. There are eight fathoms in a nautical mile in which each fathom is 253 yards (231m), which is longer than land furlong's 220 yards (201m).
The distance run through the water was calculated by means of the logline. This was a piece of light cord about 900 feet long (300 m) and described in more detail in publications such as Norrie (Reference Norrie1889). One end was fixed to a piece of wood shaped in the form of a sector of a circle and the rest of the line was coiled around a wooden reel which was held so that the line, knotted at regular intervals to gauge the length of rope released, was free to run out. The log was thrown over the stern of the ship, and once past its wake was allowed to run out and timed with a sandglass for 30 seconds. The number of knots that ran out in this period measured the ship's speed. Normally the logline was thrown overboard every half an hour and the combined readings gave the average speed of the ship over the day's run (Norrie Reference Norrie1889).
Course and direction (C)
In this column the different and changing courses were duly noted, being important for the purposes of navigation. The courses were described using a 32 point compass. The concluding noon entry (section G in Fig. 5) was usually the overall course aggregated over the previous 24 hours and, in the example of Fig. 3 was estimated to be N 73° W.
Wind direction and force (D)
Wind direction and wind force are the most commonly recorded of all weather elements in the logbooks, as they contributed so significantly to the speed and direction of the sailing ship. Wind directions, as well as the courses, were recorded according to the 32 point compass. Observations were made at noon, but also noted whenever there was a significant change. The precise times of such changes were not always noted however, although they were listed in sequence of occurrence. There might therefore be several such observations each day. They were, however, recorded with regard to magnetic, rather than true or geographic north.
In a manner that distinguishes HBC logbooks from many others, wind direction entries were often accompanied by a wind force note. Modern meteorologists record wind force using Beaufort's numerical wind scale, which he devised in 1805 when serving on board HMS Woolwich. Beaufort first mentioned it in his private log on 13 January 1806, stating that he would ‘hereafter estimate the force of the wind according to the following scale’. Prior to this no such formal wind scale was available to recording officers on board ship. However, an unofficial vocabulary was used that had grown and developed during the eighteenth century and would have been passed on from generation to generation of mariner by a strong oral tradition (Wheeler and Wilkinson Reference Wheeler and Wilkinson2004). Since the cup anemometer was not invented until 1850, the wind force would have been estimated by noting the effects of wind pressure on the ships’ sails and the surface of the sea and in a manner not wholly dissimilar to those used today by officers of the Voluntary Observing Vessels. The wind force and direction entries were often accompanied (E) by more general observations on the management of the ship. It is in this section that descriptions of sea ice conditions are commonly found.
Remarks (E)
On the right hand side of the page in the column headed ‘Remarks’, general weather information such as rain, snow, and fog, together with information regarding the use of sail and accompanying ships, was recorded. The records of sea ice conditions that the vessels so frequently encountered distinguishes HBC logbooks from most others and such observations were usually entered in the remarks column, with additional comments occasionally appearing in the noon summary at the bottom of the page. Those navigating would have paid great attention to any potentially hazardous ice cover, in particular when sailing through the Labrador Sea and Davis Straits, where the hazards were most marked.
Although sea ice descriptions were not part of the routine information to be recorded at two-hour intervals, there is an element of regularity in their appearance in the record throughout the day, during the course of which there were seven watches, five of four hours duration and two dog watches of two hours duration (1600–1800 and 1800–2000 hours). Consequently, there were seven occasions during the day when the officer of the watch commenced his duties and would take note of any change in ice conditions warranting an entry in the logbook. It was at these times that the ice descriptions tended to be made; however they were not distributed among the watches with equal frequency, and were generally more common during daylight watches and at noon in particular (Catchpole Reference Catchpole, Bradley and Jones1992).
Meridian distance and course and distance (F and G)
In these sections are recorded information regarding the ship's course over the previous 24 hours. The ‘straight line’ distance covered and aggregated direction (as noted above) were included, together with the meridian distance, which relates to the eastwards or westwards, that is longitudinal, movement of the vessel.
Magnetic variation (P)
The variation of the compass (the angle between the direction of the true and magnetic north) was fairly well understood during the eighteenth century and it was recognised that the compass needle rarely pointed to true north. Furthermore, it was known that this deviation varied spatially from zero up to thirty or more degrees east or west in the high latitudes.
Lieutenant Edward Chappell (Chappell Reference Chappell1818) sailing to Hudson Bay in 1814, on board HMS Rosamond observed for example:
Since our departure from Stromness, the variation of the compass has been gradually increasing. We this day allowed for a difference of four points westerly between the magnetic and the true needle; whereas at Orkney there is only a difference of two points and a half, or 28 degrees. Thus it continued increasing until we arrived within about 300 miles of the settlements in Hudson's bay’ (Chappell Reference Chappell1818: 29).
It was also recognised that magnetic variation changed over time (Bloxham and Gubbins, Reference Bloxham and Gubbins1985). In order to achieve navigational accuracy at sea, calculations and corrections were needed to allow for local magnetic variation. It was particularly important that officers on board Hudson's Bay Company ships could take account of the large variations at high latitudes; for example, and, although it varied over time, ships entering the Davis Straits might find magnetic variation of as much as 40 degrees.
Longitude and latitude (H to O)
Navigation was essential for vessels and much time was devoted to ensuring the best possible estimation of position. The calculation of latitude gave a ship its position north or south of the equator. Taking the noon reading was very important, this being the time of day when latitude could be most readily estimated. Provided the sun and horizon were clearly visible, the observer took a series of sextant or quadrant angles in order to find the sun's highest altitude. This zenith distance was then added to the sun's declination as found in the Nautical Almanac, to give the latitude. In the example (Fig. 4) the ship is just over 60° 53′ N. Examination of the logbooks indicates that by the 1760s captains were employing Hadley's quadrant to make celestial observations (Catchpole Reference Catchpole, Bradley and Jones1992). This instrument continued to be used by British Merchant ships until the beginning of the twentieth century (Hewson Reference Hewson1951).
Longitude gave the ships’ position east or west of a meridian or fixed point. Each day the recording officer would use the estimated speed and direction travelled to approximate the distance sailed east or west in the previous 24 hours. Errors could therefore be cumulative and correction was not possible until landfall was made at a place of mapped and known longitude. It was only after the invention by John Harrison (Sobel Reference Sobel1996), and, later, wide availability in the early nineteenth century, of the marine chronometer that longitudinal uncertainty was removed. It was at about the same time that Greenwich was adopted as the prime meridian. Until then, the last point of land sighted was often used as the zero meridian for that leg of the voyage. In the early 1760s, HBC officers often used Hoyhead in Orkney as their meridian on the outward journey from the Britain to Hudson's Bay and, on the return journey (once they were in the Davis Straits), Resolution Island provided a useful marker. From the mid 1760s onwards, officers used London as their zero meridian. This line passed through St Paul's Cathedral about 30 seconds west of the present Greenwich meridian (Hewson Reference Hewson1951)
In the example of Fig. 4, longitude has been calculated with reference to Hoyhead in Orkney. On 24 July it was estimated ‘by account’, that is to say by one of the methods of dead (from ‘deduced’) reckoning, at just over 8º W of Hoyhead, placing the ship a couple of degrees west of the Faeroe Islands. This method of ‘dead reckoning’ had been used for centuries by mariners and it was based on estimating the ship's motion, direction and speed through the water. It was, however, vital, that the effect of the wind on the ship and its course (its leeway) was known; hence the close attention to the reliable recording of wind force and direction. Occasionally, the distance and bearings of landfall to which a vessel was heading were calculated; however this proved less accurate, as these would be based on the estimated position of the ship. Generally, when the ship was close to land, distance to landmarks was recorded in nautical miles, but when out of sight of land distances were recorded in leagues (three nautical miles to a league that is 5.6 km), possibly reflecting the greater degree of navigational uncertainty when on the open sea.
It is interesting to note that whilst detailed weather data, especially wind force and direction, were vital aids in navigation before longitude could be determined reliably by astronomical methods or by use of a chronometer, they continued to form an important part of the logbook down to the present day.
The logbooks thus contain a notable and detailed volume of navigational and meteorological information. Caution, however, is needed in the application of these observations for scientific purposes. Various corrections and manipulations have to be applied before they can be regarded as being of scientific rather than purely historical value. The following sections will describe the methods by which the transformation between these two states can be made.
Logbook information: transformation to scientific data
Wind direction
There is little ambiguity concerning the methods used by mariners to record wind direction, which were, as noted above, observed using a 32 point compass and recorded in terms of the direction from which they were blowing; this practice being established as early as 1633 as stated in John Davis's The seamans’ secrets. . .: ‘For the winde receiveth his name by that part of the horizon from whence it bloweth’ (Davis Reference Davis1594).
Contemporary texts such as Robertson (Reference Robertson1786) confirm that wind direction was recorded with reference to magnetic north, although the logbooks themselves provide no such unambiguous statement of the conventions. This procedure continued to be used following recommendations by Matthew Maury at the first maritime conference in Brussels, where he stipulated that winds were to be recorded by the compass (magnetic), but that variation should always be noted (Maury Reference Maury1854) thereby allowing the ‘correction’ to be applied should it be necessary. In order to render the data suitable for comparison with modern day wind direction records however, the original magnetic observations have always to be corrected for variation, thus giving true wind directions.
Wind force terms and their usage
Wind force terms present more intractable problems as HBC officers (and their counterparts in the English East India Company and Royal Navy) used a specifically nautical vocabulary in their recording. The many terms ranging over the full spectrum of wind strengths from calm to storm force bore little relation to the landsmen's scheme of a five point scale promoted by the Societas Meteorologica Palatina then in wide use and described in Kington (Reference Kington1988). Then, as now, the nature of the mariner's specialised and arcane vocabulary would have been something of a mystery to landsmen, but reflected the specific and more precise requirements of those who put to sea in the age of sail.
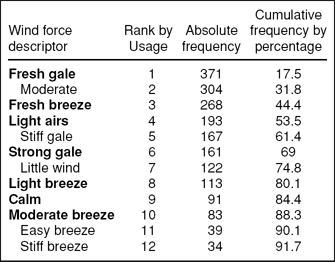
An understanding of the range of wind force descriptors used by officers of the HBC was determined by conducting a random sampling exercise. A total of 2119 wind force entries were sampled across five decades providing a total of 36 different descriptors. These were, without exception, brief one, two or three word entries, reflecting, perhaps, the need for officers to keep unambiguous and uncomplicated records readily understood between themselves. Wheeler and Wilkinson (Reference Wheeler and Wilkinson2005) found that wind force terms adhered to the following three descriptive structures:
1. a) single adjective + noun, for example strong gale,
b) double qualification + noun, for example very strong gale.
2. unqualified noun, for example hurricane
3. verb (usually the gerund) + adjective, for example blowing strong
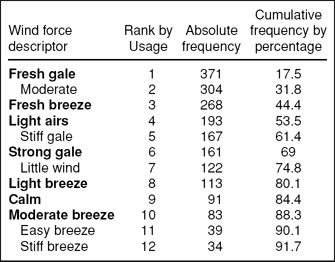
This large set of over 30 descriptors at first suggested a lack of any common vocabulary. However, Table 1 shows the cumulative percentage of usage when terms are ordered by their frequency of occurrence in the sample. The twelve most commonly used terms (the same number as constitute the present day Beaufort Scale) account for 91.7 percent of the sample. Such a notable concentration of usage of terms suggests that although the vocabulary may not have enjoyed the formal status of the later Beaufort Scale, it was one that was widely known and used by mariners of that earlier age. It was, however, different from the Beaufort Scale and only seven of the thirteen were adopted in the latter.
Frequency of the 12 most widely used HBC wind force terms (1760–1799). Note: wind terms in bold were later to be included in Beaufort's wind scale.
The conventions for the description of wind force adopted by the HBC officers differ little from those used by contemporaries in the Royal Navy and English East India Company (Wheeler and Wilkinson Reference Wheeler and Wilkinson2005). The consistencies between and within these groups of mariners can be explained by the considerable training and experience that all officers acquired whilst working ‘on deck’ (Lavery Reference Lavery1989) and the strong oral tradition of long serving officers who passed down their knowledge to their successors and, seemingly, across the different branches of the marine community of the age. In the case of HBC officers their preliminary training, often as orphan boys in need of care and protection, at Grey Coat Hospital School would have reinforced the common currency of this specialised vocabulary. Here they were instructed in navigation and mathematics and would have been introduced to the maritime vocabulary of the age.
In addition to this, the desire to be assiduous in their record keeping for the purely pragmatic purposes of secure navigation was paramount. Some of their interest might, however, also have arisen from the Company's connection with the Royal Society. Samuel Wegg, governor of the company from 1783 and treasurer for the Royal Society from 1768 to1802 encouraged the collection of scientific information and during this period of enlightenment, the company was supplied with a number of meteorological instruments, including those brought out to the bay by the astronomers William Wales and Joseph Dymond, whose principal responsibility was the observation of the transit of Venus, in 1768 (Ball Reference Ball, Bradley and Jones1992). It is reasonable, therefore, to suggest a high degree of reliability in the observations. More important, however, is the conclusion that reliability and correspondence of the observations allows the scientist to propose that when different officers use the same term, they are referring to the same conditions. Such useful conformity notwithstanding, these wind forces descriptions can only be of value if they can be re-expressed in present day Beaufort Scale equivalent forces.
The task of expressing old terms in modern day Beaufort Scale equivalent expressions was undertaken as part of the CLIWOC project. Using methods of content analysis, by referring to the sails hoisted under different conditions and to the speed of the vessel through the water, it was possible to translate over 95% of all archaic wind force terms. These re-expressions are now available in the form of a nautical dictionary produced by the project (Garcia-Herrera and others Reference Garcia Herrera, Können, Wheeler, Prieto, Jones and Koek2006). The potential for large volumes of wind direction data that resides in the many HBC logbooks offers the possibility of extending the studies by Wilson (Reference Wilson1985) who used identical data from company documents relating to activities in the factories in Hudson's Bay.
Weather descriptors
This was the simplest of the three categories to be examined. In contrast to the technical vocabulary of wind force terms, the accounts of the prevailing weather were written in standard English, in narrative form and avoided expressions that would have been unfamiliar to landsmen at the time. Occasional archaic terms might creep in, ‘mizzling’ rain being one example but, even today, there are parts of Britain where such words are still in use. In every case the descriptions would have been as readily understood by all contemporaries as they are today.
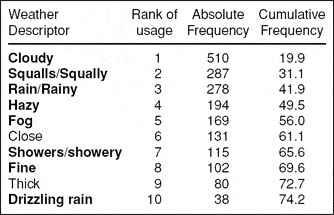
A study of the weather terms was carried out to identify the range of weather descriptors used by officers of the HBC. A total of 53 weather terms were identified from 2566 entries. Table 2 summarises the ten most common of them.
Frequency of use of the 10 most widely encountered HBC weather terms (1760–1799). Note: terms in bold were later to be included in Beaufort's ‘weather scale’.

These terms, all of which carry an immediate meaning even to twenty-first century readers, used by the officers of the HBC account for 74.2% of the sample, with eight out of the ten of the terms later adopted in Beaufort's weather scale. Beaufort originally identified 29 forms of weather from ‘blue sky’, ‘hazy’, ‘light rain’ to ‘threatening skies’. This list was reduced to 26 in 1807. Different types of weather were coded and reported using a series of alphabetic symbols of one to three characters. These symbols described the state of sky and general weather, differentiating between types of precipitation and cloud conditions. It is only recently, in 2004, that the Meteorological Office has withdrawn this system from formal use. Symbolic expression of weather terms seems never to have been used by mariners before Beaufort's proposal.
The weather terms used often consisted of an adjectival element followed by a descriptor. For example, fog (foggy) could be ‘wet’ or ‘thick’, rain (rainy) could be ‘thick’, ‘hard’, ‘heavy’, ‘light’, ‘drizzling’, ‘much’ or ‘small’. Exceptions to these are terms such as ‘cloudy’, ‘hazy’ and ‘fine’, which were used without qualification.
Ice cover descriptions
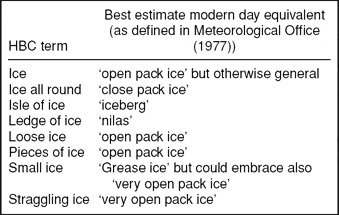
One of the distinctive and scientifically useful features of HBC logbooks is their frequent reference to sea ice. Self-evidently, the voyages were timed to avoid the worst conditions, but their passage at what was effectively the start and end of the winter season provides scope for interpreting ice cover extent and phasing at these critical times. Descriptions of sea ice were narrative in style but confined to a few terms and these are given in Table 3. This limited vocabulary probably reflects the difficulty of adequately describing the phenomenon. As recently as the post-war period the International Meteorological Code (Meteorological Office 1948) was similarly constrained, but expanded its coding system to embrace not only the ice cover but also its effect on navigation, both on a scale of zero to 9. Today there is an abundance of terms for ice, as can be seen in the advice offered to marine observers in the Marine observer's handbook (Meteorological Office 1977) and again through the World Meteorological Organisation. Nevertheless, the distinctions are such that contrasts can still be drawn between different sea ice states, and Catchpole (Reference Catchpole, Bradley and Jones1992) has been able to produce valuable indices for the Hudson's Bay region based on this information. He does, however, note that it is possible to distinguish more easily between severe ice events than between moderate or light ice conditions. Catchpole and Faurer (Reference Catchpole and Faurer1985) in their study of the particular conditions of 1816, classified all such terms under two principal headings; those of ‘open’ or of ‘closed’ ice. Recalling the dual coding system noted above, they drew the distinction between the two in terms of whether the vessel could make progress (open) or not (closed). Interestingly, no incidence of the use of the expression ‘iceberg’ appears in these documents, and this term, of Scandinavian linguistic origins, appears to have come into wide usage only in the late nineteenth and early twentieth centuries. Until that time ‘ice islands’ or ‘islands of ice’ were deemed adequate. Despite the limitations noted above there remains an opportunity to exploit these records with a view to reconstructing a chronology of ice cover in the key area of the Davis Straits according to dates of onset and recession of the annual winter ice cover. Such results would go some way to resolving the issues related to ice fronts in the region posed by Dunbar (Reference Dunbar and Karlson1971) but not fully addressed subsequently.
Ice cover terms encountered in the logbooks of HBC vessels (1760–1799).

A case study: the voyage of Prince Rupert
One of the paired voyages (outwards and return) voyages is used here to illustrate and exemplify the data preserved in HBC logbooks. The example chosen was that of the Prince Rupert (HBC 1783) that set sail from Gravesend in June 1783, returning in November that same year under the command of Joseph Spurrell. It will be clear from what follows that the weather data are not of the detailed and descriptive and narrative form that characterise many dairies kept by contemporary land based weather observers. They are more quotidian and terse accounts necessary to assist in navigation. They were not, as noted earlier, prepared solely for scientific purposes. It was, for example, observed that despite the dramatic Lakagìgar volcanic events in Iceland in 1783 (Demarée and Ogilvie Reference Demarée, Ogilvie, Jones, Ogilvy, Davies and Briffa2001) whether or not their consequences were experienced on board the vessel, they were not recorded, being superfluous to the requirements of good logbook keeping.
The data were abstracted for the ‘deep water’ leg of the voyage, embracing the period 1 July (when at 59° 31′ N, 01° 01′ W) to 8 August (at 61° 42′ N 59° 31′ W) with the return beginning on 15 October (at 60° 56′ N, 00° 59′ E) ending on 1 November (at 50° 07′ N, 64° 13′ E). The latitudes and longitudes are here as recorded in the logbooks and it will be noted that whilst the latitudes are as might be expected, the longitudes are with respect to zero meridians of Hoyhead and Resolution Island for the outward and return legs respectively.
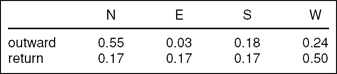
It will be noticed immediately that the outward leg was of 38 days, whilst the return was one of the fastest on record at 17 days. This distinction is a reflection of the impediment of the air circulation of these latitudes; that is, generally westerly. Indeed, it is possible to use voyage length as a measure of zonality, given that these vessels were not in the habit, as Royal Navy vessels were, of cruising and were obliged to make all haste between the home port and the Hudson's Bay factories. The data provide a fine level of temporal resolution. Midday wind direction observations, originally made on a 32 point compass basis, can be categorised into N, S, E and W quarters to reveal a measure of the organisation of air circulations and Table 4 summarises these re-grouped data.
Proportions of wind from the different quarters on outward and return voyages.
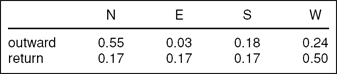
It can be seen that the outward voyage was dominated by northerly winds and the return, perhaps not surprisingly in view of its short duration, by westerlies. Moreover we also have an indication of the force of these winds. The wind force descriptors were not exactly those proposed by Beaufort in the early nineteenth century but were nevertheless conventional and common to mariners of the age (Wheeler and Wilkinson Reference Wheeler and Wilkinson2005). The CLIWOC dictionary (Garcia-Herrera and others Reference Garcia Herrera, Können, Wheeler, Prieto, Jones and Koek2006) was devised to convert archaic wind descriptors into modern day Beaufort Scale equivalents. It was based largely on the vocabulary of Royal Navy officers, and whilst that of the officers of the HBC differed only slightly, accommodation was made for these small differences. In particular, the widespread use of ‘stiff gales’ in the latter had no corresponding popularity with Royal Navy officers. The result of converting the range of terms into Beaufort forces is summarised in Table 5.
Proportion of winds of different force for outward and return voyage.

Given the prevailing climatology of the route the general absence of winds of less than force 5 is not remarkable, but the outwards passage seems to have been particularly unsettled and it is the ability of such data sets, enhanced, of course, by extension over the years, to identify developing trends in wind direction and force that renders these documents so useful for scientific research. The more narrative entries are not without their interest. These are largely confined to notes on the incidence of rain, snow or fog. Thus on the outward and return voyages there were 21 and 14 rain days respectively. Snow was recorded only once outward but on all first four days of the return leg. Sea state was also noted, with swell being a feature of particular interest. For example, on 20 July Spurrell noted ‘a great sea with a northerly swell’. However, it is the entries for ice cover that offer the greatest scope for climatic study. On 20 August, when at 62° 40′ N, 38° 00′ W (of Greenwich) we have the following record ‘8pm 10 isle of ice in sight, midnight among a many isles of ice, 4am 20 isles of ice in sight, noon a great many isles of ice in sight’. Because such conditions would hinder the progress of a vessel that was intended for as rapid a passage as possible, the captain would be anxious to inform the employers of any events that might have delayed his passage, and we can be confident that this immediate need would ensure that all such encounters would be committed to record, providing thereby an enduring and reliable record of ice cover in the region at these critical times of the year, when sea ice would be retreating (outward journey) and developing (return journey) in response to the conditions at the time.
Conclusions
It is here proposed that the logbooks of the HBC ships offer a unique opportunity to extend scientific knowledge of the climate of the far North Atlantic into the pre-instrumental period. Particular advantages are found in this source, as follows:
the data provide a daily, even sub-daily, scale of temporal resolution;
the logbooks span 130 years and embrace important periods in the recent climatic history of the planet;
the information, although often non-instrumental in nature provides nevertheless key wind data with which circulation patterns can be reconstructed;
the information is recorded using a consistent vocabulary with observations made to consistent standards, thereby avoiding problems of lack of consistency as one moves from one document to another;
the data are fixed by date/time and location;
the logbook source is unique for the period and for the region.
Hitherto these documents have, surprisingly, been often overlooked. Whilst notable endeavours have been made to use data from the Hudson Bay itself (Catchpole and Ball Reference Catchpole and Ball1981; Wilson Reference Wilson1982, Reference Wilson1983a, Reference Wilson1983b, Reference Wilson1985, Reference Wilson1988, Reference Wilson and Harington1992; Ball Reference Ball1983, Reference Ball, Bradley and Jones1992; Catchpole and Faurer Reference Catchpole and Faurer1983, Reference Catchpole and Faurer1985; Hopper Reference Hopper1985; Catchpole and Hanuta Reference Catchpole and Hanuta1989), this is the first attempt to abstract and eventually to analyse the oceanic (North Atlantic) weather data from this source. However it was imperative to ensure the integrity of the source material.
Every effort needs to be made to ensure that, as far as possible, the data used are reliable and free from errors or ambiguities. However, and as other researchers have discovered, this has proved no easy task; the data to be found in logbooks are not immediately applicable to scientific studies. Most of them are non-instrumental and qualitative in nature, and particular attention has to be given to the meaning, interpretation and standardisation of the terms and phrases that describe wind and weather and form the foundation of the data set. But such use of narrative accounts is, however, by no means unprecedented or confined to ships’ logbooks, and Brázdil and others (Reference Brázdil, Pfister, Wanner, von Storch and Luterbacher2005) have drawn attention to the rapidly developing and profitable use many forms of documentary evidence in historical climatology.
Acknowledgements
We wish to thank Toby Benham (Scott Polar Research Institute) for his help in creating the map (figure 3). Our thanks go also to the two anonymous reviewers for their helpful comments and guidance.