INTRODUCTION
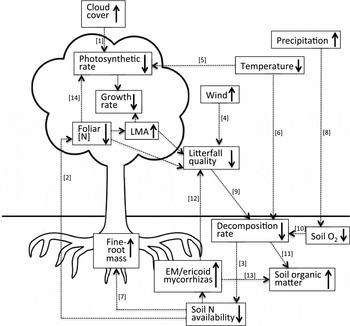
Ecologists have long noted the distinctive structural features of tropical montane forests (TMF), and their relationship with forest productivity, climate and soil characteristics (Fahey et al. in press, Grubb & Whitmore Reference GRUBB and WHITMORE1966, Richards Reference RICHARDS1952, Shreve Reference SHREVE1914). In brief, when contrasted with lowland forests, montane forests typically have lower canopy height and above-ground biomass (Gould et al. Reference GOULD, GONZÁLEZ and CARRERO RIVERA2006), increased fine-root production, reduced radial growth rates and canopy productivity (Girardin et al. Reference GIRARDIN, MALHI, ARAGAO, MAMANI, HUARACA HUASCO, DURAND, FEELEY, RAPP, SILVA-ESPEJO, SILMAN, SALINAS and WHITTAKER2010), and leaves that have both higher mass per unit area, and lower nitrogen concentration (Figure 1 and references therein). These changes in forest physiognomy and functional traits are also accompanied by changes in soil nutrient pools and fluxes. The transition to montane forest is associated with an increase in soil organic carbon (C) and total nitrogen (N) content (Girardin et al. Reference GIRARDIN, MALHI, ARAGAO, MAMANI, HUARACA HUASCO, DURAND, FEELEY, RAPP, SILVA-ESPEJO, SILMAN, SALINAS and WHITTAKER2010, Kitayama & Aiba Reference KITAYAMA and AIBA2002, Ping et al. Reference PING, MICHAELSON, STILES and GONZÁLEZ2013, Raich et al. Reference RAICH, RUSSELL, KITAYAMA, PARTON and VITOUSEK2006), and a decrease in rates of organic matter decomposition (Bruijnzeel et al. Reference BRUIJNZEEL, WATERLOO, PROCTOR, KUITERS and KOTTERINK1993, Salinas et al. Reference SALINAS, MALHI, MEIR, SILMAN, ROMAN CUESTA, HUAMAN, SALINAS, HUAMAN, MAMANI and FARFAN2011, Vitousek et al. Reference VITOUSEK, TURNER, PARTON and SANFORD1994), net nitrogen mineralization (Kitayama & Aiba Reference KITAYAMA and AIBA2002, Marrs et al. Reference MARRS, PROCTOR, HEANEY and MOUNTFORD1988, Raich et al. Reference RAICH, RUSSELL and VITOUSEK1997, but see Silver et al. Reference SILVER, THOMPSON, HERMAN, FIRESTONE, Bruijnzeel, Scatena and Hamilton2010), and soil C:N values (Ping et al. Reference PING, MICHAELSON, STILES and GONZÁLEZ2013).
Pathways connecting proposed drivers of nutrient limitation in tropical montane forests (cloud cover, precipitation, temperature and wind) to nutrient cycling (principally N), plant growth and allocation. Solid arrows within text boxes indicate the direction of the response relative to lowland tropical forest. Key citations are provided for linkages between responses. In most cases, literature is available from montane forests, however relationships between mycorrhizal type, litter quality and soil organic matter are inferred from temperate forests and have not been tested in a tropical montane setting. References: [1] Bruijnzeel & Veneklaas (Reference BRUIJNZEEL and VENEKLAAS1998), [2] Tanner et al. (Reference TANNER, VITOUSEK and CUEVAS1998), [3] Grubb (Reference GRUBB1977), [4] Zimmerman et al. (Reference ZIMMERMAN, PULLIAM, LODGE, QUIÑONES-ORFILA, FETCHER, GUZMÁN-GRAJALES, PARROTTA, ASBURY, WALKER and WAIDE1995), [5] Berry & Björkman (Reference BERRY and BJÖRKMAN1980), [6] Raich et al. (Reference RAICH, RUSSELL and VITOUSEK1997), [7] Hertel & Leuschner (2007), [8] Silver et al. (Reference SILVER, LUGO and KELLER1999), [9] Vitousek (Reference VITOUSEK1984), [10] Schuur (Reference SCHUUR2001), [11] Marrs et al. (Reference MARRS, PROCTOR, HEANEY and MOUNTFORD1988), [12] Read & Perez-Moreno (Reference READ and PEREZ-MORENO2003), [13] Averill et al. (Reference AVERILL, TURNER and FINZI2014), [14] Evans (Reference EVANS1989).

In the development of these features of TMF, plant and soil processes are intertwined, making it difficult to discern cause from effect. Here we make the assumption that nutrient availability affects TMF structure and function and vice versa (Tanner et al. Reference TANNER, VITOUSEK and CUEVAS1998). Rather than focus on the well-described generalities of TMF reviewed by Benner et al. (Reference BENNER, VITOUSEK, OSTERTAG, Bruijnzeel, Scatena and Hamilton2010), in this review we highlight and probe the factors that lead to variation in the nutrient relations of TMF, and suggest that the range of environmental conditions under which TMF occurs is more diverse than previously acknowledged. TMF forests at similar altitudes can vary widely in topography, precipitation, cloud cover, disturbance regime, soil fertility, species composition and plant functional traits, all of which influence plant-soil feedbacks (Figure 2). In this review we address key questions about how nutrients influence TMF by asking: (1) how precipitation and disturbance regime influence forest nutrient cycling and TMF structure and productivity; (2) how nutrient limitation, both directly and indirectly, drives community and ecosystem-level characteristics of TMF; and (3) how global change in climate and anthropogenic N inputs will affect TMF. Our analysis shows that TMF are diverse – in geography and environment – and that for future research a broad definition is required to encompass the large variability in the plant-soil characteristics of TMF.
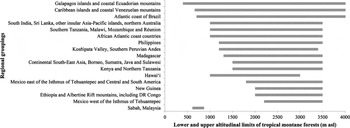
Regional groupings of tropical montane cloud forest and associated lower and upper altitudinal limits of the cloud belt (modified after Scatena Reference SCATENA, Bruijnzeel, Scatena and Hamilton2010).

HOW DO PRECIPITATION AND DISTURBANCE REGIME INFLUENCE FOREST STRUCTURE, PRODUCTIVITY AND NUTRIENT AVAILABILITY?
Although many of the defining characteristics of TMF are related to nutrient limitation, not all of these elements are present in all forests, and the relative importance of different factors may change due to: (1) regional variation in climate, substrate and topography; (2) natural and anthropogenic disturbance regimes; (3) species effects; and (4) the synergetic interactions among these factors. For example, large geographic differences in the altitudinal limits of TMF are attributable to regional climate variation (Figure 2). However within an elevation zone, forest composition and physiognomy are strongly influenced by local environmental conditions. Precipitation regime can vary dramatically and often at short spatial scales when contrasting windward and leeward slopes of mountains (Haber Reference HABER, Nadkarni and Wheelwright2000, Shreve Reference SHREVE1914, Weaver Reference WEAVER2010). Likewise, aspect may be critical in determining exposure to disturbance from prevailing winds or hurricanes (Bellingham Reference BELLINGHAM1991, Lawton & Putz Reference LAWTON and PUTZ1988, Weaver Reference WEAVER1989).
An understanding of the spatial and temporal extent of disturbances is critical to predicting the distributions of species, communities and ecosystem characteristics in many TMF (Waide & Willig Reference WAIDE, WILLIG, Brokaw, Crowl, Lugo, McDowell, Scatena, Waide and Willig2012, Willig & Walker Reference WILLIG, WALKER and Walker1999). For instance, landslides have a large impact on soil properties and plant communities (Dalling & Tanner Reference DALLING and TANNER1995, Restrepo et al. Reference RESTREPO, WALKER, SHIELS, BUSSMAN, CLAESSENS, FISCH, LOZANO, NEGI, PAOLINI, POVEDA, RAMOS-SCHARRÓN, RICHTER and VELÁZQUEZ2009). By removing large amounts of organic carbon, landslides alter potential for long-term carbon sequestration (Ramos Scharron et al. Reference RAMOS SCHARRON, CASTELLANOS and RESTREPO2012). In addition, landslides reset successional trajectories. In an example in Hawai‘i, landslides differed greatly in species composition based on age and soil nutrient availability, and landslides also served as conduits for the introduction of non-native species (Restrepo & Vitousek Reference RESTREPO and VITOUSEK2001). Similarly Shiels & Walker (Reference SHIELS and WALKER2013) found that numerous physical gradients resulting from landslides, including soil nutrients, slope, age and distance to edges and the base of a landslide, strongly influence colonization, growth and survival of vegetation in the Luquillo Mountains. At large spatial scales, landslides can be a major type of land-cover, on the same order of magnitude as deforestation (Restrepo & Alvarez Reference RESTREPO and ALVAREZ2006). Furthermore, landslides are more frequent in some regions than others, depending on topography, frequency and intensity of rainfall events (Larsen & Simon Reference LARSEN and SIMON1993), and tectonic activity (Stern Reference STERN, Churchill, Balslev, Forero and Luteyn1995), and may differ in slope position depending on the nature of the triggering event (Meunier et al. Reference MEUNIER, HOVIUS and HAINES2008). All of these factors feed back to influence soil nutrient availability in TMF.
Many TMF are also in volcanically active regions resulting in landscape and regional variation in substrate age, and therefore in nutrient stocks and stoichiometric ratios that impact productivity (Crews et al. Reference CREWS, KITAYAMA, FOWNES, RILEY, HERBERT, MUELLER-DOMBOIS and VITOUSEK1995). Although cloud-affected forest is unlikely to burn, past or present fire regimes may at least affect the edges of, or set limits to, the distribution of TMF (Martin, P.H. et al. Reference MARTIN, SHERMAN and FAHEY2007). Finally disturbance provides opportunities for colonization by invasive plant species, particularly for TMF on oceanic islands (Richardson & Rejmánek Reference RICHARDSON and REJMÁNEK2011). In turn, colonization by invasives may be sensitive to soil fertility and substrate characteristics (Ostertag & Verville Reference OSTERTAG and VERVILLE2002, Tweiten et al. Reference TWEITEN, HOTCHKISS, VITOUSEK, KELLNER, CHADWICK and ASNER2014), or may generate feedback effects on succession and soil nutrient availability (Potgieter et al. Reference POTGIETER, WILSON, STRASBERG and RICHARDSON2014, Vitousek & Walker Reference VITOUSEK and WALKER1989).
IS NITROGEN THE PRIMARY LIMITING ELEMENT TO TMF PRODUCTIVITY?
There is considerable evidence to support the observation that nitrogen limitation increases with altitude on tropical mountains (Ping et al. Reference PING, MICHAELSON, STILES and GONZÁLEZ2013, Tanner et al. Reference TANNER, VITOUSEK and CUEVAS1998, Vitousek Reference VITOUSEK1984). Plant-available nitrogen is scarce in montane relative to lowland tropical soils because increases in soil moisture and decreases in temperature slow microbial mineralization of organically bound nitrogen, which in turn decreases the deposition and substrate quality of nitrogen inputs through canopy litterfall (Figure 1). Consequently, nitrogen fertilization has been found to stimulate production of litterfall (Adamek et al. Reference ADAMEK, CORRE and HÖLSCHER2009, Vitousek et al. Reference VITOUSEK, WALKER, WHITEAKER and MATSON1993, Walker et al. Reference WALKER, ZIMMERMAN and LODGE1996, Zimmerman et al. Reference ZIMMERMAN, PULLIAM, LODGE, QUIÑONES-ORFILA, FETCHER, GUZMÁN-GRAJALES, PARROTTA, ASBURY, WALKER and WAIDE1995), and tree diameter growth rates (Fisher et al. Reference FISHER, MAHLI, TORRES, METCALFE, VAN DE WEG, MEIR, SILVA-ESPEJO and HUARACA HUASCO2013, Raich et al. Reference RAICH, RUSSELL, CREWS, FARRINGTON and VITOUSEK1996, Tanner et al. Reference TANNER, KAPOS, FRESKOS, HEALEY and THEOBALD1990, Vitousek & Farrington Reference VITOUSEK and FARRINGTON1997, Vitousek et al. Reference VITOUSEK, WALKER, WHITEAKER and MATSON1993, Walker et al. Reference WALKER, ZIMMERMAN and LODGE1996) in a variety of TMF sites. Responses to N addition along with observed declines in foliar N concentrations and N:P along altitudinal transects (Fisher et al. Reference FISHER, MAHLI, TORRES, METCALFE, VAN DE WEG, MEIR, SILVA-ESPEJO and HUARACA HUASCO2013) bolster the notion that nitrogen is the primary limiting element in high-elevation tropical forests (Tanner et al. Reference TANNER, VITOUSEK and CUEVAS1998).
However, there is growing evidence that other essential elements, notably P, play an important role in co-limiting productivity in many tropical montane forests. In a comparison of soil and foliar chemistry along two Hawaiian altitudinal transects of contrasting geological age, both soil and foliar concentrations of P and K (per unit dry mass) were significantly lower at the highest-elevation site relative to the lowest-elevation site (Vitousek et al. Reference VITOUSEK, MATSON and TURNER1988), indicating that the same processes that slow nitrogen cycling on tropical mountains may also decrease the bioavailability of rock-derived nutrients. Evidence of co-limitation has been shown in a number of N and P fertilization experiments. Factorial addition of N+P at forest 2000 m asl in Ecuador (Homeier et al. Reference HOMEIER, HERTEL, CAMENZIND, CUMBICUS, MARAUN, MARTINSON, POMA, RILIG, SANDMANN, SCHEU, VELDKAMP, WILCKE, WULLAERT and LEUSCHNER2012) and 2500 m asl in Venezuela (Tanner et al. Reference TANNER, KAPOS and FRANCO1992) found that N and P, when added together, stimulated litterfall relative to control plots, while neither N nor P had a significant effect separately. Diameter growth responded to either N or P addition at 1500 m asl in Jamaica (Tanner et al. Reference TANNER, KAPOS, FRESKOS, HEALEY and THEOBALD1990; no N+P treatment) and to N+P addition in Venezuela (Tanner et al. Reference TANNER, KAPOS and FRANCO1992; N and P not added separately). In contrast, Fisher et al. (Reference FISHER, MAHLI, TORRES, METCALFE, VAN DE WEG, MEIR, SILVA-ESPEJO and HUARACA HUASCO2013) found that solely N limited diameter growth in montane forests at 1500 and 3000 m asl in the Peruvian Andes. However, in the Fisher et al. (Reference FISHER, MAHLI, TORRES, METCALFE, VAN DE WEG, MEIR, SILVA-ESPEJO and HUARACA HUASCO2013) study the absence of buffer strips between fertilization plots may have resulted in transfer of added nutrients across treatments.
Variation in responses to multiple nutrient additions in TMF may be explained in part by differences in geological age and ecosystem development among mountain ranges. Along a geological age gradient in Hawai‘i located at ~1200 m asl, the identity of limiting elements varied with substrate age. N alone limited production at the 300-y-old site, N+P limited production at the 20000-y-old site, and P solely limited productivity at the 4100000-y-old site (Vitousek & Farrington Reference VITOUSEK and FARRINGTON1997). Additionally, the response of forests to multiple nutrient additions may depend on the strength of various non-mutually exclusive co-limiting scenarios. First, different nutrients may limit contrasting components of productivity. This may be due to differences in nutrient requirements among size classes or plant tissues. For instance, at the Gigante Fertilization Experiment in lowland Panama, fine litter (produced mostly by lianas and canopy trees) responded to P addition, diameter growth of pole-sized trees increased only when N and K are added together (Wright et al. Reference WRIGHT, YAVITT, WURZBURGER, TURNER, TANNER, SAYER, SANTIAGO, KASPARI, HEDIN, HARMS, GARCIA and CORRE2011), and fine-root biomass responded to N, P and K together (Wurzburger & Wright Reference WURZBURGER and WRIGHT2015). Second, uptake of one element may depend heavily on the availability of another. N mineralization may be strongly P-limited (Kitayama et al. Reference KITAYAMA, AIBA, TAKYU, MAJALAP and WAGAI2004), and P uptake may require N-rich phosphatase enzymes (Treseder & Vitousek Reference TRESEDER and VITOUSEK2001).
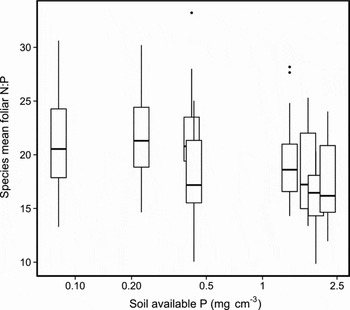
Finally, limitation by multiple nutrients may occur because tree species differ in their nutrient uptake strategies or nutrient economies, and are thus limited by contrasting resources. This scenario may be especially important in lower montane forests where functional groups from various mycorrhizal or elevation guilds overlap. In both lowland and montane forests, tree species distributions show associations with many different co-varying soil nutrients (John et al. Reference JOHN, DALLING, HARMS, YAVITT, STALLARD, MIRABELLO, HUBBELL, VALENCIA, NAVARRETE, VALLEJO and FOSTER2007), while stoichiometric ratios of tissue nutrient concentrations are also highly variable (Figure 3). In contrast, fertilization experiments have concluded that forest stands as a whole are N, P, or N and P co-limited in part because small plot size and low plot replication used in stand fertilizations provide insufficient statistical power to detect individual species responses. Recently however, Homeier et al. (Reference HOMEIER, HERTEL, CAMENZIND, CUMBICUS, MARAUN, MARTINSON, POMA, RILIG, SANDMANN, SCHEU, VELDKAMP, WILCKE, WULLAERT and LEUSCHNER2012) have highlighted contrasting species responses to N and P fertilization. At their site at 2000 m asl in southern Ecuador, only two of the four most abundant species showed positive radial growth responses to N or N+P fertilization. A similar pattern has been observed in an N-fertilization experiment at 1000 m asl at Fortuna in western Panama. In this case the dominant tree species (Oreomunnea mexicana), which accounts for about 50% of basal area at the site, has shown no effect of 6 y of N fertilization on either leaf litterfall or radial growth, while some subordinate species have shown strong positive responses to fertilization (Adamek et al. Reference ADAMEK, CORRE and HÖLSCHER2009).
Boxplots representing the distribution of species mean foliar N:P ratios for the 15–20 most abundant species in eight 1-ha plots at Fortuna Forest Reserve in western Panama (800–1300 m asl; Andersen et al. Reference ANDERSEN, TURNER and DALLING2010). The box hinges represent interquartile range (IQR) of the distribution, and the bold line within the box is the median value. The whiskers extend to the highest value within 1.5*IQR. Plots span a 10-fold range in soil P and N concentrations. Plots are ordered here by increasing soil resin P availability in the top 10 cm of soil.

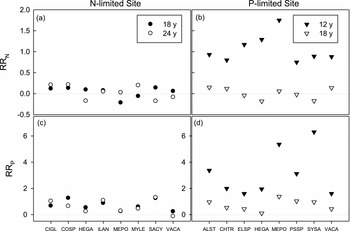
Understanding long-term effects of nutrient addition is important because multi-decadal nitrogen fertilization experiments in the temperate zone have observed key changes in biogeochemical cycles, such as increased nitrification rates, after 8–10 y of fertilization (Magill et al. Reference MAGILL, ABER, HENDRICKS, BOWDEN, MELILLO and STEUDLER1997). Two long-term fertilization experiments show that the short- vs. long-term consequences of fertilization can differ, depending on the variable of interest. At the long substrate age gradient in Hawai‘i, an N-limited site has been fertilized regularly since 1985, and a P-limited site with P since 1991. Primary productivity and resource-use efficiencies measured 6–13 y after initial fertilization showed that litterfall, wood increment growth and above-ground net primary productivity were similar to those obtained within 2 y of fertilization suggesting that short-term effects are maintained over time (Harrington et al. Reference HARRINGTON, FOWNES and VITOUSEK2001). However, the foliar N and P in fertilized plots declined over time, indicating that the nutrient addition may have muted vegetation responses, with the forests potentially becoming less nutrient-limited (Figure 4). Note, however, that responses to nutrient addition and the time scales of fertilization responses vary for N and P, and by species (Figure 4).
Long-term fertilization effects on foliar N and P concentrations at two sites in Hawaiian TMF for 13 species (Ostertag, unpubl. data). Response ratios (RR) for N after N fertilization or for P after P fertilization are shown (RR = ln (fertilized plot average/control plot average), with values > 0 signifying a positive fertilization response). Note the different scales between RRN and RRP. Plots were sampled at 12, 18 or 24 y after the initial fertilization event, and have been receiving fertilization at regular intervals (initially annually, then every few years). Species are trees (CHTR: Cheirodendron trigynum; MEPO: Metrosideros polymorpha; PSSP: Psychotria sp.; SYSA: Syzygium sandwicensis; COSP: Coprosma spp.; ILAN: Ilex anomala; MYLE: Myrsine lessertiana), shrub (VACA: Vaccinium calycinum), ferns (ELSP: Elaphoglossum sp., SACY: Sadleria cyatheoides, CIGL); monocot (HEGA: Hedychium gardnerianum); and climber (ALST: Alyxia stellata).

The other long-term fertilization experiment in TMF is in lower- (350–500 m asl) and upper-elevation forests (1050 m asl) in Puerto Rico, where plots have been fertilized with macro-and micronutrients every 3 mo since the passage of Hurricane Hugo in 1989 (Waide et al. Reference WAIDE, ZIMMERMAN and SCATENA1998, Walker et al. Reference WALKER, ZIMMERMAN and LODGE1996, Zimmerman et al. Reference ZIMMERMAN, PULLIAM, LODGE, QUIÑONES-ORFILA, FETCHER, GUZMÁN-GRAJALES, PARROTTA, ASBURY, WALKER and WAIDE1995). Fertilization stimulated leaf litter production in both forests, but the rate of recovery to pre-hurricane levels was greater at 350–500 m asl (20 mo after treatment) than those at 1050 m asl (38 mo; Walker et al. Reference WALKER, ZIMMERMAN and LODGE1996). Litterfall rose steadily after fertilization and by 2–3 y appeared to be at its maximum (Walker et al. Reference WALKER, ZIMMERMAN and LODGE1996), with some decreases in magnitude seen a decade later (Yang et al. Reference YANG, WARREN and ZOU2007). These long-term effects may extend to reproduction as well; bromeliads from the fertilized plots had more flowers per inflorescence and more seeds per fruit per plant, and flowered more frequently (Lasso & Ackerman Reference LASSO and ACKERMAN2013).
At present, our understanding of the relative importance and nature of co-limitation is hampered by a lack of long-term nutrient addition experiments that include a variety of combinations of limiting elements. Furthermore, no study to our knowledge has directly evaluated limitation attributable to specific soil cations, despite the observation that potassium co-limits woody growth increment in a lowland Panamanian forest (Wright et al. Reference WRIGHT, YAVITT, WURZBURGER, TURNER, TANNER, SAYER, SANTIAGO, KASPARI, HEDIN, HARMS, GARCIA and CORRE2011). Multi-nutrient fertilization experiments with longer duration, and on a variety of substrates, are necessary for predicting effects of aspects of global change, especially nitrogen deposition. This may have a large effect on montane forest carbon storage and species composition.
HOW DOES NUTRIENT LIMITATION IMPACT SOIL CARBON POOLS VIA EFFECTS ON DECOMPOSERS?
Effects of nutrient limitation on trophic levels other than plants remain poorly explored, although recent studies have examined the effects of nutrient addition on decomposer communities. Heterotrophic activity is likely to be sensitive to N, both because microbial decomposers are sensitive to changes in the C:N of organic material even in N-rich tropical forests (Cusack et al. Reference CUSACK, CHOU, LIU, HARMON and SILVER2009, Hobbie & Vitousek, Reference HOBBIE and VITOUSEK2000), and because of potential shifts in microbial community composition with added N (Wallenstein et al. Reference WALLENSTEIN, MCNULTY, FERNANDEZ, BOGGS and SCHLESINGER2006). In the Hawaiian Long Substrate Age Gradient (LSAG) chronosequence, N addition did not affect microbial biomass but did influence microbial community composition (Balser Reference BALSER2001). Similarly, soil fertility influenced microbial community structure in a study that examined the interaction between fertilization and species group (native vs. invasive) (Kao-Kniffin & Balser Reference KAO-KNIFFIN and BALSER2008). Yet, in a reciprocal transplant experiment in the laboratory, bacterial community composition explained significantly less variation in soil respiration rates than litter quality (Cleveland et al. Reference CLEVELAND, REED, KELLER, NEMERGUT, O'NEILL, OSTERTAG and VITOUSEK2014). In an N-fertilization experiment of two N-rich forests in Puerto Rico, Cusack et al. (Reference CUSACK, TORN, MCDOWELL and SILVER2010) found that N addition led to faster decomposition of the ‘active’ (relatively labile) C pool, while slowing the turnover of slowly cycling C pools. These changes in soil C corresponded to the responses of two groups of microbial extracellular enzymes. Smaller active C pools corresponded to increased hydrolytic enzyme activity, while longer turnover times of the slowly cycling C pool corresponded to reduced activity of oxidative enzymes, which degrade more complex C compounds (Cusack et al. Reference CUSACK, TORN, MCDOWELL and SILVER2010). Cusack et al. (Reference CUSACK, SILVER, TORN, BURTON and FIRESTONE2011) also noted that increased bacterial abundance with N addition in a lower-elevation forest corresponded to losses of the most labile C compounds from soil organic matter (SOM), whereas increased fungal abundance with N addition in an upper-elevation forest corresponded to losses of hydrophobic aliphatic compounds from SOM. Thus, C cycling may change in response to N deposition in tropical forests, driven by complex interactions among microbial community composition, enzymatic capability, plant chemistry and soil C chemistry (Cleveland et al. Reference CLEVELAND, REED, KELLER, NEMERGUT, O'NEILL, OSTERTAG and VITOUSEK2014, Cusack et al. Reference CUSACK, SILVER, TORN, BURTON and FIRESTONE2011).
Only a few studies have examined decomposers other than microbes. González et al. (Reference GONZÁLEZ, LI, ZOU, Brown and Fragoso2007) found no effect of fertilization (N, P, K and micronutrients) on the abundance and biomass of earthworms in the upper-elevation TMF in Puerto Rico. In the lower-elevation TMF however, the density and biomass of total and endogeic earthworms were significantly greater in the control than in the fertilization treatments. Across natural gradients in soil nutrient availability in montane forest on Mt. Kinabalu, Borneo, Hasegawa et al. (Reference HASEGAWA, ITO and KITAYAMA2013) found that the abundance of oribatid mites, important consumers of plant litter and fungi, correlated positively with the concentration of soil organic phosphorus. In Jamaican montane forest, soil nematode densities were higher in more nutrient poor ‘mor’ soils with high C:P and C:N than adjacent younger ‘mull’ soils (Wardle et al. Reference WARDLE, BELLINGHAM, KARDOL, GIESLER and TANNER2015). Finally, Kaspari et al. (Reference KASPARI, CLAY, DONOSO and YANOVIAK2014) hypothesize that sodium is limiting to inland microbial and animal decomposers, but not to primary producers. In lowland forest sodium addition increased cellulose and wood decomposition rates significantly (Kaspari et al. Reference KASPARI, CLAY, DONOSO and YANOVIAK2014); however, this effect was mediated by termites, which are less abundant in montane forests (Palin et al. Reference PALIN, EGGLETON, MALHI, GIRARDIN, ROZAS-DAVILA and PARR2011). More research on how nutrients influence microfauna and macrofauna and vice versa are clearly needed, as work has only been done in a few geographic locations.
HOW DOES NUTRIENT LIMITATION AFFECT THE DISTRIBUTION OF PLANT FUNCTIONAL TRAITS?
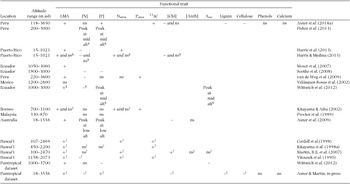
Many plant functional traits that represent the TMF syndrome in Figure 1 are viewed as adaptations to low nutrient conditions. A number of studies have examined leaf (Asanok et al. Reference ASANOK, MAROD, DUENGKAE, PRANMONGKOL, KUROKAWA, AIBA, KATABUCH and NAKASHIZUKA2013, Grubb Reference GRUBB1977, Long et al. Reference LONG, ZANG and DING2011, Romero et al. Reference ROMERO, PUTZ and KITAJIMA2006, Seyoum et al. Reference SEYOUM, FETENE, STROBL and BECK2012, Takahashi & Mikami Reference TAKAHASHI and MIKAMI2006, van de Weg et al. Reference VAN DE WEG, MEIR, GRACE and RAMOS2012, Williams-Linera Reference WILLIAMS-LINERA2000) or wood (González & Luce Reference GONZÁLEZ and LUCE2013, Sungpalee et al. Reference SUNGPALEE, ITOH, KANZAKI, SRI-NGERNYUANG, NOGUCHI, MIZUNO, TEEJUNTUK, HARA, CHAI-UDOM, OHKUBO, SAHUNALU, DHANMMANONDA, NANAMI, YAMAKURA and SORN-NGAI2009) traits in TMF species (with a notable absence of studies of TMF epiphytes, but see Gotsch et al. Reference GOTSCH, NADKARNI, DARBY, GLUNK, DIX, DAVIDSON and DAWSON2015). However, fewer studies have examined functional traits across large altitudinal gradients (Table 1). An Amazon-to-Andes altitudinal gradient in Peru is the most comprehensive functional-trait study to date; it examined leaf chemical characteristics of 2420 species of canopy tree from 19 sites along a 3500-m altitudinal range. When data were normalized by comparing to the per cent deviation from the gradient mean, there were significant relationships with altitude: cellulose, lignin and chlorophyll concentrations were lowest at high altitudes, while soluble carbon, leaf mass per area (LMA), P concentration and 13δC values increased with altitude (Asner et al. Reference ASNER, MARTIN, TUPAYACHI, ANDERSON, SINCA, CARRANZA-JIMENEZ and MARTINEZ2014a). Another study in Peru across eight field sites ranging from 220 to 3600 m asl found that LMA was positively correlated with altitude and that N concentration was negatively correlated, with no significant relationship for P concentrations (van de Weg et al. Reference VAN DE WEG, MEIR, GRACE and ATKIN2009). These results partially support a meta-analysis of global altitudinal gradients, which noted positive correlations between LMA and N when expressed on an area basis (Narea) (Read et al. Reference READ, MOORHEAD, SWENSON, BAILEY and SANDERS2014). However, altitudinal trends are not always consistent in direction or statistical significance, and many traits have not been quantified along altitudinal gradients (Table 1). Results vary depending on soil fertility (Asner & Martin, in press) and species, so that individual species' studies should be considered separately from the community-level studies. Conclusions about the effects of elevation on functional traits must consider the length of the gradient, and the r2 values, which in general are < 50%, except for leaf mass per area (Asner & Martin, in press). In addition, there are other factors besides climate and nutrient availability influencing plant traits. In Puerto Rico, herbivory and frequency of disturbance are factors that influence nutrient allocation trade-offs (Harris et al. Reference HARRIS, HALL and LUGO2013).
Compilation of studies of altitudinal gradients in tropical forests that have measured plant functional traits. Only studies that measured traits of at least three altitudes were included. Values in cells either demonstrate a positive correlation between the trait and altitude (+), a negative correlation (−), or a non-significant correlation (ns). Blank cells indicate no available data. Traits abbreviations are: LMA, leaf mass per area; [N], leaf N concentration, also called Nmass in the literature; [P], leaf P concentration or Pmass; Narea, leaf N on an area basis; Parea, leaf P on an area basis; 13δC, integrated water-use efficiency; [Chl], chlorophyll concentration; [Anth], anthocyanin concentration; and Asat (light-saturated photosynthesis at ambient temperature and carbon dioxide). Other traits that deserve more study but are not included here because they were only measured in a single study include: soluble carbon concentrations (Asner et al. Reference ASNER, MARTIN, TUPAYACHI, ANDERSON, SINCA, CARRANZA-JIMENEZ and MARTINEZ2014a), 15δN (Cardelus & Mack Reference CARDELÚS and MACK2010), leaf lifespan (Moser et al. Reference MOSER, HERTEL and LEUSCHNER2007), leaf density (van de Weg et al. Reference VAN DE WEG, MEIR, GRACE and ATKIN2009), photosynthetic nitrogen-use efficiency (Cordell et al. Reference CORDELL, GOLDSTEIN, MUELLER-DOMBOIS, WEBB and VITOUSEK1998), C:N (Soethe et al. Reference SOETHE, LEHMANN and ENGELS2008), apparent quantum yield, leaf dark respiration, leaf conductance (Wittwich et al. Reference WITTWICH, HORNA, HOMEIER and LEUSCHNER2012), carotenoid, electron transport rate, effective quantum yield, and spectral characteristics (Martin, R.E. et al. Reference MARTIN, ASNER and SACK2007), and leaf shape, margins, configuration and anatomy (Velázquez-Rosas et al. Reference VELÁZQUEZ-ROSAS, MEAVE and VÁSQUEZ-SANTANA2002).

† Single species study, ‡Results vary by soil type, §Results vary by species.
Foliar functional traits are likely have direct feedbacks on forest structure. In the Amazon-to-Andes transect, the clustering of canopy leaves, canopy height and measures of forest energy use (fractional cover of photosynthetic vegetation and normalized difference vegetation indices (NDVI)) all changed in predictable ways with increasing altitude (Asner et al. Reference ASNER, ANDERSON, MARTIN, KNAPP, TUPAYACHI, SINCA and MALHI2014b). Similarly, along a gradient spanning lower (1050 m asl) to upper (3060 m asl) montane forest in Ecuador, leaf area index (LAI) and leaf-fall production (Moser et al. Reference MOSER, HERTEL and LEUSCHNER2007) were negatively correlated with altitude (Leuschner et al. Reference LEUSCHNER, MOSER, BERTSCH, RODERSTEIN and HERTEL2007). In Borneo, leaf biomass, above-ground biomass, wood biomass, stem density and LAI were all variables that were correlated with altitude, but the significance of the effects varied by soil type (Kitayama & Aiba Reference KITAYAMA and AIBA2002). More research is needed on linking plant functional traits to nutrient availability in TMF, and whether individual species effects can better explain the variation in nutrient cycling seen in TMF.
HOW DO INDIVIDUALISTIC SPECIES RESPONSES TO NUTRIENT AVAILABILITY CONTRIBUTE TO COMPOSITIONAL VARIATION IN TMF?
Low nutrient availability or soil anoxia associated with high-elevation forests is likely to select for species with conservative nutrient-use requirements. Competition with faster-growing lower-elevation species, with less conservative traits, may then constrain the realized niche of upper montane forest species. If so, infertile or periodically anoxic soils that occur at lower altitudes might be expected to harbour species otherwise typical of higher-elevation forest. As yet, information on the altitudinal distributions of most tropical trees is insufficient to test this hypothesis. Nonetheless, several authors have noted how soil variation can impact species sorting along altitudinal gradients. On Mt. Kinabalu ultrabasic-derived soils are deficient in phosphorus and enriched in magnesium relative to soils that develop on non-ultrabasic substrates (Aiba & Kitayama Reference AIBA and KITAYAMA1999). These differences are associated with an apparent compression of altitudinal zonation patterns on ultrabasic rocks. Forests that developed on non-ultrabasics at higher elevation were similar in diameter-height relationships and in leaf area and supported some of the same species, genera and families as occurred at lower elevation on ultrabasics (Aiba & Kitayama Reference AIBA and KITAYAMA1999). Jones et al. (Reference JONES, SZYSKA and KESSLER2011) explicitly tested whether the local microhabitat distribution of ferns was related to their broader altitudinal ranges in the Bolivian Andes. They found that at the local scale, soils were important in explaining floristic variation, and that species associated with more acidic soils had higher minima and maxima in altitudinal ranges than those from less acidic microsites. Conversely, resource pulses that increase light or nutrient availability in montane forests may facilitate the upward shift of lower-elevation species.
Topographic variables, which are associated with nutrient availability, may also influence species’ distribution (Werner & Homeier Reference WERNER and HOMEIER2015). In a Peruvian TMF, at least a third of woody species were associated either positively or negatively to habitats defined by topographic variables (altitude, slope, curvature of the terrain) (Ledo et al. Reference LEDO, BURSLEM, CONDES and MONTES2013), with similar observations in several other Andean forests (Lippok et al. Reference LIPPOK, BECK, RENISON, HENSEN, APAZA and SCHLEUNING2014, Svenning et al. Reference SVENNING, HARLEV, SØRENSEN and BALSLEV2009). On the lower slopes of Mt. Kinabalu in Sabah, Borneo, Takyu et al. (Reference TAKYU, AIBA and KITAYAMA2002) characterized plant communities occurring on topographic gradients with contrasting parent material. They found that differences in N and P availability contributed to the strength of topographic variation in forest composition and stand structure, with a particularly strong impact on the occurrence of conifers. In Jamaican montane forests, plant communities differ on ‘mor’ ridge and adjacent slopes in accordance with differences in soil depth and pH (Tanner Reference TANNER1977).
At a smaller scale, species and individuals may be sorted by soil fertility and their plant functional traits related to nutrient acquisition and use. To date, most studies of niche partitioning have occurred in lowland forests, but the number of examples in TMF is growing. In western Panama, habitat affinities of the understorey palm community were examined at paired watershed sites. The 25 palm species were non-randomly distributed, forming associations by soil type, which were influenced by nutrient availability and amount of organic matter accumulation (Andersen et al. Reference ANDERSEN, TURNER and DALLING2010). Among soil variables, inorganic N was the best predictor of a given species’ presence (Andersen et al. Reference ANDERSEN, TURNER and DALLING2010), while a complementary experimental study with eight palm species demonstrated no preference for the form of N. Thus habitat partitioning at this site is likely due to soil differences in absolute amounts of mineral and organic N (Andersen & Turner Reference ANDERSEN and TURNER2013).
Despite these habitat associations, some of these same studies demonstrate that environmental filtering is not the only factor likely to determine the distribution of species. Andersen et al. (Reference ANDERSEN, TURNER and DALLING2010) suggest dispersal limitation may more strongly influence palm species’ distributions than soils, despite the habitat associations found with soil N and other nutrients. Similarly large spatial overlap among pairs of species that were distributed in neighbouring habitats has been reported for oak species in Thailand (Noguchi et al. Reference NOGUCHI, ITOH, MIZUNO, SRI-NGERNYUANG, KANZAKI, TEEJUNTUK, SUNGPALEE, HARA, OHKUBO, SAHUNALU, DHANMMANONDA and YAMAKURA2007). Finally, environmental heterogeneity could not explain all the variation in species distribution in an Ecuadorian TMF (Svenning Reference SVENNING2001). Teasing apart the relative importance of niche assembly versus dispersal assembly in TMF, will require much greater sampling effort.
One caution in linking species or functional traits to environmental conditions is that habitat partitioning may have strong taxonomic affinities. In the Amazon-to-Andes transect, Asner et al. (Reference ASNER, MARTIN, TUPAYACHI, ANDERSON, SINCA, CARRANZA-JIMENEZ and MARTINEZ2014a) assert that chemical characteristics of canopy trees are largely (80%) reflected by phylogeny rather than environmental conditions. These conclusions were supported by the fact that interspecific variation was two to three times higher than intraspecific variation in canopy traits (Asner et al. Reference ASNER, MARTIN, TUPAYACHI, ANDERSON, SINCA, CARRANZA-JIMENEZ and MARTINEZ2014a). Similarly, in a Bolivian altitudinal gradient study from 1200–3100 m asl, there was evidence that species’ distributions were related to environmental heterogeneity, but there was also strong taxonomic clustering within an altitudinal zone (Arellano & Macía Reference ARELLANO and MACÍA2014). More research is needed to test the relative strength of taxonomic vs. environmental factors on functional traits.
WHAT IS THE POTENTIAL FOR MYCORRHIZAL ASSOCIATIONS TO MEDIATE PRODUCTIVITY AND CARBON STORAGE PATTERNS VIA BIOTIC FEEDBACKS?
While soils, topography and climate play the primary role in determining biogeochemical cycling, biotic feedbacks mediated by plant nutritional traits, N-fixing symbionts and mycorrhizas are also likely to be important. With the exception of Asian dipterocarp forests, the majority of lowland tropical tree communities are dominated by species that form arbuscular mycorrhizal (AM) associations. In contrast, Asian and neotropical montane forests (particularly those in Central America and the northern Andes) generally include representatives of ectomycorrhizal (EM) Fagales (e.g. oaks, walnuts), which often achieve ecological dominance. Ericaceae (e.g. Vaccinium) are also widely distributed in montane forests and form ericoid mycorrhizas (ERM). EM and ERM are thought to provide a competitive advantage in N-limited environments because of the ability to access N from a variety of organic sources (Read & Perez-Moreno Reference READ and PEREZ-MORENO2003, Treseder et al. Reference TRESEDER, CZIMCZIK, TRUMBORE and ALLISON2008). In contrast, AM fungi are thought to provide advantages over EM fungi for plant P uptake (Smith et al. Reference SMITH, SMITH and JAKOBSEN2003, but see Hodge & Fitter Reference HODGE and FITTER2010).
The mycorrhizal status of canopy trees has the potential to strongly influence nitrogen cycling and soil carbon storage in TMF. If EM and ERM compete more strongly with free-living microbes for organic N than AM mycorrhizas, then increasing N limitation to decomposer organisms could potentially slow rates of organic matter cycling (Orwin et al. Reference ORWIN, KIRSCHBAUM, ST JOHN and DICKIE2011). Support for this prediction comes from observations of higher nitrification rates, and ratios of inorganic to organic N in temperate forest stands with higher AM versus EM tree basal area (Phillips et al. Reference PHILLIPS, BRZOSTEK and MIDGLEY2013). Biogeochemical cycling beneath EM-dominated forest has therefore been characterized as an ‘organic N economy’ (Phillips et al. Reference PHILLIPS, BRZOSTEK and MIDGLEY2013). More broadly, a meta-analysis of soil carbon storage across multiple ecosystems is consistent with this prediction. Forest stands dominated by EM and ERM taxa stored 1.3 times more carbon per unit of nitrogen than did AM-dominated ecosystems, with stronger effects of mycorrhizal type on carbon storage than precipitation, temperature and primary production (Averill et al. Reference AVERILL, TURNER and FINZI2014). EM associations may facilitate increased forest productivity on TMF soils where nitrogen is scarce, as EM-dominated forests exhibited the greatest canopy productivity along a soil gradient in western Panama despite being located on the lowest-fertility soil type (Heineman et al. Reference HEINEMAN, CABALLERO, MORRIS, VELASQUEZ, SERRANO, RAMOS, GONZALEZ, MAYORGA, CORRE and DALLING2015). TMF ecotones that capture the altitudinal or latitudinal limits of EM taxa (e.g. Fagales in the northern Andes; Nothofagaceae in Malesia) provide unexplored natural laboratories for exploring how EM associations impact ecosystem nutrient cycling.
HOW WILL CHANGING CLIMATE AND INCREASING ANTHROPOGENIC NITROGEN INPUTS AFFECT TMF?
Figure 1 suggests pathways by which alterations to climate drivers (temperature, precipitation and cloud cover) will influence nutrient cycling in TMF. Because the composition and physiognomy of montane forests is strongly tied to regimes of rainfall and cloud cover, climate change is predicted to have dramatic effects on montane forests by lifting cloud-base heights. This is predicted to occur through a combination of global and regional effects including conversion of lowland forest to other land uses (Foster Reference FOSTER2001, Nair et al. Reference NAIR, RAY, LAWTON, WELCH, PIELKE, CALVO-ALVARADO, Bruijnzeel, Scatena and Hamilton2010, Still et al. Reference STILL, FOSTER and SCHNEIDER1999, van der Molen et al. Reference VAN DER MOLEN, VUGTS, BRUIJNZEEL, SCATENA, PIELKE, KROON, Bruijnzeel, Scatena and Hamilton2010).
N deposition rates are likely to increase in most TMF, with major implications for biogeochemical cycling. In lowland forests there is clear evidence that N deposition has been linked to long-term increases in leaf N and foliar ∂15N in Panama and wood ∂15N in Thailand (Hietz et al. Reference HIETZ, TURNER, WANEK, RICHTER, NOCK and WRIGHT2011). Future N deposition is predicted to be particularly high in many montane forests that are considered biodiversity hotspots (Phoenix et al. Reference PHOENIX, HICKS, CINDERBY, KUYLENSTIERNA, STOCK, DENTENER, GILLER, AUSTIN, LEFROY, GIMENO, ASHMORE and INESON2006). N deposition, when combined with climate change, will likely have a combination of synergistic and antagonistic effects in TMF. In some scenarios, soil C storage may be increased in TMF, due to interactions with N deposition, as has been observed in temperate forests (Pregitzer et al. Reference PREGITZER, BURTON, ZAK and TALHELM2008). Cusack et al. (Reference CUSACK, CHOU, LIU, HARMON and SILVER2009) showed that N fertilization in Puerto Rico significantly increased the temperature sensitivity of slowly cycling C pools in TMF. However, the effects of N deposition on carbon storage are dependent on litter quality, with increased carbon storage when N addition rates are high and leaf-litter quality is low, and the opposite effect when litter quality is high (Knorr et al. Reference KNORR, FREY and CURTIS2005, Waldrop et al. Reference WALDROP, ZAK, SINSABAUGH, GALLO and LAUBER2004).
Cloud water tends to be elevated in both inorganic and dissolved organic nitrogen relative to rain water, so that any change in cloud cover and duration will likely have effects on N cycling (Vong et al. Reference VONG, BAKER, BRECHTEL, COLLIER, HARRIS, KOWALSKI, MCDONALD and MCINNES1997, Weathers et al. Reference WEATHERS, LOVETT, LIKENS and CARACO2000). Over the longer term, N deposition and climate effects may act synergistically to replace montane species, characterized by conservative nutrient use efficiency, slow-growth rates and low litter quality, with faster-growing lower-elevation species with the opposite traits. Compositional change favouring AM species may then result in net loss of soil C (Averill et al. Reference AVERILL, TURNER and FINZI2014).
Decreased precipitation and frequency of soil anaerobiosis in combination with increased temperature may provide an additional pathway to soil C loss associated with increased rates of decomposition. Even small increases in temperature could have large effects on soil C storage because of the exponential relationship between temperature and decomposition rate (Benner et al. Reference BENNER, VITOUSEK, OSTERTAG, Bruijnzeel, Scatena and Hamilton2010, Raich et al. Reference RAICH, RUSSELL and VITOUSEK1997). However, a contrasting hypothesis is that soil C storage will remain static, if increases in biomass and necromass production balance loss pathways such as soil C respiration and decomposition. There is evidence for this hypothesis along an altitudinal gradient in Hawai‘i consisting of nine plots ranging from 800–1600 m asl (18.2–13.0°C), similar in monthly soil water content, vegetation, substrate type and age, and disturbance history (Selmants et al. Reference SELMANTS, LITTON, GIARDINA and ASNER2014). Here soil organic C did not change with mean annual temperature, but litterfall production, total below-ground carbon fraction and soil CO2 respiration all increased with temperature (Giardina et al. Reference GIARDINA, LITTON, CROW and ASNER2014).
Ecologists are just beginning to conduct plant, litter and soil translocation experiments on altitudinal transects to understand constraints on species distribution and soil carbon storage (Malhi et al. Reference MALHI, SILMAN, SALINAS, BUSH, MEIR and SAATCHI2010, Salinas et al. Reference SALINAS, MALHI, MEIR, SILMAN, ROMAN CUESTA, HUAMAN, SALINAS, HUAMAN, MAMANI and FARFAN2011). Chen (Reference CHEN2012) translocated soils from high elevation to the low elevation and in both situations, there was increased respiration rate with lower soil organic carbon content at the end of experiment. Replication of this approach across sites that incorporate variation in soil properties and microbial communities will provide new insights into how altitude affects nutrient cycling processes. Previous transplant experiments have found significant altitude × soil substrate interactions in key nutrient-cycling parameters, including litter decomposition (Scowcroft et al. Reference SCOWCROFT, TURNER and VITOUSEK2000) and nitrogen mineralization (Kitayama et al. Reference KITAYAMA, SHIN-ICHIRO, NOREEN and MASAHIKO1998b). Therefore, the insight gained from elevation transplant experiments is greatly enhanced by the inclusion of multiple soil habitats at each altitude.
FUTURE RESEARCH DIRECTIONS AND CONCLUSIONS
Advancing our understanding of how climate and soils influence tropical montane forests will require a far more comprehensive network of forest census plots. At present, forest plots are unevenly distributed across montane landscapes, with a clear geographic bias in favour of neotropical forests, and sparse sampling of South-East Asian and Afromontane sites. Existing site selection therefore largely precludes analyses of how local variation in environmental factors shape forest productivity and composition, and hinders larger-scale synthesis across biogeographic regions. Increasing replication of small forest-dynamics plots within the same landscape or establishing larger plots (10–25 ha) with local-scale measurement of soil parameters would allow investigators to tease apart the specific environmental factors driving variation in nutrient cycling in TMF. Forest dynamics data will need to be linked to high-resolution meteorological data to begin to address how montane forests will respond to climate change; this is a particular challenge in montane forests where topography and exposure can exert strong localized effects on precipitation and cloud moisture inputs (Häger & Dohrenbusch Reference HÄGER and DOHRENBUSCH2011).
Our review indicates that the potential for multiple nutrient limitation to montane forest from N, P and K remains unexplored. Large variation in tissue nutrient ratios among co-occurring montane forest trees suggests that diverse responses to nutrient availability are likely to exist at the community level with potential feedback effects on productivity. The relatively low species diversity, but high functional diversity of many montane forests suggests that alternative approaches to stand-level fertilization experiments may be feasible in this ecosystem. In particular, species-centric application of multiple nutrients to co-occurring AM and EM taxa in a variety of geological substrates and geographic regions would provide insight into how soil microbial communities mediate nutrient cycling dynamics in TMF.
While multiple feedbacks and processes contribute to the TMF syndrome (Figure 1) the contribution of each of these varies greatly across environmental conditions and geographies. In this review, we have highlighted how parent material, soil fertility, topography, disturbance, species composition, plant functional traits, mycorrhizal associations, soil oxygen levels and the identity of limiting nutrients influences rates of nutrient cycling. Given the variation in conditions and responses, the concept of TMF as a nutrient-limited ecosystem needs to be updated with a better understanding of the sensitivity of each box and arrow in Figure 1 to a suite of environmental and biogeographic conditions. We advocate this more flexible view of TMF is vital in light of the climate and land-use changes facing this critically endangered ecosystem type.
ACKNOWLEDGEMENTS
Gary Potts and Maya Quiñones helped with Figure 2. JWD and KH were supported by funding from the Smithsonian Tropical Research Institute, NSF grant DEB 1311379 and Government of Panama SENACYT grant COLO08. Support to GG was provided by NSF grants DEB 0620910 and EAR-1331841. RO was supported by funding from NSF CAREER 0546868, with facilitation for lab work through NSF EPSCoR 0237065 and 0554657.