Introduction
Alkaline earth and rare earth (Ln) metal oxides exhibit basic properties and may react at moderate temperatures at atmosphere to form ternary oxides, for example, BaLn2O4, which have interesting structural and complicated physical properties, such as geometrically frustrated magnetism [Reference Kobayashi, Ogino, Nakamura, Mori, Yamamura and Mitamura1, Reference Doi, Nakamori and Hinatsu2, Reference Besara, Lundberg, Sun, Ramirez, Dong, Whalen, Vasquez, Herrera, Allen, Davidson and Siegrist3] and high-temperature superconductivity [Reference Puig, Martinez, Yu, Hu, Gomiz, Sandiumenge and Obradors4, Reference Chen, Chang and Wu5]. Hence, it is important to have accurate data on the formation and thermal stabilities of the BaLn2O4 compounds. To facilitate such investigation, reliable thermodynamic data on the BaLn2O4 phase and the phase diagram of the BaO–Ln2O3 system are necessary. However, although the physical properties [Reference Kobayashi, Ogino, Nakamura, Mori, Yamamura and Mitamura1, Reference Doi, Nakamori and Hinatsu2, Reference Besara, Lundberg, Sun, Ramirez, Dong, Whalen, Vasquez, Herrera, Allen, Davidson and Siegrist3, Reference Puig, Martinez, Yu, Hu, Gomiz, Sandiumenge and Obradors4, Reference Chen, Chang and Wu5] and structures [Reference Winnie, Lawrence, Boris, Michael and Judith6, Reference Costa, Ferretti, Franceschi and Olcese7, Reference Wong-Ng, Cook, Suh, Coutts, Stalick, Levin and Huang8, Reference Yamagata, Igarashi, Saitoh and Okazaki9, Reference Lopato10] of BaLn2O4 have been studied, available thermodynamic and phase diagram data were really limited and in conflict. The only experimental study on the phase diagrams of the BaO–Ln2O3 systems was performed more than forty years ago, and the available information was incomplete [Reference Lopato10]. Subasri and Sreedharan [Reference Subasri and Sreedharan11] and Vakhovskaya et al. [Reference Vakhovskaya, Voskov, Kovba and Uspenskaya12] studied the thermodynamic properties of BaLn2O4 by the electromotive force method; the Gibbs energies of formation of BaLn2O4, (−93 to −110 kJ/mol) reported by Subasri and Sreedharan [Reference Subasri and Sreedharan11], were several times more negative than those determined by Vakhovskaya et al. [Reference Vakhovskaya, Voskov, Kovba and Uspenskaya12] and were obviously different from our previously determined data for BaSm2O4 [Reference Gong, Ushakov, Agca and Navrotsky13]. The possible reasons for this discrepancy have been discussed in our previous work [Reference Gong, Ushakov, Agca and Navrotsky13]. In the present work, heat capacity and enthalpy of formation of the BaNd2O4 compound were measured. Utilizing these data, a local thermodynamic data base for the BaO–Nd2O3 system was assessed using the CALPHAD methodology, and the corresponding phase diagram was calculated.
Results and discussion
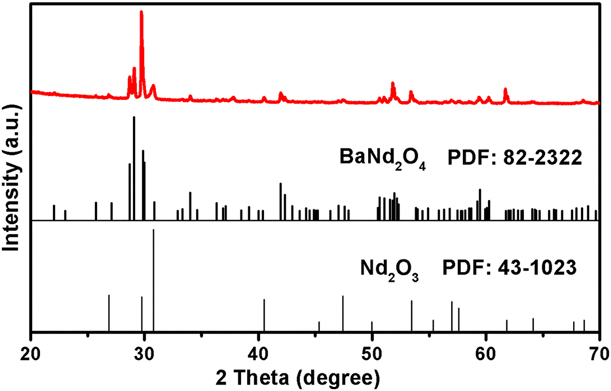
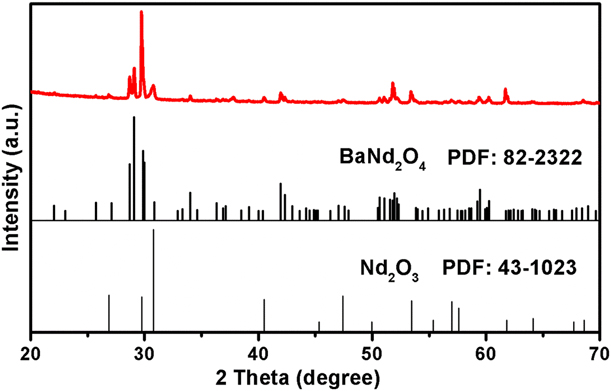
Figure 1 shows the X-ray diffraction (XRD) pattern of the prepared BaNd2O4. Extra peaks associated with Nd2O3 phase are detected, although heat treatment at 1673 K for the corresponding mixtures with additional regrinding was repeated several times. Quantitative phase analysis using the Rietveld method and JADE 6.0 software (Jade Software Corporation, Ltd., Christchurch, New Zealand) indicated that the synthetic BaNd2O4 contained about 15.0 mol% (10.8 wt%) Nd2O3. The needed sample processing and XRD analyses show that it was more difficult to synthesize BaNd2O4 than BaSm2O4. In our previous work [Reference Gong, Ushakov, Agca and Navrotsky13], single-phase BaSm2O4 was obtained by heat treatment at 1573 K for 3 h. The reason for this difference is unclear.
XRD pattern of the BaNd2O4 sample quenched from 1673 K.
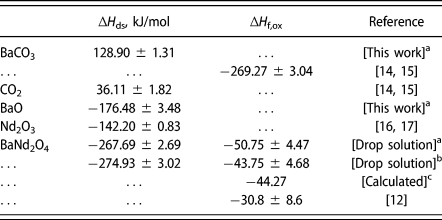
The drop solution enthalpies of BaO, Nd2O3, and BaNd2O4 are summarized in Table I, where the initial value for the prepared BaNd2O4 sample was obtained directly from high-temperature oxide melt solution calorimetric experiments, ignoring the Nd2O3 impurity.
Enthalpies of drop solution (∆H ds) in 3NaO·4MoO3 at 1073 K and enthalpy of formation from oxides (∆H f,ox) at 298 K.
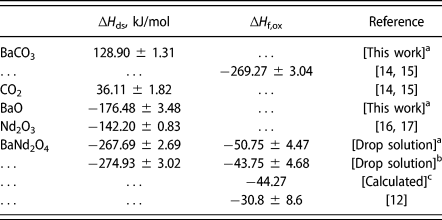
a [This work] means the original data obtained from high-temperature oxide melt solution calorimetry.
b [This work] means data corrected for the Nd2O3 impurity and is the preferred value.
c [Calculated] means the data calculated using the CALPHAD thermodynamic parameters.
The enthalpy of drop solution of BaO was determined based on the following thermochemical cycle:
 $$\ealign{{\rm{BaC}}{{\rm{O}}_3}\left( {{\rm{s}},298\;{\rm{K}}} \right) \to {\rm{\ C}}{{\rm{O}}_2}\left( {{\rm{g}},1073\;{\rm{K}}} \right) \cr+ {\rm{BaO}}\left( {{\rm{sn}},1073\;{\rm{K}}} \right)\quad \Delta {H_1}\quad ,$$
 $${\rm{C}}{{\rm{O}}_2}\left( {{\rm{g}},298\;{\rm{K}}} \right) \to {\rm{C}}{{\rm{O}}_2}\left( {{\rm{g}},1073\;{\rm{K}}} \right)\quad \Delta {H_2}\quad ,$$
 $${\rm{BaO}}\left( {{\rm{s}},298\;{\rm{K}}} \right) \to {\rm{BaO}}\left( {{\rm{sn}},1073\;{\rm{K}}} \right)\quad \Delta {H_3}\quad ,$$
 $${\rm{C}}{{\rm{O}}_2}\left( {{\rm{g}},298\;{\rm{K}}} \right) + {\rm{BaO}}\left( {{\rm{s}},298\;{\rm{K}}} \right) \to {\rm{BaC}}{{\rm{O}}_3}\left( {{\rm{s}},298\;{\rm{K}}} \right)\quad \Delta {H_4}\quad ,$$
 $$\Delta {H_3} = \Delta {H_1} + \Delta {H_4} - \Delta {H_2}\quad ,$$
where ΔH 1, ΔH 2, and ΔH 3 are related to the enthalpies of drop solution of BaCO3 (128.90 ± 1.31 kJ/mol), CO2, and BaO at 1073 K, respectively. ΔH 2 also equals the enthalpy increment H 1073 − H 298 of CO2. ΔH 4 stands for the enthalpy of formation of BaCO3 from CO2 and BaO at 298 K. Both ΔH 2 (36.11 ± 1.82 kJ/mol) and ΔH 4 (−269.27 ± 3.04 kJ/mol) can be determined by using the literature thermodynamic data at 298 K as well as the enthalpy increment [Reference Robie, Hemingway and Fisher14, Reference Barin15].
However, the 15 mol% Nd2O3 impurity in the synthesized BaNd2O4 sample must be accounted for in the heat of drop solution. This is done as follows:
 $$\Delta {H_{{\rm{ds}}}}\left( {{\rm{sample}}} \right) = 0.85\Delta {H_{{\rm{ds}}}}\left( {{\rm{BaN}}{{\rm{d}}_{\rm{2}}}{{\rm{O}}_4}} \right) + 0.15\Delta {H_{{\rm{ds}}}}\left( {{\rm{N}}{{\rm{d}}_{\rm{2}}}{{\rm{O}}_{\rm{3}}}} \right)\quad .$$
Since the sample is a mixture of 15 mol% Nd2O3 and 85 mol% BaNd2O4, the average formula weight is 466.2 g/mol and the enthalpy of drop solution obtained from the drop solution measurements is −(252.02 ± 2.56) kJ/mol. Thus, the enthalpy of drop solution of pure BaNd2O4 is corrected to be as follows:
 $$\Delta {H_{{\rm{ds}}}}\left( {{\rm{BaN}}{{\rm{d}}_2}{{\rm{O}}_4}} \right) = - 274.93{\rm{\ }} \pm {\rm{\ }}3.02\;{{{\rm{kJ}}} / {{\rm{mol}}}}\quad .$$
Using the drop solution enthalpies, including the corrected value for the compound, the enthalpy of formation of BaNd2O4 from component oxides at 298 K has been calculated based on the following thermodynamic cycle:
 $$\eqalign{{\rm{BaN}}{{\rm{d}}_2}{{\rm{O}}_4}\left( {{\rm{s}},298\;{\rm{K}}} \right) \to {\rm{N}}{{\rm{d}}_2}{{\rm{O}}_3}\left( {{\rm{sn}},1073\;{\rm{K}}} \right) \cr+ {\rm{BaO}}\left( {{\rm{sn}},1073\;{\rm{K}}} \right)\quad \Delta {H_5}\quad ,$$
 $${\rm{N}}{{\rm{d}}_2}{{\rm{O}}_3}\left( {{\rm{s}},298\;{\rm{K}}} \right) \to {\rm{N}}{{\rm{d}}_2}{{\rm{O}}_3}\left( {{\rm{sn}},1073\;{\rm{K}}} \right)\quad \Delta {H_6}\quad ,$$
 $$\eqalign{{\rm{N}}{{\rm{d}}_2}{{\rm{O}}_3}\left( {{\rm{s}},298\;{\rm{K}}} \right) + {\rm{BaO}}\left( {{\rm{s}},298\;{\rm{K}}} \right) \to \cr{\rm{BaN}}{{\rm{d}}_2}{{\rm{O}}_4}\left( {{\rm{s}},298\;{\rm{K}}} \right)\quad \Delta {H_7}\quad ,$$
 $$\Delta {H_7} = \Delta {H_6} + \Delta {H_3} - \Delta {H_5}\quad .$$
The obtained value from the above thermodynamic cycle as well as two standard deviations of the mean calculated from the ten measurements are listed in Table I. Both sets of values, the uncorrected and those corrected for the impurity are listed in Table I because the first refers to the actual data, whereas the second, although our best estimate for impurity content, may not be a unique representation. Nevertheless, the corrected value is the preferred one and is used in further calculations.
BaNd2O4 shows a somewhat less exothermic enthalpy of formation (−43.75 ± 4.68 kJ/mol) than BaSm2O4 (−51.7 kJ/mol) [Reference Subasri and Sreedharan11], which may explain why it is relatively easy to synthesize the BaSm2O4 single phase compound at 1573 K from the binary oxides [Reference Gong, Ushakov, Agca and Navrotsky13], but harder to obtain pure BaNd2O4 even with longer heat treatment time at 1673 K. Another possibility is that more BaO was lost by evaporation at the higher synthesis temperature, especially because longer heating times were required.
The present heat of formation is less exothermic than that reported by Subasri and Sreedharan [Reference Subasri and Sreedharan11] but slightly more exothermic than the data of Vakhovskaya et al. [Reference Vakhovskaya, Voskov, Kovba and Uspenskaya12] The same trend was detected for BaSm2O4 [Reference Gong, Ushakov, Agca and Navrotsky13], and we attributed the large discrepancies to the use of BaZrO3|ZrO2|BaF2 as the reference electrode at 900–1150 K [Reference Levitskii18] in the work of Subasri and Sreedharan [Reference Subasri and Sreedharan11].
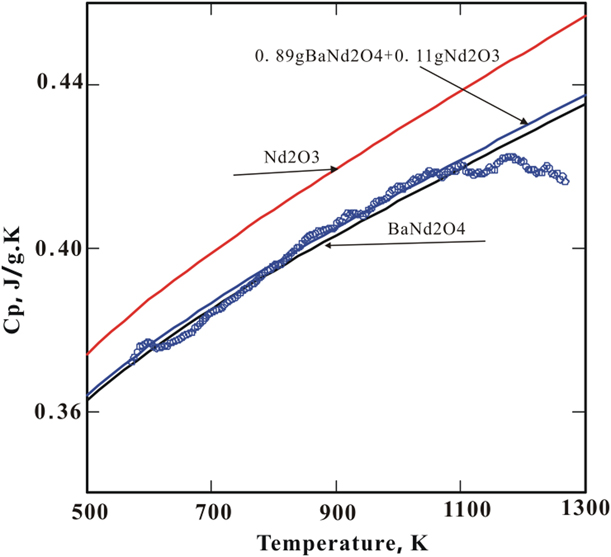
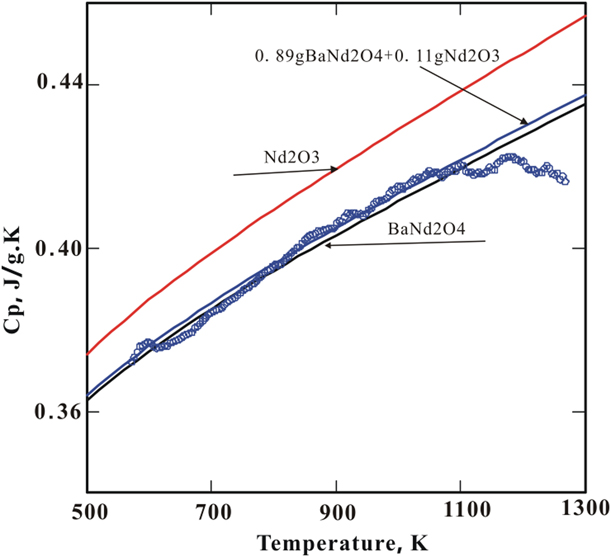
The measured original data for the heat capacity of the prepared BaNd2O4 sample are shown in Fig. 2. The deviation from those calculated using the Neumann–Kopp role [Reference Kopp19] is about 4%. The measured values can be refined considering the 15 mol% Nd2O3 impurity. The heat capacity of BaNd2O4 was calculated using the Neumann–Kopp role and that of Nd2O3 was calculated based on its Gibbs energy function from Zinkevich [Reference Zinkevich20]. The calculated sum fits to the measured data quite well, which makes two things clear: our estimation for impurity content is believable and the heat capacity of BaNd2O4 fits the Neumann–Kopp rule. Thus, one can make a good approximation to the heat capacity for the BaNd2O4 compounds using the constituent oxide values.
Heat capacity of BaNd2O4. The black solid curve represents Neumann–Kopp rule calculations. Measured values are marked with blue symbols (○) and the sum of heat capacity of 0.89 g BaNd2O4 adding that of 0.11 g Nd2O3 with a blue solid curve. The red curve represents the heat capacities of Nd2O3 calculated using the Gibbs energy function from Zinkevich [Reference Lysenko23].
Thermodynamic modeling and phase diagram calculation
On the basis of the thermochemical properties of BaNd2O4 and the phase diagram information of the BaO–Nd2O3 system available in the literature [Reference Lopato10], the thermodynamic database and the phase diagram of the BaO–Nd2O3 system can be assessed. The CALPHAD method [Reference Andersson, Helander, Hoglund, Shi and Sundman21] is employed here and the description of each phase is detailed below.
The Gibbs energy function  $G_{\rm{i}}^{0,\varphi }\left( T \right) = G_{\rm{i}}^{0,\varphi }\left( T \right) - H_{\rm{i}}^{{\rm{SER}}}$ for the pure binary component i (i = BaO, Nd2O3) in the phase φ was expressed by Eq. (12):
 $$\eqalign{G_{\rm{i}}^{0,\varphi }\left( T \right) = {\rm{a}} + {\rm{b}}T + {\rm{c}}T\;\ln \;T + {\rm{d}}{T^2} + {\rm{e}}{T^{ - 1}} \cr+ {\rm{f}}{T^3} + {\rm{g}}{T^7} + {\rm{h}}{T^{ - 9}}\quad ,$$
where  $H_{\rm{i}}^{{\rm{SER}}}$ is the molar enthalpy of the component i at 298 K and 101,325 Pa in its standard element reference (SER) state, and T is the absolute temperature. The last two terms in Eq. (12) are used only outside the ranges of stability [Reference Andersson, Guillermet, Gustafson, Hillert, Jansson, Jonsson and Ågren22], the term gT 7 is relative to the liquid below the melting point and hT −9 to the solid phases above the melting point. In the present work, the Gibbs energy functions of pure Nd2O3 were consistent with those of Zinkevich [Reference Zinkevich20]. Those of BaO in liquid and rocksalt structures as well as in the hypothetical metastable phases were taken from our previous assessment [Reference Gong, Ushakov, Agca and Navrotsky13].
Although there seem to be no experimental phase equilibrium data for the BaO–Nd2O3 system in the literature, Lopato [Reference Lopato10] studied the interaction of rare earth oxides with barium oxide and concluded that the BaO–Nd2O3 and BaO–La2O3 systems have the same type of phase diagram. Additionally, a calculated BaO–Nd2O3 phase diagram was provided by Lysenko [Reference Lysenko23], which confirmed the similarity between the BaO–Nd2O3 and BaO–La2O3 phase diagram, although Lysenko did not consider the mutual solubility between BaO and Nd2O3 and used a complex sublattice model to describe the liquid phase. Thus, the reported BaO–La2O3 phase diagram [Reference Lopato10] was used as the reference at the beginning of our BaO–Nd2O3 phase diagram assessment, and six phases: the BaNd2O4 compound, liquid, X SS (cubic X-form Nd2O3 based solid solution), H SS (hexagonal H-form Nd2O3—based solid solution), A SS (hexagonal A-form Nd2O3—based solid solution), and RS SS (rocksalt BaO—based solid solution) were taken into account.
In Ref. Reference Gong, Ushakov, Agca and Navrotsky13, we configured the local thermodynamic databases and phase diagram of the BaO–Sm2O3 system on the basis of the determined heat capacity and enthalpy of formation of BaSm2O4 as well as the experimental phase diagram data reported by Lopato [Reference Lopato10]. As a part of an ongoing program as well as for compatibility, the liquid and the solid solution phases in the BaO–Nd2O3 system were thermodynamically described by the same substitutional solution model as for the BaO–Sm2O3 system. Thus, the Gibbs energy for each solution phase was expressed by Redlich–Kister polynomials [Reference Redlich and Kister24] as Eq. (13).
 $$\eqalign{{G_{\rm{m}}^{\rm{P}} - {H^{{\rm{SER}}}} = \left( {1 - x} \right){\;^{\rm{0}}}G_{{\rm{BaO}}}^{\rm{P}} + x{\;^0}G_{{\rm{N}}{{\rm{d}}_{\rm{2}}}{{\rm{O}}_{\rm{3}}}}^{\rm{P}} \cr+ RT\left[ {x\;\ln \;x + \left( {1 - x} \right)\ln \left( {1 - x} \right)} \right] + \crx\left( {1 - x} \right)\left[ {\left( {{a_0} + {b_0}T} \right) + \left( {1 - 2x} \right)\left( {{a_1} + {b_1}T} \right)} \right]\quad ,$$
P represents the solution phase, including liquid, X SS, H SS, and A SS.  $^0G_{{\rm{N}}{{\rm{d}}_{\rm{2}}}{{\rm{O}}_{\rm{3}}}}^{\rm{P}}$ and
 $^0G_{{\rm{BaO}}}^{\rm{P}}$ are the Gibbs energy of Nd2O3 and BaO in the P phase, respectively. They are from literature assessment [Reference Gong, Ushakov, Agca and Navrotsky13, Reference Zinkevich20]. The interaction parameters a 0, b 0, a 1, and b 1 were to be optimized. Because of the very limited solubility of rare earth oxides in solid BaO [Reference Lopato10], the BaO—based solid solution was treated as the pure oxide.
For the Gibbs energy of the BaNd2O4 compound, it was expressed by the Neumann–Kopp rule as discussed previously.
 $$G\left( {{\rm{BaN}}{{\rm{d}}_2}{{\rm{O}}_4},T} \right) = {G_{{\rm{BaO}}}} + G{\rm{N}}{{\rm{d}}_{\rm{2}}}{{\rm{O}}_3}A + A + BT\quad ,$$
where A and B are the parameters related to the enthalpy and entropy of formation of the compound from the hexagonal A-form Nd2O3 and rocksalt BaO.
The PARROT program of the Thermo-Calc software package (Solna, Sweden) was used for the parameter optimization [Reference Sundmsn, Jansson and Andersson25]. The calculation was started by optimizing the Gibbs energy function of the BaNd2O4 compound. The corresponding values of the measured enthalpy and the entropy assessed based on the second law were used as the starting points during the optimization process. The obtained parameters A and B were then slightly modified when the interaction parameters of the liquid phase were optimized by considering the phase equilibria related to both the BaNd2O4 compound and liquid phase. Then the interaction parameters of A SS, H SS, and X SS phases were assessed one by one to fit the corresponding phase equilibrium and the solubility data.
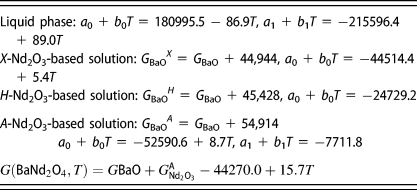
The finally obtained thermodynamic database for the BaO–Nd2O3 system is given in Table II. The calculated enthalpy of formation of BaNd2O4 from oxides at 298 K using the optimized thermodynamic parameters is −44.47 kJ/mol, which is in good agreement with our experimental value (−43.54 ± 4.55 kJ/mol). The Gibbs energy of formation at 1100 K (−27.69 kJ/mol) was also calculated to compare with the literature data [Reference Subasri and Sreedharan11, Reference Vakhovskaya, Voskov, Kovba and Uspenskaya12]. Similar to the enthalpy of formation, our data for the Gibbs energy of formation is more negative than the data of Vakhovskaya et al. [Reference Vakhovskaya, Voskov, Kovba and Uspenskaya12] and much less negative than that of Subasri and Sreedharan [Reference Subasri and Sreedharan11].
Summary of the thermodynamic parameters of the BaO–Nd2O3 system according to the present optimization. All values are given in SI units (J, mol, K).
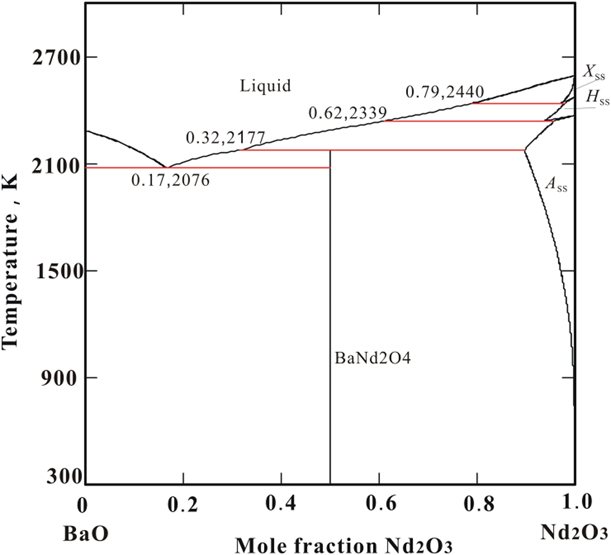
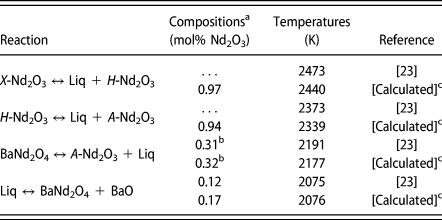
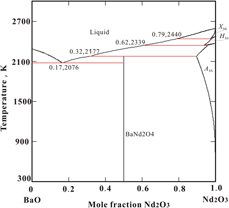
The calculated BaO–Nd2O3 phase diagram is shown in Fig. 3, which displays phase equilibria similar to those in the BaO–La2O3 system [Reference Lopato10]. Table III lists the calculated data for invariant reactions. The melting of BaNd2O4 was calculated to be 2177 K according to the reaction BaNd2O4 = A SS + Liquid, in an incongruent process. In the work of Lopato [Reference Lopato10], BaNd2O4 and BaSm2O4 were reported to melt congruently at temperature above 2173 K while BaLa2O4 melted incongruently. Our previous experimental work and calculation [Reference Gong, Ushakov, Agca and Navrotsky13] found that BaSm2O4 melted incongruently. Considering the incongruent melting of both BaLa2O4 and BaSm2O4, the present calculation of incongruent melting of BaNd2O4 appears reasonable.
Calculated BaO–Nd2O3 phase diagram. X SS, H SS, and A SS mean the X-Nd2O3, H-Nd2O3, and A-Nd2O3–based solid solution.

Calculated invariant reaction points (composition and temperature) in the BaO–Nd2O3 system compared with the calculation of Lysenko [Reference Lysenko23].
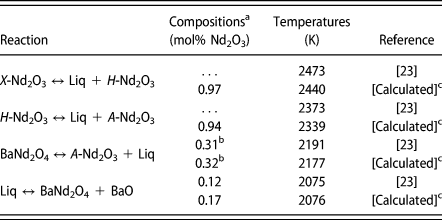
a For the A ↔ B + C reactions, the composition represents the A phase.
b Means the composition of liquid.
c [Calculated] means the calculated data using the thermodynamic parameters.
Conclusions
BaNd2O4 containing some Nd2O3 impurity was synthesized by solid-state reaction at 1673 K. Differential scanning calorimetry and high-temperature oxide melt solution calorimetry of the BaNd2O4 compound were carried out. The effect of Nd2O3 impurity was corrected reasonably. The finally obtained heat capacities are consistent with the Neumann–Kopp role and the enthalpy of formation from component oxides at 298 K is negative but slightly smaller in magnitude than that of BaSm2O4. Thermodynamic assessment of the BaO–Nd2O3 system based on all available data provides a self-consistent local thermodynamic database. Thermodynamic calculation demonstrates that the BaO–Nd2O3 phase diagram is similar to that of BaO–La2O3 reported by Lopato [Reference Lopato10]. BaNd2Othe is calculated to melt incongruently at 2177 K.
Experimental procedures
The samples were synthesized in the Peter A. Rock Thermochemistry Laboratory, UC Davis, by solid-state reaction. BaCO3 (Fisher, Thermo Fisher Scientific, Leicestershire, England, 99.6 wt%) and Nd2O3 (Alfa Aesar, MilliporeSigma, Burlington, Massachusetts, 99.9 wt%) were used to prepare BaNd2O4. Starting mixtures were preheated at 1073 K overnight to remove any moisture and then stored in a desiccator. About 2 g of sample was prepared by first grinding BaCO3 and Nd2O3 with the appropriate molar ratio in an agate mortar. The compositional mixtures were pressed into pellets and put into Pt crucibles, then annealed at 1673 K for 3 h using a Deltech platform furnace, which heated starting from 1088 K with 10 K/min and cooled to 1088 K with the same ramp. The products were analyzed by XRD, and synthesis was repeated three times with regrinding to try to obtain a single phase.
XRD analysis was performed with a Bruker D8 Advance X-ray diffractometer (Bruker AXS, Karlsruhe, Germany) using a Cu Kα radiation at 40 kV and 40 mA emission current using 15–80° 2θ range, 0.02° step size, and a scan speed of 0.25°/s. Phases present were identified using JADE 6.0 software.
A Setaram LabSYS differential scanning calorimeter (DSC) was used to determine the heat capacities of the BaNd2O4 compounds from 573 to 1273 K. The measurements were performed by the continuous method in argon flow (20 mL/min) with a heating rate of 10 K/min. Three consecutive runs using an empty crucible, α-Al2O3 standard, and the sample were performed under identical experimental conditions. The samples were packed tightly into platinum crucibles to ensure good thermal contact and reproducibility of the heat capacity data. The standard test procedure for determining specific heat capacity by differential scanning calorimetry described in Designation: E1269-11 [26] was followed for DSC sensitivity calibration with α-Al2O3 standard using the heat capacity equation from the National Institute of Standards and Technology (NIST) [Reference Ditmars, Ishihara, Chang, Bernstein and West27].
The enthalpy of formation of the BaNd2O4 compound from the component oxides at 298 K were determined by a custom-built Tian–Calvet twin high-temperature oxide melt solution calorimetry, using procedures standard in our laboratory and described in detail previously [Reference Navrotsky16, Reference Navrotsky28, Reference Navrotsky29]. The single compound from solid-state synthesis was loosely hand-pressed into pellets, 5–10 mg in weight, and dropped from room temperature into a platinum crucible containing 20 g of sodium molybdate (3Na2O·4MoO3) solvent. Calorimetric experiments were carried out at 1073 K, so that the samples could dissolve quickly. The calorimeter assembly was flushed with oxygen at 40 mL/min, and the solvent was bubbled with oxygen at 4 mL/min to maintain an oxidizing environment, stir the melt to enhance the dissolution rate of the sample, and prevent local saturation. This measurement yields an enthalpy referred to as the drop solution enthalpy, ΔH ds, which a sum of the molar heat content of the sample from T = 298 K to the calorimeter temperature T 0, and its enthalpy of solution in the solvent at calorimeter temperature. The calorimeter was calibrated using the heat content [Reference Ditmars, Ishihara, Chang, Bernstein and West27] of α-Al2O3 pellets dropped into an empty platinum crucible as a standard protocol. The experiments were repeated at least eight times to achieve statistically reliable data so that the attainable accuracy in such calorimetric measurements is no more than ±2%. The drop solution enthalpy for the end member oxides (BaO and Nd2O3) are a necessary component of the thermochemical cycle to obtain the enthalpy formation of BaNd2O4. That of Nd2O3 was taken from the result previously summarized by Navrotsky [Reference Navrotsky16] and measured by Hayun and Navrotsky [Reference Hayun and Navrotsky17]. Drop solution enthalpy measurements of BaCO3 were done under identical experimental conditions as those for BaNd2O4 to get the value for BaO, since BaO is too hygroscopic and reactive for accurate calorimetry.
Acknowledgments
Weiping Gong received funding from the Natural Science Foundation of China (Nos. 51672100, 51602121, and 51171069). Support from the National Study Abroad Fund (China), Natural Science Foundation of Guangdong Province (2017A030310665), and Program for Innovative Research Team of Huizhou University (IRTHUZ) is greatly appreciated. Experimental work at UC Davis was supported by the U.S. National Science Foundation (grant DMR 1506229).