1. Introduction
Climate change is affected by the concentration of greenhouse gases (GHG) in the atmosphere, which depends on human and natural emissions. In particular, the anthropogenic contribution to this phenomenon is widely recognized as the main driver of climate change (IPCC, 2007a).
Very little is known, however, about the reverse causation, by which climate change would affect economic growth, both quantitatively and qualitatively. Understanding how climate change will influence the global economy is obviously very important. This allows assessing the intrinsic auto-adjustment system capability, identifying income and wealth distribution effects and verifying the robustness of socio-economic scenarios.
Unfortunately, the issue is very complex because there are many diverse economic impacts of climate change operating at various levels. Some previous studies (Berritella et al., Reference Berrittella, Bigano, Roson and Tol2006; Bosello et al., Reference Bosello, Roson and Tol2006, Reference Bosello, De Cian and Roson2007a, Reference Bosello, Roson and Tolb; Bosello and Zhang, Reference Bosello and Zhang2006) have used computable general equilibrium (CGE) models to assess sectoral impacts, using a comparative static approach. This paper builds upon these studies, but innovates by considering many climate-change impacts simultaneously and, most importantly, by considering dynamic impacts in a specially designed dynamic CGE model of the world economy, the Inter-temporal Computable Equilibrium System (ICES).
Using a dynamic model allows us to investigate the increasing influence of climate change on the global economic growth. This influence is twofold: on the one hand, the magnitude of physical and economic impacts will rise over time and, on the other hand, endogenous growth dynamics is affected by changes in income levels, savings, actual and expected returns on capital.
We typically find that climate change is associated with significant distributional effects, for a number of reasons. First, not all impacts of climate change are negative. For example, milder climate attracts tourists in some regions, reduced need for warming in winter times saves energy, incidence of cold-related diseases is diminished, etc. Second, changes in relative competitiveness and terms of trade may allow some regions and industries to benefit, even from a globally negative shock. Third, higher (relative) returns on capital, possibly due to changes in demand structure and resource endowments, could foster investments and growth. All these effects can hardly be captured by a stylized macroeconomic model, and require instead a disaggregated model with explicit representation of trade links between industries and regions.
Our work complements a recent paper by Dell et al. (Reference Dell, Jones and Olken2008), who use annual variation in temperature and precipitation over the past 50 years to examine the impact of climatic changes on economic activity throughout the world. Their main finding is that higher temperatures substantially reduce economic growth in poor countries but have little effect in rich countries. This result is obtained by estimating coefficients of an aggregate econometric model in which growth and level effects of climate change on GDP are separately considered. The drawback of this approach is that the various causal mechanisms which could lead to the aggregate result are not identified, whereas the model used in this paper allows for analysis of different impacts and effects. Furthermore, it allows us to explain why different climatic conditions may affect investments and growth, through induced changes in the capital rate of return.
The paper is organized as follows. Section 2 presents the ICES model structure and explains how a baseline scenario is built. Climate-change impacts are analysed in section 3. Section 4 illustrates the simulation results, assessing how climate-change impacts will affect regional economic growth in the world. The last section draws some conclusions.
2. The ICES model
ICES is a dynamic, multi-regional CGE model of the world economy, derived from a static CGE model named GTAP-EF (Roson, Reference Roson2003; Bigano et al., Reference Bigano, Bosello, Roson and Tol2006).Footnote 1 The latter is a modified version of the GTAP-E model (Burniaux and Troung, Reference Burniaux and Truong2002), which in turn is an extension of the basic GTAP model (Hertel, Reference Hertel1997).
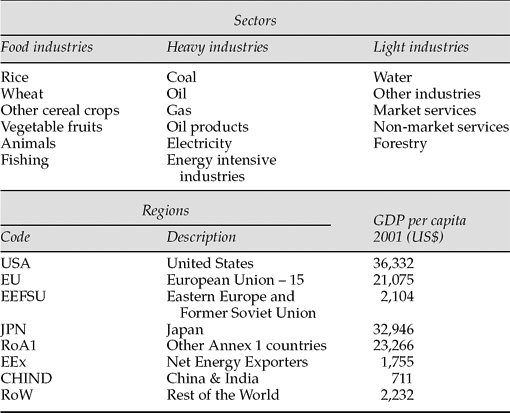
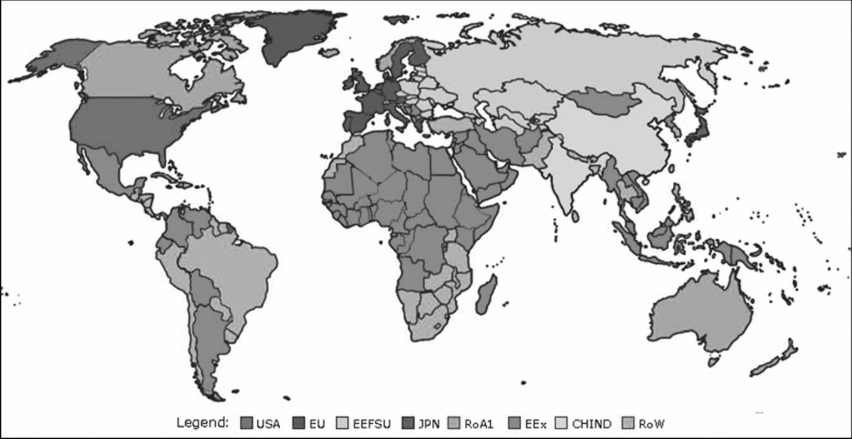
ICES is a recursive model, generating a sequence of static equilibria under myopic expectations, linked by capital and international debt accumulation. Although its regional and industrial disaggregation may vary, the results presented here refer to 8 macroregions and 17 industries, listed in table 1 and displayed in figure 1.
Model sectoral and regional disaggregation

ICES regional aggregation

Growth is driven by changes in primary resources (capital, labour, land and natural resources) from 2001 (calibration year of GTAP 6 database (Dimaranan, Reference Dimaranan2006)) onwards. Dynamics is endogenous for capital and exogenous for other primary factors.
Population forecasts are taken from the World Bank,Footnote 2 while labour stocks are changed year by year, according to the International Labour Organization (ILO) annual growth rates estimates.Footnote 3 Estimates of labour productivity (by region and industry) are obtained from the G-Cubed model (McKibbin and Wilcoxen, Reference McKibbin and Wilcoxen1998). Land productivity is estimated from the IMAGE model (IMAGE, 2001).
Natural resources are treated in GTAP in a rather peculiar way (Hertel and Tsigas, Reference Hertel, Tsigas and Dimaranan2006), and these factor stocks are endogenously estimated in the ICES baseline calibration by fixing their prices according to exogenous forecasts.Footnote 4 For further simulations which will consider climate-change impacts, those quantities follow the exogenous path obtained during the baseline calibration while their prices are endogenous.
Regional investments and capital stocks are determined as follows. Savings are a constant fraction of regional income.Footnote 5 All savings are pooled by a virtual world bank, and allocated to regional investments, on the basis of the following relationship:

where Ir is regional annual investment, Yr is regional income, r is regional and world returns on capital and φr, ρr are given parameters. Returns on capital are endogenously determined: regional returns are set to balance supply and demand for capital services at the local level, while global returns are set to match total investments and savings.
The rationale of (1), which has been adopted from the ABARE GTEM model (Pant, Reference Pant2002), is that whenever changes in returns on capital (that is, the price of capital services) do not differ from changes in the rest of the world, investments are proportional to regional income, like savings are. In this case, current returns are considered as proxies of future returns. If returns are higher (lower) than the world average, then investments are higher (lower) too.
Investments affect the evolution of the capital stock, on the basis of a standard relationship with constant depreciation over time:

Equation (1) does not ensure the equalization of regional investments and savings, and any region can be a creditor or debtor vis-à-vis the rest of the world. Because of accounting identities, any excess of savings over investments always equals the regional trade balance (TB), so there is a dynamics of the debt stock, similar to (2) but without depreciation:

Foreign debt is initially zero for all regions, then it evolves according to (3). Foreign debt service is paid in every period on the basis of the world interest rate rw.Footnote 6 Consider now how an external shock, like those associated with climate-change impacts, affects economic growth through capital and debt accumulation.
If the shock is a negative one (implying, e.g., a loss of primary resources or a lower productivity), a decrease in regional GDP proportionally lowers both savings (because of lower income) and investments (because of lower demand for capital). Any difference between these two variables, which amounts to a change in foreign debt stock and trade balance, must then be associated with changing relative returns on capital, according to (1). Most (but not all) negative effects of climate change (losses of capital, land, natural resources or lower labour productivity) imply a higher relative scarcity of capital, thereby increasing returns. In this case, the shock is partially absorbed by running a foreign debt, which must eventually be repaid.
If the negative shock lasted one or a few periods, this mechanism would amount to spreading the negative shock over a longer interval, allowing a smoother adjustment in the regional economy. Since the shocks we apply in the model usually rise in magnitude over time, if an economy starts attracting foreign investments, it will normally continue to do so over all the subsequent years, and vice versa. Therefore, the capital accumulation process tends to make this economy grow at higher rates in comparison to the baseline, in which climate-change impacts are absent. A comparison of growth paths for this economy, with and without climate change, would then highlight (non-linearly) divergent paths.
This dynamic effect overlaps with the direct impacts of climate change. The direct impacts would make each regional economy grow faster or slower. If direct and indirect effects work in the same direction, macroeconomic variables (like GDP) will progressively diverge (positively or negatively) from their baseline growth path. On the other hand, if the two effects are opposite, the direct effect would prevail at first, then the capital accumulation would eventually drive the economic growth, possibly inverting the sign of the total effects.
Dell et al. (Reference Dell, Jones and Olken2008) find evidence that changes in temperature have a long lasting impact on economic growth, particularly for poor countries, but do not provide a convincing explanation for this effect.Footnote 7 In the ICES model, instead, we are able to analyse how the various climate-change impacts may affect the capital rate of return, thereby influencing the allocation of international investments.
On the other hand, other effects which would ultimately affect economic growth could be influenced by climate change. Perhaps the most important one is technological change, which depends on research and development investments, therefore on actual and expected changes in prices. The endogenous response of technology to climate change is a difficult issue, most notably because of lack of data, and it will not be addressed in this paper.Footnote 8
3. Modelling climate-change impacts
Earlier studies (Berritella et al., Reference Berrittella, Bigano, Roson and Tol2006; Bosello et al., Reference Bosello, Roson and Tol2006, Reference Bosello, De Cian and Roson2007a, Reference Bosello, Roson and Tolb; Bosello and Zhang, Reference Bosello and Zhang2006) used CGE models to assess the economic implications of climate-change impacts. Simulations are performed by identifying the relevant economic variables and imposing changes in some model parameters, like:
• Variations in endowments of primary resources. For example, effects of sea-level rise can be simulated by reducing stocks of land and capital (infrastructure).
• Variations in productivity. Effects of climate change on human health can be simulated through changes in labour productivity. Effects on agriculture can be simulated through changes in crop productivity.
• Variation in the structure of demand. Although demand is typically endogenous in a general equilibrium model, shifting factors can capture changes in demand not induced by variations in income or prices. In this way, it is possible to simulate: changing energy demand for heating and cooling, changing expenditure on medical services, changing demand for services generated by tourists, etc.
Comparative static CGE models can usefully highlight the structural adjustments triggered by climate-change impacts, by comparing a baseline equilibrium at some reference year with a counterfactual one, obtained by shocking a set of parameters. In a dynamic model like ICES, parameters are varied in a similar way, but in each period of the sequence of temporary equilibria.
We show results at yearly time steps, from 2002 to 2100. In each period, the model solves for a general equilibrium state in which capital and debt stocks are “inherited” from the previous period and, in addition, exogenous dynamics is introduced through changes in primary resources and population. Then, impacts are simulated by ‘spreading’ the climate-change effects over the whole interval 2002–2100. For example, changes in crop productivity are related to changes in temperature and precipitation. As temperature progressively rises over time, wider variations are imposed on the model productivity parameters.Footnote 9
In this way, the model generates two sets of results: a baseline growth path for the world economy, in which climate-change impacts are ignored; and a counterfactual scenario, in which climate-change impacts are simulated. The latter scenario differs from the basic one, not only because of the climate shocks, but also because exogenous and endogenous dynamics interact, and climate change ultimately affects capital and foreign debt accumulation.
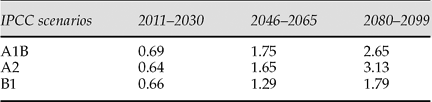
All shocks have been computed by considering an increase in global average temperature of 1.5°C for 2050 and 3.03°C for 2100 with respect to 1980–1999, which is in line with IPCC estimates (table 2).Footnote 10
Projected global mean warming (°C) wrt 1980–1999

Source: IPCC (2007).
Of course, results are dependent on exogenous scenarios of population, labour productivity, climate change, etc. However, we focus here on the differences between two growth paths, with and without climate impacts, which are based on the same baseline dynamics. It is also clear that the world economy will be affected in the future by factors and shocks different from climate change, thus our results should not be interpreted as forecasts.
We consider here five climate-change impacts related to agriculture, energy demand, human health, tourism and sea-level rise. In all cases, we adapt for the dynamic model some input data previously used in static CGE models.
Agricultural impact estimates are based on Tol (Reference Tol2002a, Reference Tolb), who extrapolated changes in specific yields for some scenarios of climate change and temperature increase. This impact has been modelled in ICES through exogenous changes in the productivity of land, devoted to different crops.
To evaluate how energy demand reacts to changing temperatures, we use demand elasticities from De Cian et al. (Reference De Cian, Lanzi and Roson2007). This study investigates the effect of climate change on households' demand for different energy commodities. Variations in residential energy demand are implemented through exogenous shifts in the households' demand.
Two impacts related to human health are considered: variation in working hours, reflecting changes in mortality and morbidity (modelled through productivity changes), and variation in the expenditure for health care services, undertaken by public administrations and private households (Bosello et al., Reference Bosello, Roson and Tol2006). Health impacts related to six classes of climate-related diseases (malaria, dengue, schistosomiasis, diarrhoea, cardiovascular and respiratory) are included in the model, through labour productivity variations and shifts in the demand for public and private health services.
Coastal land loss due to sea-level rise (SLR) was estimated by elaborating results from the Global Vulnerability Assessment (Hoozemans et al., Reference Hoozemans, Marchand and Pennekamp1993), integrated with data from Nicholls and Leatherman (Reference Nicholls, Leatherman, Strzepek and Smith1995), Nicholls et al. (Reference Nicholls, Leatherman, Dennis and Volonte1995), Bijlsma et al. (Reference Bijlsma, Ehler, Klein, Kulshrestha, McLean, Mimura, Nicholls, Nurse, Perez Nieto, Stakhiv, Turner, Warrick, Watson, Zinyowera and Moss1996) and Beniston et al. (Reference Beniston, Tol, Delecolle, Hoermann, Iglesias, Innes, McMicheal, Martens, Nemesova, Nicholls, Toth, Watson, Zinyowera and Moss1998). The methodology and some results are illustrated in Bosello et al. (Reference Bosello, Roson and Tol2006). The inclusion of SLR in ICES is simulated by exogenously reducing the amount of the primary factor ‘land’ in all regions.
Finally, climate-change impacts on tourism are obtained from the Hamburg Tourism Model (HTM) (Bigano et al., Reference Bigano, Hamilton and Tol2005), which is an econometric model that estimates tourism flows on the basis of average temperature, coastal length, population, prices and income. Changes in tourism flows are accommodated in the CGE model in two ways. First, as in the case of energy and health impacts, a shifting factor induces exogenous variations in the households' demand for domestic market services, at constant prices and income. The exogenous change amounts to the estimated variation in expenditure by tourists. Second, national incomes are adjusted, to account for the purchasing power of foreign tourists.
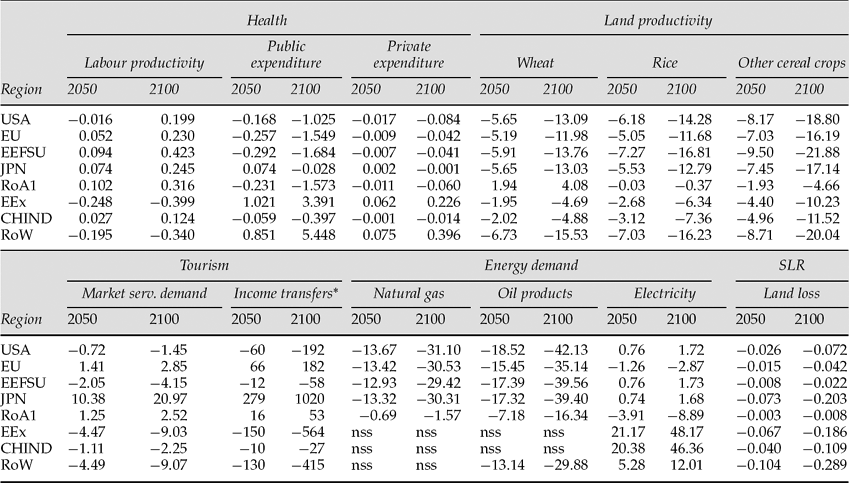
Table 3 summarizes the exogenous shocks introduced in the model to simulate the climate-change impacts.Footnote 11 Net Energy Exporters (EEx) and the Rest of the World (RoW) are negatively affected by a reduction of labour productivity and an increase in medical expenditure, while other regions appear to benefit from climate-change impacts related to human health (see also Bosello et al. (Reference Bosello, Roson and Tol2008) for further discussion). For agriculture, except for the case of wheat in the Rest of Annex 1 countries (RoA1), land productivity is reduced by climate change. EEx and RoW experience the strongest reduction in tourism demand, since countries in these regions will have quite hot climates. Tourists would then prefer milder locations, like Japan.
Parameters variation in the climate-change scenario for 2050 and 2100 in percentage with respect to 2001

*2001 US$ billion, nss: not statistically significant.
Estimates for residential energy demand show a general reduction in natural gas and oil demand (for heating), while impacts on electricity demand are not very relevant, except for EEx and China and India (CHIND), where a substantial increase is estimated (for cooling). In the case of sea-level rise, all regions suffer some land losses, although the share of lost land is relatively small.
4. Simulation results
We present here the simulation results, by focusing on the differences between the baseline (without climate-change impacts) and the climate-change-impact scenarios. Our aim is twofold: to assess the economic consequences of climate change on growth and income distribution in the world, and to verify whether considering the climate-change feedback on economic scenarios brings about significant variations in estimates of emissions of greenhouse gases.
Let us first consider each of the five impacts separately, by looking at the differences generated between the two scenarios in the regional GDP. We shall not describe in detail the data and the mechanisms behind the single impacts, as these are illustrated and discussed elsewhere (Berritella et al., Reference Berrittella, Bigano, Roson and Tol2006; Bosello et al., Reference Bosello, Roson and Tol2006, Reference Bosello, De Cian and Roson2007a, Reference Bosello, Roson and Tolb; Bosello and Zhang, Reference Bosello and Zhang2006). Our interest here is in the interaction between the exogenous dynamics of changes in model parameters (simulating the effects of climate change) and the endogenous dynamics of capital and debt accumulation.
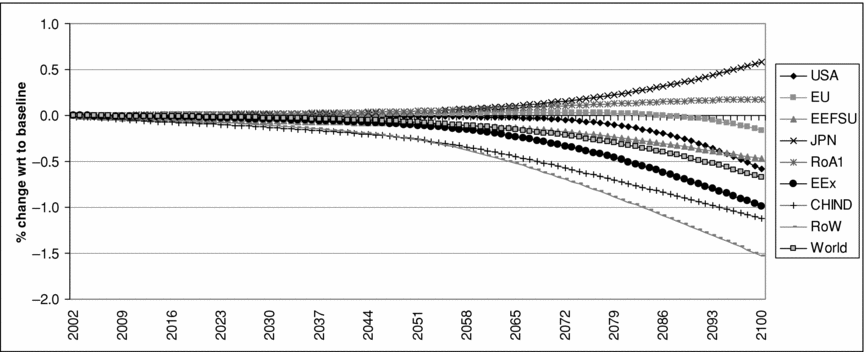
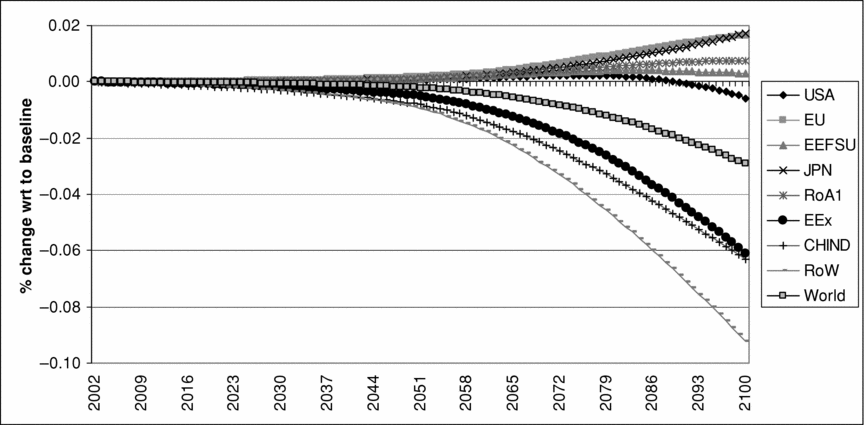
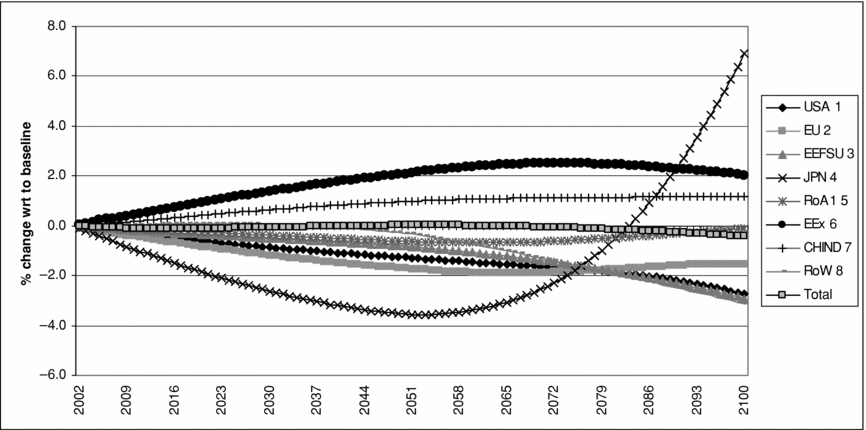
Figure 2 presents differences in real GDP in the period 2002–2100, due to the effects of climate change on agriculture, obtained by simulating a progressive change in land productivity. The general reduction in land productivity hits more severely some agriculture-based and relatively poorer economies, while developed regions get some benefits, primarily because of positive changes in the terms of trade.
Agriculture impacts – differences in regional GDP

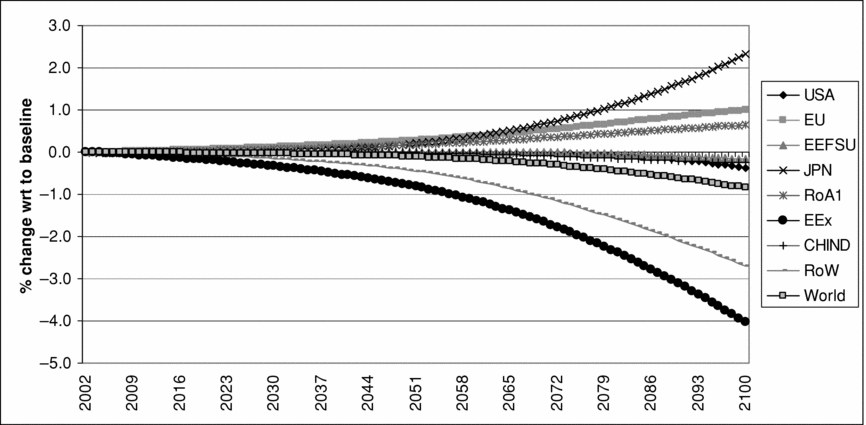
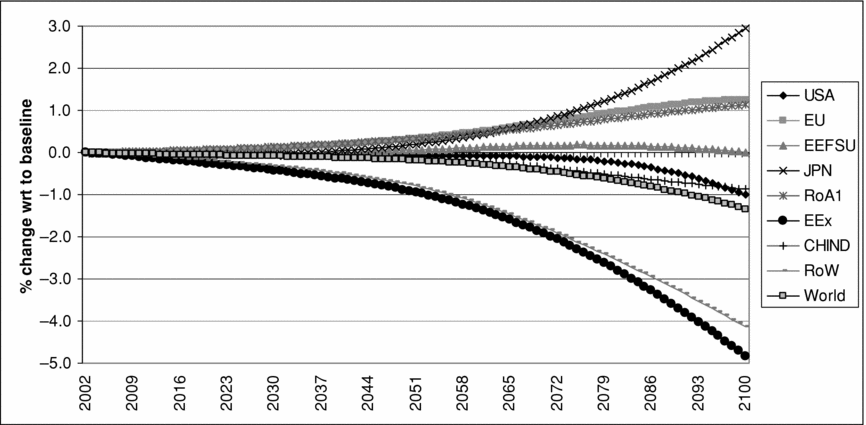
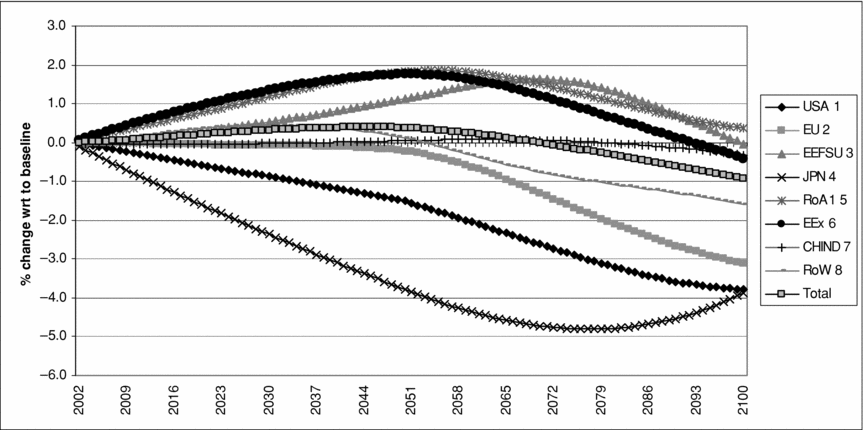
Figure 3 shows a similar picture, referring to climate-change impacts on energy demand. Here we have a more differentiated picture: some regions lose, some others gain, whereas the world average is about the same. This should be expected, because of the nature of the shock, which modifies the structure of demand without affecting the endowments of primary resources.
Energy demand impacts – differences in regional GDP

To better understand the results of the energy demand shock, it is necessary to take into account the role of the terms of trade. Consider, for example, the case of energy exporting countries (EEx). This region suffers from an adverse shock in the terms of trade. This means that more exports are needed to pay for imports: real GDP increases, but nominal GDP (and welfare) decrease.
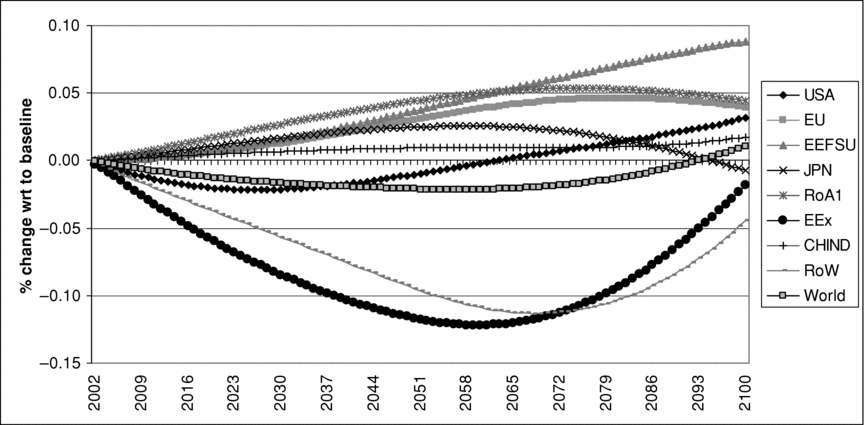
Figure 4 illustrates the dynamic effect of climate-change impacts on labour productivity and health services expenditure. Two regions, which are the poorest in the world, experience losses, whereas the remaining regions get small benefits. The magnitude of the GDP variations is small, but we are considering here only monetary costs/gains of health impacts, disregarding the possible existence of catastrophic events.
Human health impacts – differences in regional GDP

Notice the shape of the curves. This suggests that direct impacts of climate change and the indirect impacts of capital accumulation are opposite. In other words, when labour productivity decreases, because of higher incidence of some diseases, returns on capital get relatively higher, as demand for capital services increases (capital supply is fixed in the short run). Higher returns attract foreign investment. The initial negative effect of lower labour productivity is progressively compensated by higher regional economic growth.
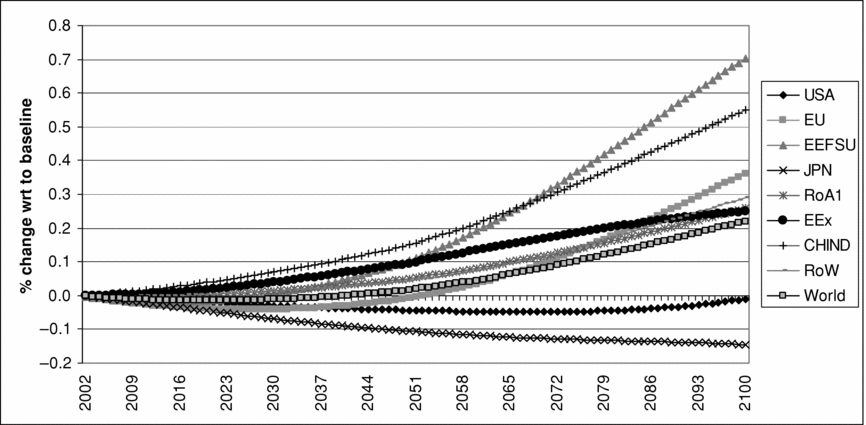
Figure 5 illustrates tourism impacts. Although the shape of the curves is different from that in figure 4, the regional distribution of gains and losses is quite similar. This suggests that most factors which make a region unhealthy also make the same region less attractive as a tourist destination. However, the absolute value of impacts on GDP is much larger here, particularly in poor regions, where tourism is a sizeable industry.
Tourism impacts – differences in regional GDP

Figure 6 shows the impact of sea-level rise, generating losses of agricultural land, in the absence of any protective investment. Variations are quite limited, as land losses are quite small in the aggregate. Again, poorer regions are the ones which experience the most significant reductions in GDP.
Sea-level impacts – differences in regional GDP

Figure 7 presents percentage variations in GDP generated by the joint action of all the impacts together. Notice that the total effect is not just the sum of all individual effects, as the various impacts interact and affect the endogenous growth mechanism.Footnote 12 We can see that the overall impact is fairly large, and the distributional consequences are significant, making the poorest countries worse off. In other words, climate change works against equity and income convergence in the world.
Joint impacts – differences in regional GDP

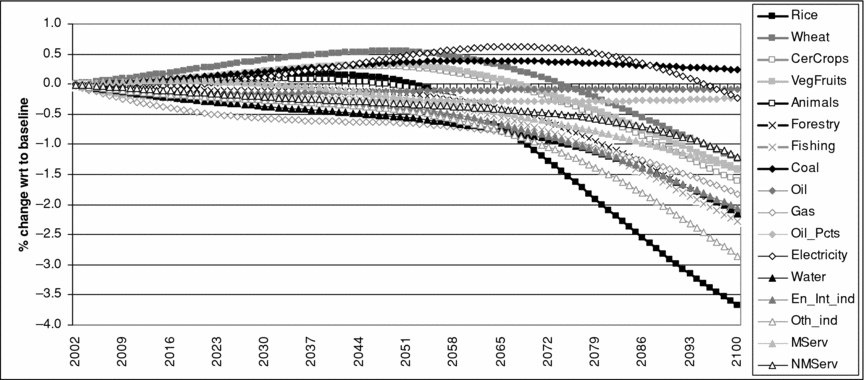
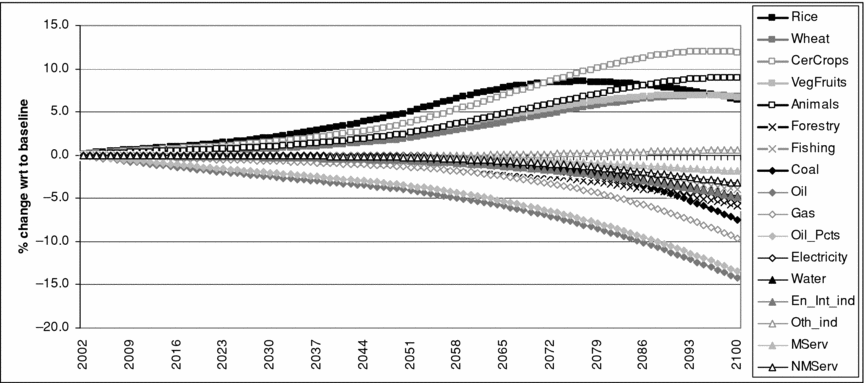
Figures 8 and 9 show the industrial effects. Figure 8 presents the percentage deviations in the physical output of the various industries, whereas figure 9 presents the corresponding variations in prices. Significant reductions are observed in the Forestry, Fishing, Gas, Rice, Energy-Intensive and Other Industries. Prices increase in most agricultural industries, particularly in Rice and Animals, whereas prices are lower in the energy sector, most notably for Oil, Oil Products and Gas.
Differences in (global) industrial output

Differences in industrial world prices

An interesting question is whether emissions of greenhouse gases are affected by the changing growth of the world economy. ICES produces estimates of carbon dioxide (CO2), nitrous oxide (N2O) and methane (CH4). Figures 10–12 illustrate the percentage changes for these three GHGs between the two scenarios.
Differences in regional CO2 emissions

Differences in regional N2O emissions

Differences in regional CH4 emissions

Although emissions increase in some countries and decrease in some other countries, there are quite small global variations. More precisely, considering the different size and baseline volume of emissions, total emissions of greenhouse gases turn out to be slightly smaller once the climate-change feedback on the economy is taken into account.
Carbon dioxide emissions increase in developing regions despite reductions in the GDP, especially in China and India (CHIND) and energy exporting countries (EEx). Since CO2 emissions are linked to energy consumption, this means that lower income in those regions is not associated with lower energy consumption. This is clearly due to the climate-change impacts on electricity demand (see table 3). The opposite occurs for developed countries, where a higher GDP is associated with a reduction in carbon emissions, with the exception of Japan.
To better understand how these results are obtained, it is necessary to consider what drives the different emissions. Emissions are linked to consumption or production levels. For example, CO2 emissions are related to energy consumption. If CO2 emissions do not change significantly, this means that energy consumption is not significantly lower at the global level.
This is indeed confirmed by results displayed in figure 8, where one may notice that global production for energy production industries (Coal, Gas, Oil Products, Electricity) varies very little. It is very interesting to compare this result with the one highlighted in figure 9, where it may be noticed that world prices for energy industries actually decrease.
The combination of almost constant production quantities and declining prices has a simple economic interpretation: the overall effect of climate change in this sector is a downward shift in global demand, associated with a quite steep (rigid, vertical) supply curve. The relative shape and position of supply and demand in each market depends on the model assumptions and parameter estimates, most notably on the functional forms adopted and on the elasticities of substitution. Different hypotheses would, of course, bring about different results.Footnote 13
Figures 11 and 12 show the analogous variations of N2O and CH4 emissions. Similar reasoning applies for the interpretation of the regional differences. Notice, however, that the negative global variation in the final year (2100) is more significant.
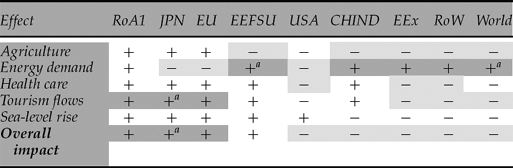
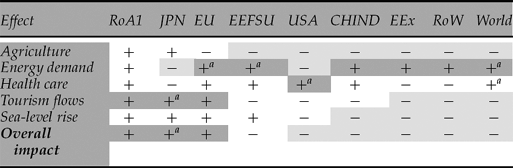
Tables 4 and 5 provide a summary of all impacts (separately and jointly) on regional GDP for the years 2050 and 2100, respectively. The aggregate effect of climate change is negative, but some regions are expected to gain. Some of them, notably Japan and the European Union, experience negative impacts at first, which turn positive by the end of the century.
Summary of impacts in regional real GDP (2050)

aNegative at the beginning of the period,  Significant positive impact
 Significant negative impact.
Summary of impacts in regional real GDP (2100)

aNegative at the beginning of the period, Significant positive impact Significant negative impact
5. Conclusions
Climate change affects the world economy in many different ways. Using a dynamic general equilibrium model, we have been able to analyse the second-order, system-wide effects of climate-change impacts and their consequences on growth. This is an important innovation, because previous studies have ignored the potentially important interaction between exogenous shocks on the economic system, due to climate change, and endogenous capital and foreign debt accumulation processes.
We found that macroeconomic effects are sizeable but, most importantly, there are significant distributional effects at the regional and industrial level. In particular, we found that climate change works against equity and income convergence in the world. This result is perfectly consistent with Dell et al. (Reference Dell, Jones and Olken2008), though it uses a completely different methodology, based on numerical general equilibrium modelling of the global economy, rather than on the establishment of basic facts about the climate–economy interaction.
Furthermore, we have been able to recognize a number of potential causal mechanisms, whereas the study above only limits the analysis to documenting reduced-form relationships.
The interaction between endogenous and exogenous dynamics generates non-linear deviations of growth paths from the baseline. Also, endogenous dynamics may amplify exogenous shocks, or counteract them, possibly reversing the sign of the effects (e.g., on regional GDP) in the long run.
Turning to GHGs emissions, on the one hand climate-change impacts affect only slightly the level of global emissions over time, being a bit lower than those in the baseline scenario; on the other hand, relevant differences exist at the regional and sectoral level, driven by the impacts and consequent agent's reactions to them.