INTRODUCTION
Red pea (Lathyrus cicera L.) is a N-fixing, cool-season, drought-tolerant, annual legume grown for forage and grain (Hanbury et al., Reference Hanbury, White, Mullan and Siddique2000). In addition, red pea is a candidate crop to provide protein and starch for human diets and animal feed in many areas of the world including south-western Europe, West Asia, North Africa, and Australia (Larbi et al., Reference Larbi, El-Moneim, Nakkoul and Hassan2010). Moreover, this crop has the capability to tolerate harsh growth conditions and can be adapted to low-input agriculture and to marginal agricultural lands (Patto et al., Reference Patto, Skiba, Pang, Ochatt, Lambein and Rubiales2006). Despite the fact that red pea has high protein-rich grain its use is constrained because of the presence of a neurotoxic nonprotein amino acid, β-N-oxalyl-α-β-diaminopropionic acid (β-ODAP) which can cause lathyrism in humans and animals (Getahun et al., Reference Getahun, Lambein, Vanhoorne and Vander Stuyft2003; Spencer et al., Reference Spencer, Ludolph, Dawivedi, Roy, Hugon and Shamburg1986). As a result its use as a grain crop is limited and thus red pea is mainly cultivated for silage or hay production that has low quantity of β-ODAP (Hanbury et al., Reference Hanbury, White, Mullan and Siddique2000).
Intercropping is a practice that is used in low-input cropping systems especially in the developing countries but it started to be adopted in many developing countries because of the increase in fossil fuel and fertilizer prices (Ghosh et al., Reference Ghosh, Bandyopadhyay, Wanjari, Manna, Misra, Mohanty and Subba Rao2007). In addition, there is a growing interest in many developed countries for using different intercropping systems because of serious problems caused by the intensification of the modern agriculture. It is well known that intercropping systems have several advantages such as improved soil conservation, control of weeds, insects, or diseases, improved yield stability of cropping systems, better water and nutrient use efficiency (Ghosh et al., Reference Ghosh, Bandyopadhyay, Wanjari, Manna, Misra, Mohanty and Subba Rao2007; Vasilakoglou et al., Reference Vasilakoglou, Dhima, Lithourgidis and Eleftherohorinos2008). Furthermore, intercropping red pea with cereals could be an alternative method for further reduction of β-ODAP.
Seeding rates are very important for an intercropping system as it affects its productivity and forage quality. Several researchers used different seeding ratios of cereals and legumes in different intercropping combinations and some cases they did not find any significant DM and N yield benefit (Hauggaard-Nielsen et al., Reference Hauggaard-Nielsen, Gooding, Ambus, Corre-Hellou, Crozat, Dahlmann, Dibet, Von Fragstein, Pristeri, Monti and Jensen2009; Karadag and Buyukburc, Reference Karadag and Buyukburc2004). In contrast, Izaurralde et al. (Reference Izaurralde, Juma and McGill1990) found a significant increase in DM yield by increasing the legume planting density. Generally, cereal seems to be more competitive for soil inorganic N compared to legumes that are used in intercropping (Jensen, Reference Jensen1996) due to faster and deeper root growth and higher N demand of the cereal (Corre-Hellou and Crozat, Reference Corre-Hellou and Crozat2005). On the other hand, legumes are often less competitive than cereal species and may require higher planting densities relative to cereals to achieve intercropping benefits (Lithourgidis et al., Reference Lithourgidis, Dordas, Damalas and Vlachostergios2011a).
One of the most important factors that can have a significant impact on yield of intercropping systems compared with the monocrops is competition between the different intercropping components (Banik et al., Reference Banik, Sasmal, Ghosal and Bagchi2000; Ghosh, Reference Ghosh2004). It is difficult to design an efficient intercropping system due to the unpredictable outcome of competitive interactions between component species. Several indices such as land equivalent ratio (LER), relative crowding coefficient (RCC), competitive ratio (CR), aggressivity (A), actual yield loss (AYL), monetary advantage (MA), and intercropping advantage (IA) have been developed to describe competition and economic advantage in intercropping, which they can help us for selecting the best intercrop (Banik et al., Reference Banik, Sasmal, Ghosal and Bagchi2000; Ghosh, Reference Ghosh2004; Mead and Willey, Reference Mead and Willey1980; Odo Reference Odo1991).
Although legumes-cereals intercrops have been frequently studied, no studies have red pea as a legume component in intercropping system with winter cereals. Therefore, the objectives of the present work were: (i) to evaluate red pea, barley, and triticale monocrops as well as red pea-barley and red pea-triticale intercrops in two seeding ratios for DM and protein yield, (ii) to estimate the effect of intercropping on the growth rate of the three species, (iii) to assess the effect of competition among the component species, and (iv) to calculate the economic advantage of each intercropping system.
MATERIALS AND METHODS
Study site and crop management
A field experiment over two growing seasons (2008–09 and 2009–10) was established at the Fodder Crops and Pastures Institute (Larissa, Greece) on clay soil with pH 7.5, organic matter concentration 1.2%, P (Olsen) 14 ppm, and CaCO3 1.3% (0 to 30 cm depth). Previous year the crop cultivated in the same field was durum wheat. Before seeding, the cultivation area was moldboard plowed and harrowed. Red pea (cv. Rhodos) and two winter cereal monocrops, barley (cv. Thessaloniki), and triticale (cv. Thisvi) as well as mixtures of red pea with each of the above cereals in two seeding ratios (i.e. 60:40 and 80:20) based on seed weight were sown in the last week of November in both growing seasons. The seeding rates for red pea, barley and triticale monocrops were 150 kg ha−1 for each species, that corresponds to 200, 448 and 459 seeds per m2 respectively. The seeding rates for intercrops were 90 and 60 kg ha−1 for the 60:40 seeding ratio and 120 and 30 kg ha−1 for the 80:20 seeding ratio (red pea -cereal), while the corresponding seeding rate was 120 and 180 seeds per m2 of red pea and cereal respectively for the 60:40 seeding ratio, and 160 and 126 seeds per m2 of red pea and cereal respectively for the 80:20 seeding ratio. The two ratios that were used are representative of the ratios used in other intercropping systems and are appropriate for forage production (Caballero et al., Reference Caballero, Goicoechea and Hernaiz1995; Dordas et al., Reference Dordas, Vlachostergios and Lithourgidis2012; Heidari et al., Reference Heidari, Azizi, Mofrad and Ahmadi2011; Lithourgidis and Dordas Reference Lithourgidis and Dordas2010; Santalla et al., Reference Santalla, Casquero and de Ron1999; Xu et al., Reference Xu, Xu, Huang, Shan and Li2011). The row spacing was 25 cm and seeds of both species were sown simultaneously. The experimental design was a randomized complete block with seven treatments (three monocrops and four mixtures of red pea with cereals) replicated three times. Plot size was 4 m × 1 m and plots were separated by a 1 m buffer zone. All crops were kept free of weeds by implementing hand hoeing, where necessary. The same field was used in both years of the experimentation. No effect of autotoxicity in red pea was observed as most plant residues were removed from the field in the end of the experiment. The experiment was not irrigated. The weather conditions during the 2009 and 2010 growing seasons were quite similar. Rainfall was 321 mm and 306 mm for 2009 and 2010 growing seasons respectively (Figure 1).
Monthly rainfall and mean air temperature during the two growing seasons of the experimentation.

Sampling for growth rate and dry matter determination
Red pea and cereals were harvested in a 0.5 m2 area of each plot at four different time periods: 0, 3, 6, and 9 weeks after tillering (WAT) of cereals which were at tillering, jointing, booting and milk stage, respectively. While red pea was at stem elongation, first flower open, development of pod and ripening of pod at the same time periods, respectively. In particular, plants were cut to the ground level with manual shears and separated by hand to determine fresh weight of each species in each plot. For forage yield determination, plants in monocrops and in mixtures were harvested at the pod-setting stage of red pea (approximately at milk stage of cereals) about mid-May of each growing season. At that time, samples from a 2 m2 area of each plot were cut to the ground level and separated for the determination of final yield and also of red pea percentage. The samples (0.5 kg biomass for each species) were dried at 65°C to constant weight to determine the relative water content. After the dry matter was determined the forage yield was calculated on a 650 g kg−1 water basis of the dry matter.
Crude protein concentration, yield and N utilization efficiency (NUtE)
For forage quality at harvest, dried samples were ground with a Wiley mill to pass a 1-mm screen and analysed for crude protein (CP) concentration. Total N was determined using the Kjeldahl method and CP was calculated by multiplying the N content by 6.25. N utilization efficiency (NUtE) for biomass accumulation was calculated according to the following formula NUtE = DM/N (López-Bellido and López Bellido, Reference López-Bellido and López-Bellido2001), where DM is the dry matter at harvest and N is the total N that was taken up by the crop both based on the same area of land (m2).
Evaluation of intercropping systems using competition indices
The advantage of intercropping and the effect of competition between the two species used in a mixture were estimated using different competition indices as follows:
-
i) The land equivalent ratio (LER), which used as the criterion for mixed stand advantage. In particular, LER indicates the efficiency of intercropping for using the environmental resources compared with monocropping. The value of unity is considered the critical value for this index. When LER is greater than one the intercropping favours the growth and yield of the intercropped species, whereas when LER is lower than one the intercropping negatively affects the growth and yield of the species (Mead and Willey, Reference Mead and Willey1980). The LER was calculated as:
 \begin{equation*}
{\rm LER} = ({\rm LER}_{{\rm rp}} + {\rm LER}_c ),\;{\rm where}\;{\rm LER}_{{\rm rp}} = (Y_{{\rm rpi}} /Y_{{\rm rp}} )\;{\rm and}\;{\rm LER}_c = (Y_{{\rm ci}} /Y_c ).
\end{equation*}
The Y rp and Yc are the yields of red pea and cereal, respectively, as monocrops and Y rpi and Y ci are the yields of red pea and cereal, respectively, as intercrops.
-
ii) The relative crowding coefficient (K), which is a measure of the dominance of one species over the other in a mixture (Gosh, Reference Ghosh2004). The K was calculated as:
\begin{eqnarray*}
&&K = K_{{\rm rp}} \cdot K_c ,\;{\rm where}\;K_{{\rm rp}} = Y_{{\rm rpi}} Z_{{\rm ci}} /(Y_{{\rm rp}} - Y_{{\rm rpi}} )Z_{{\rm rpi}} \; \\
&&{\rm and}\; K_c = Y_{{\rm ci}} Z_{{\rm rpi}} /(Y_c - Y_{{\rm ci}} )Z_{{\rm ci}}
\end{eqnarray*}
The Z rpi is the sown proportion of red pea in mixture and Z ci the sown proportion of cereal in mixture. When K is greater than one there is a yield advantage, when K is equal to one there is no yield advantage, and when it is less than one there is a disadvantage in efficient resource use resulting in relative yield loss.
-
iii) Aggressivity, which often used to indicate how much the relative yield increase in ‘a’ crop is greater than that of ‘b’ crop in intercropping (Lithourgidis et al., Reference Lithourgidis, Vlachostergios, Dordas and Damalas2011b). The aggressivity is derived from the equations:
if Ac = 0, both crops are equally competitive, if Ac is positive then the cereal species is dominant, if Ac is negative then the cereal species is the dominated species.
\begin{equation*}
A_c = (Y_{{\rm ci}} /Y_c Z_{{\rm ci}} ) - (Y_{{\rm rpi}} /Y_{{\rm rp}} Z_{{\rm rpi}} )\;{\rm and}\;A_{{\rm rp}} = (Y_{{\rm rpi}} /Y_{{\rm rp}} Z_{{\rm rpi}} ) - (Y_{{\rm ci}} /Y_c Z_{{\rm ci}} ),
\end{equation*}
-
iv) Competitive ratio (CR), which is another way to assess the competition between different species. The CR gives a better measurement of competitive ability of the crops and also is more advantageous as an index over K and aggressivity. The CR represents simply the ratio of individual LERs of the two component crops and takes into account the proportion of the crops in which they are initially sown. The CR is calculated according to the following formula (Ghosh, Reference Ghosh2004):
\begin{equation*}
{\rm CR}_{{\rm rp}} = ({\rm LER}_{{\rm rp}} /{\rm LER}_c )(Z_{{\rm ci}} /Z_{{\rm rpi}} ),\;CR_c = ({\rm LER}_c /{\rm LER}_{{\rm rp}} )(Z_{{\rm rpi}} /Z_{{\rm ci}} )
\end{equation*}
-
v) System productivity index (SPI), which standardizes the yield of the secondary crop (cereal) in terms of the primary crop (red pea) (Agegnehu et al., Reference Agegnehu, Ghizaw and Sinebo2006) and is calculated as:
where Sc and S rp are the mean yield of cereal and red pea in monocrop and Yc and Y rp are the mean yield of cereal and red pea in mixed culture.
\begin{equation*}
{\rm SPI} = \left[ {\left( {S_c /S_{{\rm rp}} } \right)\;\cdot\;Y_{{\rm rp}} } \right] + Y_c
\end{equation*}
-
vi) Actual yield loss (AYL). The AYL is the proportionate yield loss or gain of intercrops compared with the respective monocrop, i.e. it takes into account the actual sown proportion of the component crops with their pure stand. In addition, partial actual yield loss (AYLrp or AYL c ) represent the proportionate yield loss or gain of each species when grown as intercrops relative to their yield in pure stand. The AYL is calculated according to the following formula (Banik et al., Reference Banik, Sasmal, Ghosal and Bagchi2000):
where
\begin{equation*}
{\rm AYL} = {\rm AYL}_{{\rm rp}} + {\rm AYL}_c ,
\end{equation*}
\begin{equation*}
{\rm AYL}_{{\rm rp}} = \left\{ {\left[ {\left( {Y_{{\rm rpi}} /Z_{{\rm rpi}} } \right)/\left( {Y_{{\rm rp}} /Z_{{\rm rp}} } \right)} \right] - 1} \right\},\;{\rm and}\;{\rm AYL}_c = \left\{ {\left[ {\left( {Y_{{\rm ci}} /Z_{{\rm ci}} } \right)/\left( {Y_c /Z_c } \right)} \right] - 1} \right\}
\end{equation*}
The AYL can have positive or negative values indicating an advantage or disadvantage accrued in intercrops when the main objective is to compare yield on a per plant basis.


Economic indices
The monetary advantage index (MAI) and the IA index provide information about the economic advantage of an intercropping system. These indices were calculated according to Banik et al. (Reference Banik, Sasmal, Ghosal and Bagchi2000) and Ghosh (Reference Ghosh2004) as follows:
 \begin{eqnarray*}
{\rm MAI} &=& ({\rm value}\;{\rm of}\;{\rm combined}\;{\rm intercrops}) \times ({\rm LER} - 1)/{\rm LER} \\
{\rm IA} &=& {\rm IA}_c + {\rm IA}_{{\rm rp}} ,\;{\rm where}\;{\rm IA}_c = {\rm AYL}_c \;\cdot\;P_c \;{\rm and}\;{\rm IA}_{{\rm rp}} = {\rm AYL}_{{\rm rp}} \;\cdot\;P_{{\rm rp}}
\end{eqnarray*}
P rp is the commercial value of red pea silage (the current price is €35 per tn), and Pc is the commercial value of cereal silage (the current price is €28 per tn). Value of combined intercrops was calculated as: (Y rpi · P rp) + (Y ci · Pc ).
In any economic index like MAI and IA there is uncertainty about the prices of the agricultural products. Sensitivity analysis provides a good way of estimating the fluctuation of prices and provides a means of determining the influence of parameters on the conclusions that can be drawn and provides insight into the robustness of solutions and the factors influencing them (Finlayson et al., Reference Finlayson, Lawes, Metcalf, Robertson, Ferris and Ewing2012). A sensitivity analysis was performed to assess the outputs of the economic indices MAI and IA when the price of red pea and cereal fluctuates by ±10% which was estimated as possible fluctuation in the prices of the agricultural products in the area of experimentation.
Statistical analyses
The experiment was arranged in a randomized complete block design with seven treatments (three sole crops and four mixtures of red pea with cereals) replicated three times. The data were analysed by the ANOVA method according to a 2 × 7 factorial approach (growing season × treatments) with a split plot arrangement with 3 replications per treatment combination. The growing seasons were considered as the main plots and the seven treatments the split plots (Steel et al., Reference Steel, Torrie and Dickey1997). A combined analysis over growing season was carried out according to this experimental setup. LSD post hoc procedure was used for testing the differences between treatment means averaged over the two growing seasons, since no statistically significant interaction between growing seasons and treatments was detected (P = 0.353). In addition, the error variances from the two separate ANOVAs (one per growing season) were not statistically significant different according to the results of the F-test (P = 0.462).
Dry matter was measured at four sampling dates (0, 3, 6, and 9 WAT). For this trait the ANOVA was performed according to a split-split plot 2 × 7 × 4 experimental setup. Sampling dates were considered as the second split. Changes in cereals and red pea dry matter yield were evaluated by regressing dry matter yield of each plant species against sampling time. Linear, quadratic, hyperbolic, and logarithmic equations were tested for their suitability to describe the relationship between dry matter response and time. The equation with the highest value of the adjusted coefficient of determination (R 2 adj ) and the smallest standard error of estimate was selected as the most appropriate (Hair et al., Reference Hair, Anderson, Tatham and Black1995). In these regression equations, dry matter (t ha−1) was the dependent variable (y) and dates (weeks after tillering, WAT) the independent variable (x). All regression analyses were performed using 8 pairs of (x, y) values (four sampling date for each of the two growing seasons and the mean value of each sampling data over the two growing season are presented in the graphs). The significance level of all hypotheses testing procedures was preset at P < 0.05. MSTAT (1988, version 1.2) and SPSS (1998, version 17) software were used to perform the regression analysis and the analysis of variance (ANOVA), respectively.
RESULTS
ANOVA for the dry matter yield and the other characteristics showed that there was no treatment by growing season interaction, so the treatment means are presented averaged across growing seasons.
Growth rate
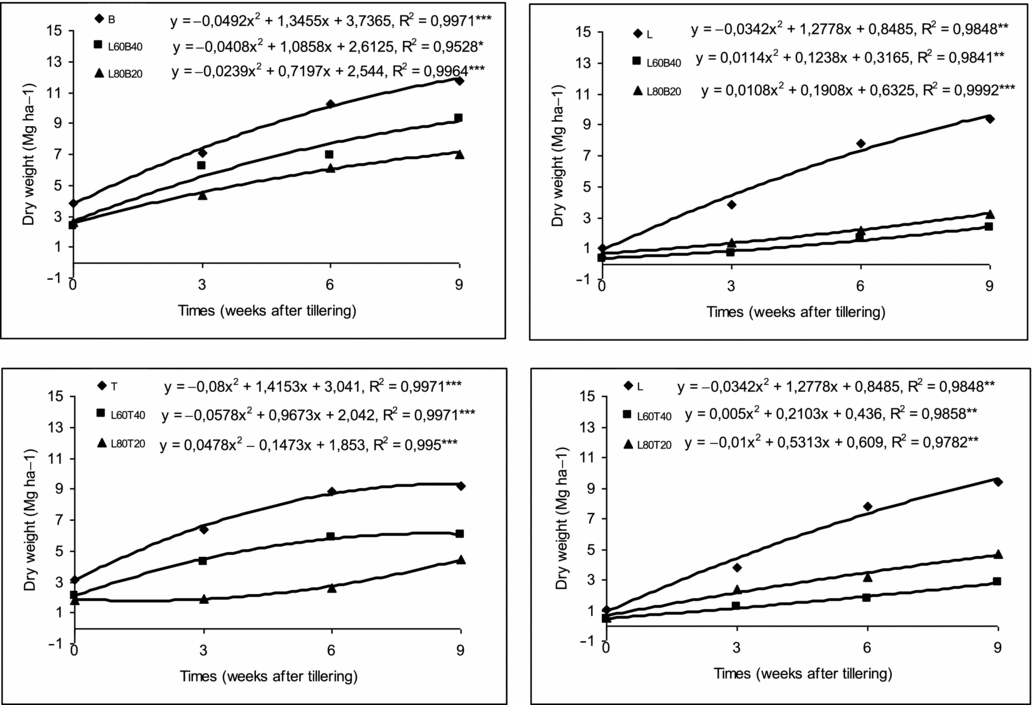
The dry matter yield of cereals and red pea was increased from 0 to 9 WAT. The R 2 comparisons among the models tested showed that the quadratic equation (y = a + bx − cx2 ) had the best fit for dry matter yield over time (Figure 2). In most cases, there was a decrease in the values α (initial growth) and b (growth rate) for the cereals as the red pea percentage increased in the intercrops (Figure 2). Also α and b for red pea increased in all mixtures as the red pea ratio increased. In addition, the initial growth of the two cereals was similar in monocrops (α value of 3.73 to 3.04), and the growth rate of barley and triticale in monocrops (b values 1.34 and 1.41 respectively) was similar with the red pea growth rate (1.28). Both cereals showed greater growth rate when they grew as monocrops than when grew in mixtures with red pea (Figure 2). Moreover, triticale was more affected than barley in intercrops and its growth rate decreased significantly at the highest red pea seeding ratio (80:20).
Temporal patterns in dry weight of monocultures and mixtures of red pea (Lathyrus cicera) with barley and triticale at two seeding ratios. Means are averaged over two growing seasons and three replicates. Lines describe linear and quadratic equations (y = a + bx, and y = a ± bx – cx2), (*, **, ***significant at the 0.05, 0.01 and 0.001 probability levels, respectively). L; red pea, B; barley, T; triticale, LB60:40; red pea-barley (60:40), LB80:20; red pea-barley (80:20), LT60:40; red pea-triticale (60:40), LT80:20; pea-triticale (80:20).

Dry matter yield and red pea contribution
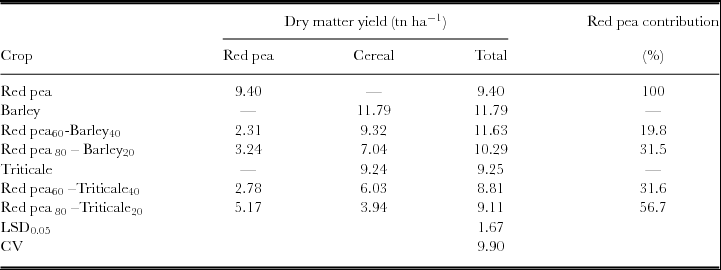
Pure stands of barley gave higher dry matter yield compared with red pea and triticale pure stands (Table 1). Also, the greatest dry matter yield was obtained from barley monocrop (11.79 tn ha−1) followed by the red pea-barley intercrops 60:40 (11.63 tn ha−1). In particular, intercrops of red pea with barley 60:40 produced on average about 25–27% more dry matter yield than red pea, and triticale monocrops, respectively, and about 29–34% more than the mixtures of red pea with triticale 60:40 and 80:20, respectively.
Dry matter yield for pure stands and mixtures of red pea (Lathyrus cicera) with barley and triticale in two seeding ratios (red pea-cereal 60:40 and 80:20, based on seed numbers). Means are averaged over two growing seasons.

Red pea was found to be in lower percentage in the mixtures than the expected percentage from the seeding ratio and it was particularly lower in the barley intercrops compared with the triticale intercrops (Table 1). In particular, the yield contribution of red pea was 19.8 (vs. 60%) and 31.5 (vs. 80%) in red pea-barley 60:40 and 80:20 intercrops, respectively, whereas the corresponding contribution of red pea was 31.6 (vs. 60%) and 56.7% (vs. 80%) in red pea with triticale intercrops.
Crude protein, N uptake and Nitrogen utilization efficiency
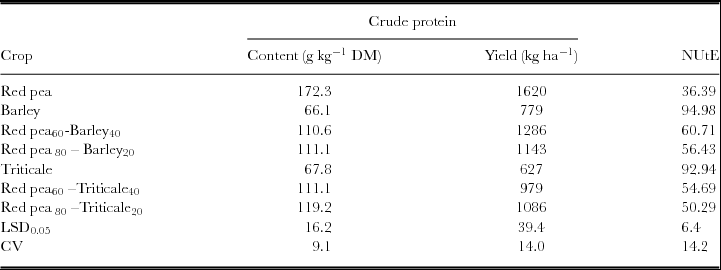
Crude protein concentration was the highest in the red pea monoculture (172.3 g kg−1 of DM) and in all red pea -cereal intercrops (110 to 119 g kg−1 of DM) (Table 2). On the other hand, barley and triticale monocultures had the lowest CP concentration (66.1 and 67.8 g kg−1 of DM, respectively). As regards the protein yield per area basis (CP yield), the highest protein yield was found in red pea monocrop and followed by the red pea-barley intercrop (60:40). Nitrogen utilization efficiency was lower in red pea monocrop (36.39) and in most red pea-cereal intercrops (50.29 to 60.71) than cereal monocrops (94.98 and 92.94 for barley and triticale respectively) (Table 2).
Crude protein and nitrogen utilization efficiency (NUtE) for monocrops and mixtures of red pea (Lathyrus cicera) with barley and triticale in two seeding ratios (red pea-cereal 60:40 and 80:20). Means are averaged over two growing seasons.

Competition indices
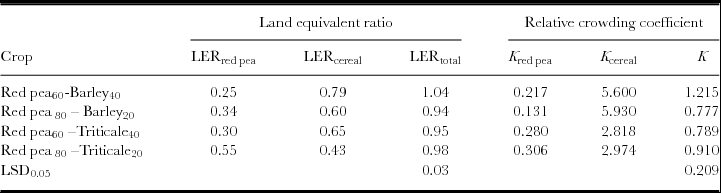
The LER value for red pea-barley mixture 60:40 was greater than one (1.04) (Table 3). On the other hand, total LER was similar to 1.00 in the case of red pea-triticale 80:20 mixture (0.98), whereas in other intercrops LER had values lower than one. In all cases, partial LER of red pea increased as the proportion of cereal decreased in the mixtures, whereas partial LER for cereals slightly decreased with increasing red pea seeding ratio in mixtures (Table 3).
Land equivalent ratio and relative crowding coefficient for monocrops and mixtures of red pea (Lathyrus cicera) with barley and triticale in two seeding ratios (red pea-cereal 60:40 and 80:20). Means are averaged over two growing seasons.

Relative crowding coefficient values followed a similar trend with the LER values. In particular, the K values were above one in the case of red pea-barley mixture 60:40 (1.215) (Table 3). Also, the partial K values of cereals were higher than partial K of red pea in all treatments and it was higher in barley than in triticale.
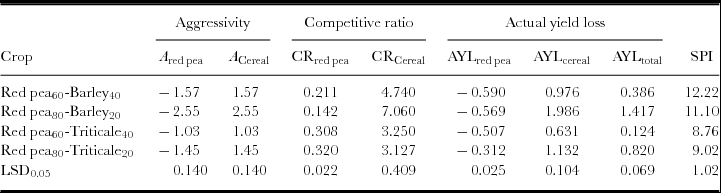
The results of aggressivity and competitive ratio conformed to those of the relative crowding coefficient. Cereal was the dominant species (Ac positive) in all mixtures (Table 4). Similarly, in these mixtures the CR c values were higher than the corresponding values of CRrp (Table 4).
Aggressivity, competitive ratio, actual yield loss and system productivity index for mixtures of red pea (Lathyrus cicera) with barley and triticale in two seeding ratios (red pea-cereal 60:40 and 80:20). Means are averaged over two growing seasons.

A similar trend to that of LER, aggressivity, CR, and K was also observed for AYL. In particular, AYLc was higher than AYLrp and also AYL c had positive values in red pea-cereal mixtures (Table 4). On the other hand, the partial AYL of red pea was negative. The AYL t values were positive and greater than 0 in all mixtures (Table 4).
The higher system productivity index (SPI) was found in red pea-barley mixtures (12.22 and 11.10 for 60:40 and 80:20 respectively) compared with the red pea-triticale mixtures (Table 4).
Economic indices
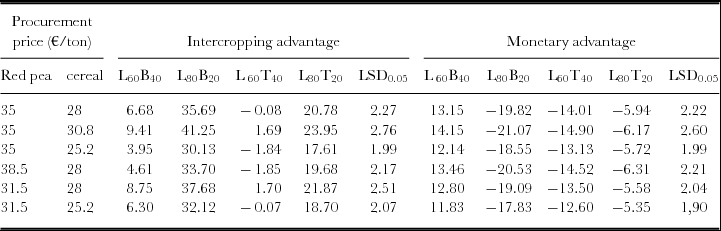
Sensitivity analysis showed that IA of most intercrops (with the exception of red pea-triticale 60:40 intercrop) were economic advantageous (positive values) (Table 5), regardless the fluctuation (±10%) of the procurement prices. In particular, IA was the highest in red pea-barley and red pea-triticale intercrops of 80:20 seeding ratio with IA +30.13 to +41.2 and 17.61 to +23.95, respectively, followed by red pea -barley 60:40 intercrop (+3.95 to +9.41). The lowest IA was found in red pea-triticale mixture 60:40 (−1.85 to +1.70). The MAI values were significantly positive only in the intercrop of red pea-barley at seeding ratio 60:40 (+11.83 to +14.15) and were negative in all other intercrops (Table 5).
Sensitivity analysis of intercropping advantage (IA) and monetary advantage index (MAI) for mixtures of red pea (Lathyrus cicera) with barley and triticale in two seeding ratios (red pea-cereal 60:40 and 80:20). Means are averaged over two growing seasons.

L; red pea, B; barley, T; triticale, LB60:40; red pea-barley (60:40), LB80:20; red pea-barley (80:20), LT60:40; red pea-triticale (60:40), LT80:20; pea-triticale (80:20).
DISCUSSION
Growth rate
One of the main findings of the present study is that different species were grown as monocrops showed greater growth rate than in intercrops and this could be attributed to cereal competition with the components of the intercrop (Assefa and Ledin, Reference Assefa and Ledin2001). Moreover, the less effect of triticale on growth rate of red pea than that of barley and the lowest dry matter proportion of red pea in intercrops with barley could be attributed to the fact that barley is more competitive species than triticale. In addition, as red pea was not studied before in an intercropping system, the results from this study show that red pea can be used successfully in an intercropping system. Especially, intercropping red pea with barley indicated higher dry matter yield and it is comparable with the yield from other intercropping systems like common vetch, faba bean and pea with winter cereals grown in the same area (Dordas et al., Reference Dordas, Vlachostergios and Lithourgidis2012; Lithourgidis and Dordas Reference Lithourgidis and Dordas2010; Lithourgidis et al., Reference Lithourgidis, Vasilakoglou, Dhima, Dordas and Yiakoulaki2006, Reference Lithourgidis, Vlachostergios, Dordas and Damalas2007).
Dry matter and pea contribution
The greatest dry matter yield was obtained from barley planted as monoculture followed by the red pea-barley intercrops. In addition, dry matter yields in all mixtures were similar than yields of each cereal in monoculture. In addition, dry matter yields were similar in both red pea and barley intercrops and red pea and triticale intercrops in different seeding ratios. Similarly, other researchers reported that dry matter yields in mixtures of legume with cereals were not affected by seeding ratios (Hauggaard-Nielsen et al., Reference Hauggaard-Nielsen, Gooding, Ambus, Corre-Hellou, Crozat, Dahlmann, Dibet, Von Fragstein, Pristeri, Monti and Jensen2009; Karadag and Buyukburc, Reference Karadag and Buyukburc2004). In contrast, Osman and Nersoyan (Reference Osman and Nersoyan1986) reported that the highest yield was found in legume-cereal mixtures at ratio 66:33 which had the highest proportion of legume in the mixtures tested. In many cases, it has been reported that yields of mixtures between legumes and cereals were intermediate or even lower than yields of monocultures due to competition between the intercropped species (Caballero et al., Reference Caballero, Goicoechea and Hernaiz1995; Vandermeer, Reference Vandermeer, Caroll, Vandermeer and Rosset1990).
The observed decrease of red pea contribution in dry matter of the mixtures could be attributed to competition between the two species when grown together, probably because the cereals produced many tillers and therefore showed higher competitive ability than red pea. Similarly, in other intercropping systems, such as cereals with faba bean or pea, a decrease in legume proportion more than the expected was reported as the cereal ratio increased in mixtures because cereals are more competitive than faba bean (Lithourgidis and Dordas, Reference Lithourgidis and Dordas2010) or pea (Dordas et al., Reference Dordas, Vlachostergios and Lithourgidis2012).
Crude protein, N uptake and Nitrogen utilization efficiency
CP concentration is an important quality characteristic of forage crops and is always used to evaluate a forage system and especially intercropping systems (Malézieux et al., Reference Malézieux, Crozat, Dupraz, Laurans, Makowski, Ozier-Lafontaine, Rapidel, de Tourdonnet and Valantin-Morison2009; Yolcu et al., Reference Yolcu, Polat and Aksakal2009). The highest CP concentration was found in red pea monoculture and red pea-cereal intercrops and the lowest in cereal monocrops, whereas there were no significant differences among red pea-cereal intercrops. Despite the fact that there was an increase of red pea contribution in the red pea –barley 80:20 and in red pea-triticale 80:20 intercropping systems there was no increase in the protein concentration. This can be because of the higher dry matter yield which can cause no change or even reduction in the concentration of CP because of the dilution effect that can have the increase in dry matter yield on CP concentration. Similar trend was found in other studies (Dordas and Lithourgidis Reference Dordas and Lithourgidis2012; Lithourgidis et al., Reference Lithourgidis, Dhima, Vasilakoglou, Dordas and Yiakoulaki2007). In most cases, CP yield per area basis followed a similar trend with the CP concentration, and it was the highest in red pea monocrop and followed by the red pea-cereal intercrops. Also, in intercrops there were significant differences in CP yield among each cereal monocrop and their respective intercrops with red pea. In contrast Li et al. (Reference Li, Sun, Zhang, Guo, Bao, Smith and Smith2006) found no significant differences in CP yield between legume-cereal intercrops and monocrops. However, the increase in CP content and yield due to legume contribution was reported in many other studies and this is one of the most important reasons for including a legume in an intercropping system (Berkenkamp and Meeres, Reference Berkenkamp and Meeres1987; Osman and Nersoyan, Reference Osman and Nersoyan1986).
Nitrogen utilization efficiency was the highest in cereal monocrops and this was because of the lowest N content and the higher dry matter yield in these monocrops. This means that cereal monocrops produced the highest biomass per kg of the taken up N than the other crops (Fageria and Baligar, Reference Fageria and Baligar2005). Therefore, the cereals require lower amount of N to produce the same amount of dry matter, which can be attributed to the higher N concentration in the pea tissues and to that most of the N that is taken up is through N fixation. Similarly, Dordas et al. (Reference Dordas, Vlachostergios and Lithourgidis2012) found that legumes produced the lower biomass and the NUtE was lower due to higher N uptake. Also, in red pea monocrop and in all mixtures the NUtE was lower than the cereal monocrops. This can be attributed to the higher N content of legumes and the lower biomass that they produce compared with the cereals (Caballero et al., Reference Caballero, Goicoechea and Hernaiz1995).
Competition indices
In most mixtures the LERrp was lower than 0.5, while the LERc was higher than 0.5, which indicates that there was an advantage for cereal in these intercropping systems and a disadvantage for the red pea on the basis of LER values (Mead and Willey, Reference Mead and Willey1980). Yield advantage of intercropping over pure stands in terms of total LER was greatest only in the case of red pea-barley mixtures (60:40) (1.04). This yield advantage of intercropping over pure stands can be due to better land utilization and better use of the environmental resources for plant growth (Banik et al., Reference Banik, Midya, Sarkar and Ghose2006). In particular, this means that up to 4% more land area would be required by a monocropping system to equal the yield of intercropping system, indicating greater land use efficiency of intercrops than monocrops (Agegnehu et al., Reference Agegnehu, Ghizaw and Sinebo2006; Midya et al., Reference Midya, Bhattacharjee, Ghose and Banik2005). Also, using mixtures with different grain legumes such as common vetch, faba bean, and pea and different winter cereals it was found that the LER values can be up to 1.23 (Agegnehu et al., Reference Agegnehu, Ghizaw and Sinebo2006; Dordas et al., Reference Dordas, Vlachostergios and Lithourgidis2012).
In a similar trend with LER, the total K was above one in the case of red pea-barley mixture (60:40) which indicates a definite yield advantage of this intercropping system (Banik et al., Reference Banik, Sasmal, Ghosal and Bagchi2000). In addition, in the red pea-triticale 80:20 mixture, the K value was not significantly different from one, which indicates that in these mixtures there was no yield advantage or disadvantage but in the case of red pea-barley 80:20 and red pea-triticale there was yield disadvantage (Ghosh, Reference Ghosh2004). Similarly, aggressivity and competitive ratio was higher in cereals compared with the red pea.
AYL gave more precise information than other indices about the competition between and within component crops and the behaviour of each species in intercropping. The AYL c had positive values in all mixtures, which indicates a yield advantage for cereals probably because of the positive effect of red pea on cereals in the intercrops (Banik et al., Reference Banik, Sasmal, Ghosal and Bagchi2000). AYL for red pea revealed that in all mixtures the cereal crop was the dominant one because the partial AYL of cereal was greater than the partial AYL of red pea. According to Banik et al. (Reference Banik, Sasmal, Ghosal and Bagchi2000), the AYL index can give more precise information than the other indices on the inter- and intra-specific competition of the component crops and the behaviour of each species involved in the intercropping systems. Quantification of dry matter yield loss or gain due to association with other species or the variation of the sowing density could not be obtained through partial LERs, whereas partial AYL shows the dry matter yield loss or gain by its sign and as well as its value. Thus, it was found a negative AYL for red pea and positive for cereals indicating increase in dry matter yield of cereals in the mixtures. The total AYL of all mixtures was positive, indicating an advantage of intercropping over pure stands (Banik et al., Reference Banik, Sasmal, Ghosal and Bagchi2000).
The highest system productivity index (SPI) was found in red pea-barley mixture 60:40 in which LER and K had also greater values. The values of SPI were high and largely determined by the red pea-barley intercrops which were not reduced much by intercropping indicating higher productivity of these intercrops (Agegnehu et al., Reference Agegnehu, Ghizaw and Sinebo2006; Lithourgidis et al., Reference Lithourgidis, Vlachostergios, Dordas and Damalas2011b).
Partial relative crowding coefficient, aggressivity, competitive ratio, and partial actual yield loss values clearly indicated cereal as dominant species in the intercrops of red pea with barley and triticale. Similarly, greater competitive ability of cereal to exploit resources in association with legume has been reported by other researchers (Banik et al., Reference Banik, Midya, Sarkar and Ghose2006; Dordas and Lithourgidis, Reference Dordas and Lithourgidis2012; Ghosh, Reference Ghosh2004).
Overall, taking into account LER, K, AYL, and SPI indices, the intercrop of red pea with barley at 60:40 seeding ratio indicated a yield advantage over intercrops due to better utilization of growth resources under red pea -cereal intercropping systems. Moreover, red pea showed a good adaptability and similar dry matter yield compared with other annual legumes grown in the same area (Lithourgidis et al., Reference Lithourgidis, Vasilakoglou, Dhima, Dordas and Yiakoulaki2006, Reference Lithourgidis, Vlachostergios, Dordas and Damalas2011b).
Economic indices
The IA index is an indicator of the economic feasibility of intercropping systems and shows the most advantageous crop mixtures. The IA of most intercropping systems was positive, clearly indicating the yield advantages of intercropping over monocropping systems, especially in red pea-barley (80:20), which had the highest value, in all procurement prices that were tested by the sensitivity analysis (Finlayson et al., Reference Finlayson, Lawes, Metcalf, Robertson, Ferris and Ewing2012). In addition, the MAI showed a clear gain for red pea-barley 60:40 mixture. The fact that MAI had the highest positive values for the above intercrop shows that this intercropping system had the highest economic advantage, whereas all the other mixtures had lower economic profit which was confirmed by the sensitivity analysis. Similarly, Banik et al. (Reference Banik, Midya, Sarkar and Ghose2006) reported IA due to positive monetary advantages values. In addition, the advantage of the intercropping system found in this study can be attributed to better utilization of growth resources. These findings are also in agreement with the results of LER and the other competition indices. Similarly, Ghosh (Reference Ghosh2004) found that when the LER and K were higher there was significant economic benefit expressed with higher MAI values.
CONCLUSIONS
The present study indicated that red pea can be used in intercropping systems with winter cereals such as barley and triticale. Red pea-barley mixtures had a yield advantage for exploiting the available environmental resources compared with their respective monocrops and the red pea-triticale mixtures. Among the mixtures studied the red pea-barley 60:40 was found to be the most profitable. Indeed, results obtained from competition and economics indices indicated a superior advantage of this mixture because of better land use efficiency and better economics than the other mixtures examined. The mixture of red pea with barley could be economically and environmentally promising in the development of sustainable crop production and thus can be adopted by farmers for maximization of economic yields.
Acknowledgements
Financial support of this project by the Hellenic Agricultural Organization – ‘Demeter’ of the Hellenic Ministry of Agriculture is gratefully acknowledged.