




1. Introduction and background
Particle suspensions in non-Newtonian liquids are frequently encountered in nature and industrial applications, such as cement, toothpaste, 3-D printing material or drilling muds (Dagois-Bohy et al. Reference Dagois-Bohy, Hormozi, Guazzelli and Pouliquen2015; Liu et al. Reference Liu, Liu, Zhou, Wang and Deng2015; Ovarlez et al. Reference Ovarlez, Mahaut, Deboeuf, Lenoir, Hormozi and Chateau2015; Fang et al. Reference Fang, Aabith, Homer-Vanniasinkam and Tiwari2017). Multiple non-linear effects, such as non-linear dynamic behaviour of the liquid phase, fluid–particle and particle–particle interactions, can coexist in such systems giving rise to complex rheology and macroscale flow dynamics. Significant efforts have been made in recent years to derive constitutive equations to accurately describe the physical properties of these complex fluid systems (Yang & Shaqfeh Reference Yang and Shaqfeh2018a,Reference Yang and Shaqfehb; Gillissen & Wilson Reference Gillissen and Wilson2019; Morris Reference Morris2020). However, experimental data are still needed to better understand the effects of such complex particle suspensions on the stability and transitions in macroscale flows, in order to link microscopic and macrosopic behaviour.
For that purpose, one can advantageously use the ‘hydrogen atom’ of fluid mechanics (Fardin, Perge & Taberlet Reference Fardin, Perge and Taberlet2014), Taylor–Couette flow (TCF): the flow developing between two concentric cylinders at least one of which is rotating. This simplified geometry is widely used in rheometry and also to investigate stability and transitions in various fluids, including, for example, non-Newtonian polymeric solutions (see e.g. Dutcher & Muller Reference Dutcher and Muller2013; Martínez-Arias & Peixinho Reference Martínez-Arias and Peixinho2017; Cagney, Lacassagne & Balabani Reference Cagney, Lacassagne and Balabani2020; Lacassagne et al. Reference Lacassagne, Cagney, Gillissen and Balabani2020; Lacassagne, Cagney & Balabani Reference Lacassagne, Cagney and Balabani2021; among many others) and particle suspensions in Newtonian solvents (Majji, Banerjee & Morris Reference Majji, Banerjee and Morris2018; Majji & Morris Reference Majji and Morris2018; Gillissen & Wilson Reference Gillissen and Wilson2019; Ramesh, Bharadwaj & Alam Reference Ramesh, Bharadwaj and Alam2019; Gillissen et al. Reference Gillissen, Cagney, Lacassagne, Papadopoulou, Balabani and Wilson2020; Morris Reference Morris2020; Ramesh & Alam Reference Ramesh and Alam2020). This last topic has recently benefited from a set of comprehensive experimental studies describing the effects of low particle concentrations on mixing in TCF (Dherbécourt et al. Reference Dherbécourt, Charton, Lamadie, Cazin and Climent2016; Rida et al. Reference Rida, Cazin, Lamadie, Dherbécourt, Charton and Climent2019), TCF dynamics of dense particle suspensions with sedimentation and resuspension (Saint-Michel et al. Reference Saint-Michel, Bodiguel, Meeker and Manneville2017, Reference Saint-Michel, Manneville, Meeker, Ovarlez and Bodiguel2019) and the effects of intermediate particle concentrations on high-order flow transitions (Majji & Morris Reference Majji and Morris2018; Majji et al. Reference Majji, Banerjee and Morris2018; Ramesh et al. Reference Ramesh, Bharadwaj and Alam2019; Baroudi, Majji & Morris Reference Baroudi, Majji and Morris2020; Dash, Anantharaman & Poelma Reference Dash, Anantharaman and Poelma2020; Ramesh & Alam Reference Ramesh and Alam2020). As part of the latter, it has been shown that the presence of particles globally tends to destabilise the flow (Majji et al. Reference Majji, Banerjee and Morris2018; Ramesh et al. Reference Ramesh, Bharadwaj and Alam2019; Dash et al. Reference Dash, Anantharaman and Poelma2020), as predicted by modelling approaches (Gillissen & Wilson Reference Gillissen and Wilson2019). It was also found to promote additional non-axisymmetric flow states (Ramesh et al. Reference Ramesh, Bharadwaj and Alam2019; Dash et al. Reference Dash, Anantharaman and Poelma2020) and the coexistence of flow states (Majji et al. Reference Majji, Banerjee and Morris2018; Dash et al. Reference Dash, Anantharaman and Poelma2020; Ramesh & Alam Reference Ramesh and Alam2020), thus altering the common Couette flow (CF)–Taylor vortex flow (TVF)–wavy Taylor vortex flow (WTVF) transition encountered in TCF of Newtonian fluids with the inner cylinder only rotating.
When considering TCF of polymer solutions, it has been consistently shown that their non-Newtonian features also tend to destabilise the base and first-order laminar flows (Cagney et al. Reference Cagney, Lacassagne and Balabani2020; Lacassagne et al. Reference Lacassagne, Cagney and Balabani2021), give rise to additional flow states (see e.g. Groisman & Steinberg Reference Groisman and Steinberg1996; Dutcher & Muller Reference Dutcher and Muller2013; Lacassagne et al. Reference Lacassagne, Cagney, Gillissen and Balabani2020) and transition to low Reynolds number ( $Re$) turbulent-like states such as elastic (Groisman & Steinberg Reference Groisman and Steinberg2004) or EIT (Dutcher & Muller Reference Dutcher and Muller2013; Lacassagne et al. Reference Lacassagne, Cagney, Gillissen and Balabani2020, Reference Lacassagne, Cagney and Balabani2021). However, it was recently highlighted experimentally that various non-Newtonian features of the same fluid may not combine towards destabilising the flows, but rather compete, with shear-thinning mediating elasto-inertial transitions (Cagney et al. Reference Cagney, Lacassagne and Balabani2020; Lacassagne et al. Reference Lacassagne, Cagney and Balabani2021). Questions then arise when considering TCF of suspensions in non-Newtonian fluids. Are the two complex features of the fluid, namely elasticity and the presence of particles, expected to act in synergy to destabilise the flow? Will the presence of particles mediate elasto-inertial instabilities? To address these questions, we here study the TCF of semidilute monodisperse spherical particle suspensions (polymethylmethacrylate particles, GoodFellow, UK,
 $0.01\leq \phi \leq 0.1$, with
 $\phi$ the particle volume fraction) in a viscoelastic fluid with constant shear viscosity (Boger fluid made of polyacrylamide dissolved in a water–glycerol mixture as in Lacassagne et al. Reference Lacassagne, Cagney, Gillissen and Balabani2020), the density of which matched that of the particles (
 $\rho =1198\ \textrm{kg}\ \textrm{m}^{-3}$)
2. Experimental details
The steady-shear rheology of suspensions was measured using an ARES rheometer (TA Instruments) equipped with a Couette geometry (1 mm gap). Characterisation was systematically performed on the Boger matrix itself and on the particle suspension in Boger fluid, before and after the Taylor–Couette experiments (the exact same sample as that used for the TCF experiment). This last step allowed us to verify that the samples did not experience polymer degradation during the experimental protocol. Additional characterisation of the water–glycerol mixture with and without particles was also performed separately. Examples of viscosity curves are reported in figure 1(a–c). The suspensions in Boger fluids (full circles) exhibited constant viscosity for a wide range of shear rates. An increase in viscosity was observed for shear rates above 100 s $^{-1}$ which could not be ascribed to inertial instabilities (which generally do not occur when the inner cylinder is fixed, as was the case here), but rather to purely elastic instabilities. The dashed lines in figure 1 highlight that this apparent thickening only occurs when the Weissenberg number exceeds 100 (
 $Wi = t_e \dot {\gamma }$, where
 $\dot {\gamma }$ is the strain rate and
 $t_e$ is the relaxation time), in agreement with the results of Schaefer, Morozov & Wagner (Reference Schaefer, Morozov and Wagner2018) at similar curvatures. A similar behaviour was also observed for particle-free Boger fluids (empty circles on all subplots in figure 1), and for additional measurements performed with a plate–plate geometry (not reported here, see also Groisman & Steinberg Reference Groisman and Steinberg2004) confirming this hypothesis. The effective viscosity was then taken as the average viscosity value on the plateau region of the curve. Values for this average viscosity are reported in table 1, averaged on all tests at similar
 $\phi$. Oscillatory-shear measurements performed with the same rheometer and geometry showed that the addition of particles did not modify the elastic and viscous moduli
 $G'$ and
 $G''$ of the liquid. The apparent elastic time scale of the Boger fluid, which was estimated from the cross-over point between
 $G'$ and viscosity corrected
 $G''$ curves as detailed in Lacassagne et al. (Reference Lacassagne, Cagney, Gillissen and Balabani2020), was thus not altered by the presence of particles and found equal to
 $t_e=0.21$ s.
Steady-shear dynamic viscosities  $\mu$ for particle-loaded solvent and particle-loaded Boger fluid, for all three values of
 $\phi$, together with systematic characterisations of particle-free solvent and Boger matrix. Vertical dashed lines are plotted at
 $Wi=100$.

Summary of experimental parameters for ramp-up (RU) and ramp-down (RD) experiments. Here  $N_{RU}$ and
 $N_{RD}$ correspond to the number of repeated experiments for RU and RD, respectively, and
 $\varGamma _0={\mathrm {d}{Re}}/{\mathrm {d}t^*}=({\rho ^2 r_i d^3}/{\mu ^2})({\mathrm {d}\varOmega }/{\mathrm {d}t})$ is the non-dimensional acceleration rate, with
 $t^*=t/t_v$ the time scaled by the viscous time scale
 $t_v=\rho d^2/\mu$.

The TCF cell is displayed in figure 2 and is similar to the one used in Cagney et al. (Reference Cagney, Lacassagne and Balabani2020) and Lacassagne et al. (Reference Lacassagne, Cagney, Gillissen and Balabani2020, Reference Lacassagne, Cagney and Balabani2021) (the reader may refer to those works for further details). The axial length was  $H = 135$ mm, and the inner and outer radii were
 $r_i=21.66$ mm and
 $r_o=27.92$ mm, respectively. This corresponds to a gap width of
 $d = 6.26$ mm, a radius ratio of
 $\eta = r_i/r_o = 0.776$, curvature ratio
 $\epsilon =d/r_i=0.289$ and an aspect ratio
 $AR=H/d=21.56$ (figure 2), which places the set-up in the large-gap and high-curvature limits. The particle nominal diameter was
 $d_p=48\ \mathrm {\mu }$m. The gap-to-particle diameter ratio was
 $d/d_p=131$, well within the small-particle limit. Three types of experiments were performed: ramp-up (RU, acceleration of the inner cylinder), ramp-down (RD, deceleration) and steady-state experiments (STS, constant rotation speed of the inner cylinder recorded for a given time span). The RU and RD tests allowed the flow transitions and instabilities to be characterised over a continuous range of cylinder rotation speed and the nature of the bifurcations to be discussed. The STS tests allowed a specific flow state to be examined with greater temporal resolution. The rotation speed of the inner cylinder,
 $\varOmega$, and the corresponding Reynolds number defined as
 $Re=\rho \varOmega r_id/\mu$ were the main control parameters in the experiments. The particle Reynolds number,
 $Re_p= \rho \varOmega r_i d_p/\mu$, was
 $Re_p\ll Re$ and
 $Re_p \sim O(1)$ at maximum
 $\varOmega$. Two other non-dimensional groups can be used to describe the experiments: the Weissenberg number, defined with respect to the average strain rate across the fluid,
 $Wi = t_e\varOmega r_i/d$, and the elastic number
 $El=Wi/Re$ which does not depend on
 $\varOmega$ but solely on fluid properties. The elastic number
 $El$ ranged from 0.21 at
 $\phi =0$ (see also Lacassagne et al. Reference Lacassagne, Cagney, Gillissen and Balabani2020) to 0.28 at
 $\phi =0.1$, due to the change in viscosity (see table 1). Acceleration or deceleration of the inner cylinder was performed in a quasi-steady fashion (with the non-dimensional rate
 $\varGamma _0<1$ as defined in table 1, see also Dutcher & Muller (Reference Dutcher and Muller2009) and Lacassagne et al. (Reference Lacassagne, Cagney and Balabani2021)). The flow structure was captured by adding a very small quantity (volume fraction of the order of
 $10^{-4}$, with negligible effect on the flow; Gillissen et al. (Reference Gillissen, Cagney, Lacassagne, Papadopoulou, Balabani and Wilson2020)) of reflective flakes to the fluid (Pearl lustre pigments, L. Cornelissen
 $\&$ Son, UK) illuminating using a white light source (PHLOX, France) and imaging using a high-speed camera (Phantom Miro 340, Vision Research, USA) as detailed in previous works (Cagney et al. Reference Cagney, Lacassagne and Balabani2020; Gillissen et al. Reference Gillissen, Cagney, Lacassagne, Papadopoulou, Balabani and Wilson2020; Lacassagne et al. Reference Lacassagne, Cagney and Balabani2021) (see figure 2).
Schematic of the experimental set-up showing the Taylor–Couette cell, visualisation arrangement, and flow map construction. PC, personal computer; LED, light-emitting diode.

The acquisition frequency was chosen, such that it was sufficiently high to capture all frequencies of the flow while allowing the experiment to be recorded in a single run, considering the limitations of camera memory. The recording frequencies and experimental parameters used with each working fluid for RU and RD experiments are summarised in table 1. The STS experiments were recorded at a higher frequency than RU and RD experiments, 1000 f.p.s. Flow maps and frequency maps were constructed with the protocol described in Lacassagne et al. (Reference Lacassagne, Cagney and Balabani2021).
3. Results and discussion
3.1. Overview and transitions
The data presented in this section relates only to Boger fluids with particle loading. A sample transition sequence for  $\phi =0.1$ is presented in figure 3, where figure 3(a) is the flow map (
 $Re$-space diagram) for
 $\phi =0.1$ during a RU experiment, figure 3(b) is the corresponding frequency map, and figure 3(c) and figure 3(d) are flow maps from STS experiments performed at
 $Re=133$ and
 $Re=200$, respectively. Figure 3(e) shows frequency spectra extracted from figure 3(b) and corresponding to flow states described in figure 3(c) and figure 3(d). Finally, figure 3(f) and figure 3(g) display flow and frequency maps corresponding to figure 3(a) and figure 3(b) but for a RD experiment. A visual difference in flow transitions between RU and RD can be noted, and will be discussed later.
Example of RU (a,b), STS (c,d) and RD experiments (f,g) for a  $\phi =0.1$ fluid (false colours). Panels (a,f) are
 $Re$-space diagrams (flow maps), (b,g) are frequency maps, (c,d) are space–time diagrams at fixed
 $Re$ and (e) shows temporal spectra extracted from the (b) frequency map at
 $Re$ corresponding to (c) and (d). Horizontal dashed lines in (b) and (g), and vertical dashed lines in (e) denote elastic wave frequencies
 $f^k=k\times f_e$ with
 $k=[\frac {1}{3},\frac {2}{3}]$ and
 $k=[\frac {1}{2},1]$ for the two first peaks in RU (b,e) and RD (g), respectively. Here, z is the location along the vertical axis and
 $f_{max}$ the maximum inner cylinder rotation frequency.

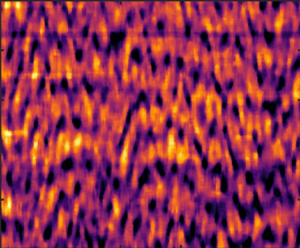
In CF, the space–time diagrams figure 3(a,f) are homogeneous, with all flakes oriented in the azimuthal direction. When TVF arises, the flakes’ orientation in relation to Taylor vortices gives rise to a banded structure. The CF (or TVF) are steady in time and not associated with any characteristic frequencies on the frequency map (figure 3b,g), other than the inner cylinder rotation frequency, that are captured by the method. The end of CF is identified from the flow maps when spatial structures appear.
In the rotating spiral waves (RSW) regime, a base TVF structure is visible, but additional patterns appear due to axial non-axisymmetric elastic waves spiralling either upward or downward (Lacassagne et al. Reference Lacassagne, Cagney, Gillissen and Balabani2020) (figure 3a,c,f). This results in additional and distinct ridges on the frequency maps (figure 3b,g) that do not depend on  $Re$, from the onset of which the critical
 $Re$ for transition from/to RSW can be detected. The existence of TVF (that can be quite difficult to capture, see figure 3a) thus spans from the appearance of spatial structures to the appearance of these ridges. They correspond to the temporal frequencies of RSW, i.e of the primary elastic instability, and their frequency scales as
 $f^k=k\times f_e$ with
 $f_e=2c_e/\lambda$ the elastic frequency,
 $\lambda \simeq d$ a spatial wavelength, and
 $c_e=\sqrt {\mu /(\rho t_e)}$ the elastic wave celerity. The two first
 $f^k$ frequencies are illustrated by horizontal dashed lines in figure 3(b) and 3(g). Vertical dashed lines in figure 3(e) for
 $Re=133$ denote the peaks corresponding to horizontal lines in figure 3(b). The related
 $k$ values are reported in the figure caption.
Finally, in the EIT domain (EIT), the random alignment of flakes with a set of various spatial flow structures translates into an increasingly chaotic intensity signal and space–time plot (figure 3a,d,f). The distinct peaks in the frequency maps that were present in RSW gradually merge into continuous spectra (figure 3b,g,e). The EIT thus consists in the appearance of spatial and temporal chaos on top of the organised TVF structure, through RSW and the multiplication of vortex merging and splitting events. Critical  $Re$ for RSW
 $\leftrightarrow$EIT transitions are identified from the frequency maps (figure 3b,g), when secondary RSW peaks can no longer be distinguished. Note that some of the spectral signature of RSW may persist into the EIT regime in the form of a consistent smoother peak (see figure 3g,
 $Re > 170$).
In RD experiments, an additional flow state is encountered in the form of upward spiralling vortices, and labelled SVF for spiral vortex flow (see figure 3f). A summary of critical  $Re$ for transitions,
 $Re_c$, is provided in figure 4(a,b) for RU and RD experiments, respectively. The experiments were repeated at least four times (see table 1) and excellent consistency on the succession of flow states was encountered. The reported visualisations correspond to single experimental runs, but critical
 $Re$ values are averaged over all repeats, and the standard deviations over critical
 $Re$ provide error bars for figure 4.
Critical  $Re$–
 $\phi$ maps for transitions to TVF, RSW, EIT and SVF in RU (a) and RD (b) experiments. Hysteretic behaviours are illustrated for transitions to/from EIT, RSW and TVF in panels (ci, cii and ciii), respectively (triangles pointing upwards for RU, downwards for RD).

It can be seen that the addition of particles initially decreases the critical  $Re$ for the CF
 $\longrightarrow$TVF transition at the lowest particle volume fraction, but as
 $\phi$ is increased above 0.01, the critical
 $Re$ increases, stabilising the flow. The same trend is observed in figure 4(b) for the RD experiments for
 $\phi <0.1$. Note that in Newtonian suspensions, the addition of particles in the same volume fraction range mostly leads to a minor destabilisation of the CF with respect to TVF (Majji et al. Reference Majji, Banerjee and Morris2018; Gillissen & Wilson Reference Gillissen and Wilson2019; Ramesh et al. Reference Ramesh, Bharadwaj and Alam2019). The opposite trend observed here must therefore be attributed to the combination of particles and viscoelastic fluid matrix; while both properties in isolation tend to destabilise CF compared with the Newtonian case, they have the opposite effect when combined.
For the  $\phi =0.1$ RD experiments, SVF is observed at
 $Re$ values much lower than the critical
 $Re$ for CF
 $\longrightarrow$TVF transition in RU. This new state is illustrated in the flow map and corresponding frequency map of figure 5. It appears to coexist with RSW in the
 $Re$ range from 120 to 140 (figure 5a, close-up in figure 5b). We also note that SVF is not associated with any spectral signature on its own: the frequency map in the
 $Re$ range of 20–120 is similar to that expected for TVF (figure 5c). Such spiralling behaviour was previously reported in particle suspensions in Newtonian fluids in RD (Majji et al. Reference Majji, Banerjee and Morris2018) but also RU (Ramesh et al. Reference Ramesh, Bharadwaj and Alam2019; Ramesh & Alam Reference Ramesh and Alam2020), sometimes interpenetrating or coexisting with other flow states (Majji et al. Reference Majji, Banerjee and Morris2018; Ramesh & Alam Reference Ramesh and Alam2020). The fact that the new state is found only in RD tests suggests a modification of the nature of primary instabilities in particle-loaded Boger fluids at non-dilute volume fractions (
 $\phi \succeq 0.05$). The SVF is unlikely to be caused by buoyancy or particle-migration effects, since it arises when ramping down from chaotic states (EIT–RSW) in which particles are expected to be well mixed by strong axial flow velocity fluctuations. The coexistence of flow states, which was already observed for particles in Newtonian solvents (Ramesh et al. Reference Ramesh, Bharadwaj and Alam2019; Dash et al. Reference Dash, Anantharaman and Poelma2020; Ramesh & Alam Reference Ramesh and Alam2020), is for the first time reported here for particle suspensions in Boger fluids.
Illustration of the SVF state for RD experiments at  $\phi =0.1$, on the flow map (a) and frequency map (c) (focus from figure 3f and 3g). Vertical dotted lines highlight transitions from RSW, RSW
 $+$SVF, SVF and CF from right to left (decreasing
 $Re$). A close-up of the flow map in the coexisting state range RSW
 $+$SVF is provided in panel (b) (
 $Re$ axis ranging from 118 to 136,
 $z/d$ axis from 5 to 20).

The higher order transition to RSW (figure 4a,b) arises very soon after the onset of TVF (Lacassagne et al. Reference Lacassagne, Cagney, Gillissen and Balabani2020). After a slight destabilisation at  $\phi =0.01$, a stabilising effect by particle addition is again reported, with critical
 $Re$ values increasing with
 $\phi$. The RD results in figure 4(b) follow the same trend. Averaging on all experiments, TVF has a very narrow
 $Re$ range of existence
 ${\rm \Delta} Re_{TVF}\sim 1$ with yet
 ${\rm \Delta} t_{TVF}>10\times t_e$. It is the first in a series of transitions leading to more complex flow states. In some higher
 $\phi$ cases, TVF can sometimes not be seen clearly (figure 3a) and the primary transition could be either CF
 $\leftrightarrow$TVF or CF
 $\leftrightarrow$RSW within the margin of error of this study. The results thus suggest that increasing particle concentration reduces
 ${\rm \Delta} Re_{TVF}$, promoting CF–RSW as the primary instability upon particle addition. However a precise understanding of this effect calls for a more accurate investigation in the
 $Re=[100 - 120]$ range.
For the RSW to EIT transition, the trends for critical  $Re$ are globally similar to those previously reported for transition to RSW, i.e. a destabilisation by
 $\phi =0.01$ followed by a stabilisation both in RU and RD cases, upon increased
 $\phi$. This non-monotonic trend is more pronounced for the RSW
 $\leftrightarrow$EIT transition compared with those observed for lower order transitions. The combined effects of particles and viscoelasticity, which would have been expected to separately lead to earlier second-order flow transitions, here again appear to delay transition to chaotic patterns.
3.2. Effect of particle loading on RSW and EIT properties
The effects of particle loading on EIT features can be characterised using spatio-temporal flow properties at a constant Reynolds number. Figure 6 shows two dimensional FFTs in time and space of STS experiments. Peaks of such spectra correspond to dominant time and length scales of the flow. The RSW is described by a set of discrete and identifiable peaks in space but also in time (see for example figure 6c). On the other hand, EIT displays a broadband behaviour characteristic of a turbulent state, with no distinct peak (see e.g. figure 6b). The temporal spectra projected on upper-right parts allow to distinguish between RSW (clear temporal peak, figure 6c) and EIT (no clear temporal peak, figure 6a,b,d). Figure 6 shows that the collapse of RSW spectra into broadband EIT, which occurs as  $Re$ is increased, is delayed by the increase in
 $\phi$. In the
 $\phi =0.01$ case (top line)
 $Re=167$ (figure 6b) already corresponds to a turbulent signature without peaks, while for
 $\phi =0.1$ (bottom line), peaks are still visible at
 $Re=200$ (figure 6d), although they are less distinct than at
 $Re=133$ (figure 6c). In other words, the presence of particles delays the transition to EIT, as previously observed, but also preserves the large-scale spatial structure of RSW into EIT.
Two dimensional FFTs (time and space) of STS experiments for  $\phi =0.01$ (a,b) and
 $\phi =0.1$ (c,d). Top left and top right parts on each panel display mean spectra in the frequency and space dimensions, respectively. The spatial wavelength axis is scaled by the gap size
 $d$ and the temporal frequency axis by
 $1/t_e$.

3.3. Hysteretic behaviour
At  $\phi =0$, critical
 $Re$ for CF–TVF and TVF–RSW transitions are higher for RU experiments than for RD experiments (see figure 4cii,ciii). This is the signature of a (moderately) subcritical bifurcation (Martínez-Arias & Peixinho Reference Martínez-Arias and Peixinho2017). Particle addition reverses the hysteresis; even at the lower
 $\phi$ values, the critical
 $Re$ values in RD experiments become larger than those found in RU tests, for both transitions. The flow transitions back to lower order states at higher
 $Re$ that are seen in the RU tests, and the difference in critical
 $Re$ values due to this reversed hysteretic behaviour, increases with the order of the transition (larger for RSW–EIT transition than for CF–TVF transition), and with increasing
 $\phi$.
The origin of such a reversed hysteretic behaviour may, at first, be attributed to elastic or inertial particle migration. Indeed, particles migrating away from the inner cylinder in CF during RU tests would induce lower inner viscosity and higher  $Re$, leading to a lower apparent critical
 $Re$ in RU compared with the RD case where particles are expected to be evenly dispersed and the viscosity homogeneous. This is in qualitative agreement with a similar reverse hysteresis observed by Ramesh et al. (Reference Ramesh, Bharadwaj and Alam2019) for the CF–TVF primary transition in Newtonian particle suspensions, suggesting that inertial migration may play a role. Moreover, the shortest time scale at which elastic migration effects would arise, estimated according to the modelling of D'Avino, Greco & Maffettone (Reference D'Avino, Greco and Maffettone2017), is found to be
 $\sim 50$ s, comparable to and even shorter than the typical times particles spent in CF during a RU experimental protocol. Thus, elastic migration may also be at play when considering primary instabilities.
However, a stronger reversed hysteresis is observed for higher order RSW $\leftrightarrow$EIT transition, for which particles are expected to be well mixed in both states, which suggests that migration alone cannot explain the observed hysteretic phenomena. This new and striking result suggests that the particles act on elasto-inertial patterns with mechanisms other than migration, and more importantly that this action corresponds to a damping or attenuation of elasto-inertial features. Recent findings on local stress concentration and elastic thickening (see e.g. Yang & Shaqfeh Reference Yang and Shaqfeh2018a,Reference Yang and Shaqfehb) in particles suspended in viscoelastic media might further explain this macroscopic behaviour.
4. Summary and conclusion
The results reported in this work show that particle addition to Boger fluids can significantly affect the elasto-inertial transitions and patterns in TCF. Firstly, it tends to globally stabilise flow states with respect to the first- and second-order transitions, and delays the onset of EIT, thus stabilising flows (after a small destabilisation in very dilute suspensions). Secondly, it modifies the spectral signature of EIT, by promoting energy concentration in large-scale steeper peaks. Finally, it modifies the nature of flow transitions, with a reverse hysteresis behaviour and the occurrence of SVF in RD experiments.
All the previous observations underpin a damping of elasto-inertial features by the presence of particles: a delay of their onset with increasing  $\phi$, a reduction of EIT chaotic features at constant
 $Re$ for increased
 $\phi$, and their reduction leading to a reverse hysteretic behaviour. An explanation for this could be that of an elastic thickening mechanism, that is to say an increase in viscosity associated with polymer–particle interactions. This phenomenon is due to the local elongation of polymer chains in interparticle gaps, where strong shear or strain rates can be encountered; this leads in turn to strain hardening, a local increase in extensional viscosity (see for example Yang & Shaqfeh Reference Yang and Shaqfeh2018a,Reference Yang and Shaqfehb) and a global increase in shear viscosity.
Combining the presence of particles and viscoelasticity, which on their own would be expected to lead to flow destabilisation, does not necessarily lead to stronger destabilisation. On the contrary, the destabilising effect of one complex fluid property may be cancelled out or reversed by the presence of another such property, as has recently been illustrated for the competition between shear thinning and viscoelasticity (Lacassagne et al. Reference Lacassagne, Cagney and Balabani2021). Future work on this topic should in our opinion be focused on bridging the gap between local observation at the particle scale (Yang & Shaqfeh Reference Yang and Shaqfeh2018a,Reference Yang and Shaqfehb) and global flow characterisation in complex conditions and with non-negligible inertia. Further large-scale experiments with various polymer chain extensional properties, together with the measurement of the shear and strain rates in particle-free or particle-loaded RSW and EIT flows, could bring further understanding on the role of extensional or elastic thickening. Practical considerations and industrial applications might also call for studies of particle suspensions at higher volume fractions, or higher blockage ratio (lower  $d_p/d$ ratio) for which particle–particle interactions may become dominant (Royer, Blair & Hudson Reference Royer, Blair and Hudson2016).
Funding
Financial support for this work from the Engineering and Physical Sciences Research Council (EPSRC) Manufacturing the Future programme (no. EP/N024915/1) as well as the EPSRC DTP award EP/R513143/1 is gratefully acknowledged.
Declaration of interests
The authors report no conflict of interest.



