







1. Introduction
Transition to turbulence has been studied extensively in wall-bounded shear flows for Newtonian fluids since the pioneering work of Reynolds (Reference Reynolds1883a,Reference Reynoldsb). However, despite many experimental and theoretical contributions (Eckhardt et al. Reference Eckhardt, Schneider, Hof and Westerweel2007; Schmid Reference Schmid2007; Mullin Reference Mullin2011; Avila, Barkley & Hof Reference Avila, Barkley and Hof2023), its nature remains unclear even for simple geometries. Reynolds (Reference Reynolds1883a,Reference Reynoldsb) noted in his experimental pipe flow studies that a strong perturbation can trigger transition at a Reynolds number ( $Re$) of 2260. Subsequent studies have placed this critical Reynolds number in the range of
 $1760\leq Re\leq 2300$ (Kerswell Reference Kerswell2005). Through more controlled conditions, it was also shown that the laminar state could be maintained until a higher Reynolds number of
 $Re=12{,}000$ (extended to
 $10^5$ by Pfenniger Reference Pfenniger1961). The upper critical
 $Re$ is in closer agreement with theoretical studies, showing that plane Couette flows (PCF) and pipe flows are linearly stable to infinitesimal perturbations for all Reynolds numbers (Drazin & Reid Reference Drazin and Reid1981). For plane Poiseuille flows (PPF), experiments have shown a lower critical Reynolds number of
 $Re\approx 1000$ (Davies & White Reference Davies and White1928; Orszag & Kells Reference Orszag and Kells1980; Carlson, Widnall & Peeters Reference Carlson, Widnall and Peeters1982), whereas linear stability theory has found that PPF becomes unstable at
 $Re\approx 5772$ (Orszag Reference Orszag1971). Experimental observations naturally point out the susceptibility of the flow to disturbances in the environment and explain why in practice most pipe and channel flows become turbulent at subcritical
 $Re$. In theory, this is further supported by analysis performed on the non-normality of the linearized Navier–Stokes equations, where the efficient amplification of finite-amplitude disturbances at a short time has been identified (Boberg & Brosa Reference Boberg and Brosa1988; Trefethen et al. Reference Trefethen, Trefethen, Reddy and Driscoll1993; Schmid & Henningson Reference Schmid and Henningson2001). In contrast to Newtonian flows, the onset of turbulence for non-Newtonian flows or viscoelastic flows of polymer solutions has been relatively less studied. In the remainder of this section, we provide a summary of the relevant literature concerning both Newtonian and viscoelastic flows and present the contributions addressed in the present study.
1.1. Finite-amplitude thresholds in Newtonian flows
Given the strong sensitivity of Newtonian flows to external disturbances, controlled perturbations have been widely utilized in the study of transitional flows. Of particular interest are the disturbances that cause the maximum energy growth in a specified time interval, known as linear optimal perturbations (Farrell Reference Farrell1988; Butler & Farrell Reference Butler and Farrell1992). For laminar pipe flow, the linear optimal disturbance is that of a counter-rotating streamwise vortex pair, which evolves into streamwise streaks due to the lift-up mechanism (Landahl Reference Landahl1980; Schmid & Henningson Reference Schmid and Henningson1994). These optimal perturbations are in agreement with the coherent structures that characterize transitional and turbulent shear flows. However, the transition is often triggered by other structures. Reddy et al. (Reference Reddy, Schmid, Baggett and Henningson1998) and Peixinho & Mullin (Reference Peixinho and Mullin2007) showed that oblique disturbances are more successful at triggering turbulence. Hence, nonlinear optimization approaches have been proposed to compute optimal perturbations (Monokrousos et al. Reference Monokrousos, Bottaro, Brandt, Vita and Henningson2011; Luchini & Bottaro Reference Luchini and Bottaro2014; Kerswell Reference Kerswell2018), proving the existence and efficiency of nonlinear optimal perturbations over the linear ones (Pringle & Kerswell Reference Pringle and Kerswell2010; Cherubini & Palma Reference Cherubini and Palma2013; Farano et al. Reference Farano, Cherubini, Robinet and De Palma2015).
Of greater relevance to the current study is the study of the minimal perturbation amplitude  $\epsilon$ required to trigger transition. The scaling law describing the relationship between
 $\epsilon$ and
 $Re$ is also of relevance. Early experimental work used continuous perturbations via a continuous injection of fluid through slits or holes (Rotta Reference Rotta1956; Wygnanski & Champagne Reference Wygnanski and Champagne1973). Impulsive perturbations, such as a single-pulse injection of fluid, were also used, showing that these perturbations produced more consistent results by initiating controlled turbulent structures that could be used to determine turbulence far downstream (Wygnanski, Sokolov & Friedman Reference Wygnanski, Sokolov and Friedman1975; Rubin, Wygnanski & Haritonidis Reference Rubin, Wygnanski and Haritonidis1979; Darbyshire & Mullin Reference Darbyshire and Mullin1995). Darbyshire & Mullin (Reference Darbyshire and Mullin1995) introduced various single-pulse disturbance configurations into a fully developed pipe flow. The critical perturbation amplitude decreased very rapidly with increasing Reynolds number, eventually following an asymptotic behaviour for high
 $Re$, regardless of the perturbation type. Hence, this behaviour can be described as
 $\epsilon =O(Re^\gamma )$ with the critical exponent
 $\gamma < 0$, where a large
 $|\gamma |$ value corresponds to a rapid growth of the disturbances due to nonlinear effects (Trefethen et al. Reference Trefethen, Trefethen, Reddy and Driscoll1993). The current estimate for the critical exponent
 $\gamma$ is in the range of
 $-7/4 \leq \gamma \leq -1$ derived from numerical and experimental studies for different geometries. For PPF, Lundbladh, Henningson & Reddy (Reference Lundbladh, Henningson and Reddy1994) and Reddy et al. (Reference Reddy, Schmid, Baggett and Henningson1998) performed numerical experiments and suggested
 $\gamma =-7/4$ for both streamwise and oblique perturbations. Chapman (Reference Chapman2002) used a formal asymptotic analysis of the Navier–Stokes equations and found
 $\gamma =-3/2$ and
 $\gamma =-5/4$ for oblique and streamwise initial perturbations. Experimentally, Philip, Svizher & Cohen (Reference Philip, Svizher and Cohen2007) achieved an agreeable scaling factor of
 $\gamma =-3/2$ for PPF with a shorter channel length. For PCF, Dauchot & Daviaud (Reference Dauchot and Daviaud1995) experimentally suggested the power exponent of
 $\gamma = -1$. Instead of using the perturbation amplitude, the kinetic energy of the perturbation
 $E_c$ has also been examined to suggest a similar scaling law for PCF, where
 $E_c = O(Re^{\gamma })$, with
 $-2 \le \gamma \le -2.7$ (Kreiss, Lundbladh & Henningson Reference Kreiss, Lundbladh and Henningson1994; Duguet et al. Reference Duguet, Monokrousos, Brandt and Henningson2013). For pipe flow, Meseguer (Reference Meseguer2003) numerically studied the formation and breakdown process of streaks due to streamwise vortices, suggesting a critical exponent of
 $\gamma =-3/2$, in agreement with the formal asymptotic analysis performed by Chapman (Reference Chapman2002) for PPF. Through novel experimental set-ups, Hof, Juel & Mullin (Reference Hof, Juel and Mullin2003) and Lemoult, Aider & Wesfreid (Reference Lemoult, Aider and Wesfreid2012) uncovered a scaling factor of
 $\gamma =-1$ for
 $Re>2000$, as proposed by Waleffe & Wang (Reference Waleffe and Wang2005). Lemoult et al. (Reference Lemoult, Aider and Wesfreid2012) also showed an exponent close to
 $\gamma =-3/2$ for the restricted range of
 $1000 < Re < 2000$. Interestingly, Mullin & Peixinho (Reference Mullin and Peixinho2006) and Peixinho & Mullin (Reference Peixinho and Mullin2006) showed that for
 $Re\leq 1760$ turbulent flows cannot be sustained and all disturbances will eventually decay as
 $t \rightarrow \infty$.
1.2. Transitional behaviour of drag-reducing flows
Since the discovery of Toms (Reference Toms1948), the addition of small amounts of flexible long-chain polymers into a turbulent flow has been known to cause significant drag reduction (DR) in pipe and channel flows. This discovery attracted the interest of several applications that benefited directly from its drag-reducing effects. The most popular application of this phenomenon is in the fossil fuel industry (e.g. Alaska pipeline and fracking fluid). More recently, polymer additives were utilized in a large-scale open-channel watercourse, which showed beneficial reduction in the water depth downstream from the polymer injection point and an increase in the discharge capacity of the channel (Bouchenafa et al. Reference Bouchenafa, Dewals, Lefevre and Mignot2021).
For viscoelastic effects, one of the most relevant non-dimensional numbers that characterizes polymer solutions is the Weissenberg number ( $Wi$), which is the product of the longest relaxation time of the polymer solution and the characteristic shear rate of the flow. The other most relevant parameter is the elasticity number (
 $El = Wi/Re$), which is independent of the velocity, meaning that it is constant for a particular fluid and flow geometry. Hence, the DR phenomenon of polymer solutions in shear flows is typically described in terms of
 $Wi$ or
 $El$ (Graham Reference Graham2014).
The study of viscoelastic fluids has focused mainly on the drag-reducing phenomenon in a turbulent flow (Min et al. Reference Min, Yoo, Choi and Joseph2003; White & Mungal Reference White and Mungal2008; Graham Reference Graham2014; Xi Reference Xi2019), whereas the role of polymers on the onset of transition has been relatively less studied. Earlier pipe experiments reported a lower transitional Reynolds number than one required for Newtonian transition, referred to as early turbulence (Ram & Tamir Reference Ram and Tamir1964; Forame, Hansen & Little Reference Forame, Hansen and Little1972; Hansen, Little & Forame Reference Hansen, Little and Forame1973; Zakin et al. Reference Zakin, Ni, Hansen and Reischman1977; Draad, Kuiken & Nieuwstadt Reference Draad, Kuiken and Nieuwstadt1998). Recent experiments showed further possibilities of early transition in pipes and channels at sufficiently high polymer concentrations (Samanta et al. Reference Samanta, Dubief, Holzner, Schäfer, Morozov, Wagner and Hof2013; Srinivas & Kumaran Reference Srinivas and Kumaran2017), pointing to the influence of strong elastic effects on the onset of turbulence of polymer solutions. This turbulent state, that results from early turbulence at high polymer concentrations, is referred to as elasto-inertial turbulence (EIT) (Dubief, Terrapon & Soria Reference Dubief, Terrapon and Soria2013; Samanta et al. Reference Samanta, Dubief, Holzner, Schäfer, Morozov, Wagner and Hof2013; Terrapon, Dubief & Soria Reference Terrapon, Dubief and Soria2015; Sid, Terrapon & Dubief Reference Sid, Terrapon and Dubief2018). Chandra, Shankar & Das (Reference Chandra, Shankar and Das2018) expanded the work of Samanta et al. (Reference Samanta, Dubief, Holzner, Schäfer, Morozov, Wagner and Hof2013) for higher values of the elasticity number and with various polymer types. For high polymer concentrations, they also found that transition occurred at  $Re<2000$. This is in agreement with recent results of the linear stability theory of pipe flows by Garg et al. (Reference Garg, Chaudhary, Khalid, Shankar and Subramanian2018) and Chaudhary et al. (Reference Chaudhary, Garg, Subramanian and Shankar2021), who showed that pipe flows of an Oldroyd-B fluid are linearly unstable. However, it should be noted that Chandra et al. (Reference Chandra, Shankar and Das2018) also observed the delayed transition, in other words, the transitional Reynolds number is increased. The study of EIT has also provided an alternative explanation to the upper limit of turbulent DR, also known as the maximum drag reduction state (Samanta et al. Reference Samanta, Dubief, Holzner, Schäfer, Morozov, Wagner and Hof2013; Choueiri, Lopez & Hof Reference Choueiri, Lopez and Hof2018; Lopez, Choueiri & Hof Reference Lopez, Choueiri and Hof2019). Interestingly, there are recent studies that have found the nonlinear elasto-inertial exact coherent structures in the EIT regime, named arrowhead structures (Page, Dubief & Kerswell Reference Page, Dubief and Kerswell2020; Buza et al. Reference Buza, Beneitez, Page and Kerswell2022; Dubief et al. Reference Dubief, Page, Kerswell, Terrapon and Steinberg2022), which link the EIT and elasto-inertial linear instability. An extensive review of these instabilities can be found on Castillo-Sánchez et al. (Reference Castillo-Sánchez, Jovanović, Kumar, Morozov, Shankar, Subramanian and Wilson2022) and Datta et al. (Reference Datta2022).
Similar to subcritical transition in Newtonian flows, a finite-amplitude perturbation is required to trigger the transition of polymer solutions. Hoda, Jovanović & Kumar (Reference Hoda, Jovanović and Kumar2008) studied the energy amplification of perturbations in the form of spatio-temporal body forces in PPF for an Oldroyd-B fluid. They found streamwise-elongated disturbances to be the most amplified. Zhang et al. (Reference Zhang, Lashgari, Zaki and Brandt2013) expanded this study to a finitely extensible nonlinear elastic fluid with the Peterlin closure (FENE-P) for inertia-dominated PPF. They observed the modal and non-modal types of perturbations, showing either stabilization or destabilization effects of polymer solutions depending on the polymer relaxation time. Agarwal, Brandt & Zaki (Reference Agarwal, Brandt and Zaki2014, Reference Agarwal, Brandt and Zaki2015) complemented these findings by spanning the bypass transition process for a FENE-P fluid in PPF. They observed the linear and nonlinear growth of an initially located disturbance and found a weakening of the disturbance amplification by polymers. A delay in the onset of transition and a prolonged transition period were also reported. For the natural or orderly transition of polymer solutions, Lee & Zaki (Reference Lee and Zaki2017) applied an infinitesimally small Tollmien–Schlichting wave to a FENE-P fluid in PPF. They found that the transition scenarios are affected by the level of the elasticity, where a destabilizing effect is observed at the lowest elasticity and a stabilization effect manifests as the elasticity is further increased. Biancofiore, Brandt & Zaki (Reference Biancofiore, Brandt and Zaki2017) and Sun, Wan & Zhang (Reference Sun, Wan and Zhang2021) investigated the nonlinear evolution of disturbed streaky structures in viscoelastic Couette and pipe flows, respectively, where viscoelasticity is found to delay the transition to turbulence in time for high  $Wi$.
A power-law scaling of the critical perturbation amplitude, which is analogous to the Newtonian flow that relates  $\epsilon$ and
 $Re$, has not been well explored for polymer solutions even at dilute concentrations and will be studied here. The transition of viscoelastic flows of a dilute FENP-P fluid is triggered by a finite-amplitude perturbation, and the effects of polymers on the transition dynamics and mechanisms are reported. The problem formulation is reported in § 2. The simulation results are presented in § 3. We then conclude in § 4.
2. Problem formulation
We consider an incompressible fluid flow in the plane Poiseuille (channel) geometry driven by a constant mass flux. The  $x$,
 $y$ and
 $z$ coordinates correspond to the streamwise, wall-normal and spanwise directions, respectively. Periodic boundary conditions are imposed in the streamwise and spanwise directions with fundamental periods
 $L_x$ and
 $L_z$, respectively. No-slip boundary conditions are applied at the solid walls at
 $y = \pm h$, where
 $h$ is the half-channel height. Using the half-channel height
 $h$ and the Newtonian laminar centreline velocity
 $U_{cl}$ at the given mass flux as the characteristic length and velocity, respectively, the time
 $t$ is non-dimensionalized with
 $h/U_{cl}$ and pressure
 $p$ with
 $\rho U_{cl}^2$, where
 $\rho$ is the density of the fluid. Utilizing these characteristic scales, the non-dimensional momentum and continuity equations for a fluid velocity
 $\boldsymbol {u}$ are
 $$\begin{gather} \frac{\partial\boldsymbol{u}}{\partial t}+\boldsymbol{u}\boldsymbol{\cdot}\boldsymbol{\nabla}\boldsymbol{u}={-}\boldsymbol{\nabla} p+\frac{\beta}{Re}\nabla^2\boldsymbol{u}+\frac{(1-\beta)}{Re}\boldsymbol{\nabla}\boldsymbol{\cdot}\boldsymbol{\tau}_p, \end{gather}$$
 $$\begin{gather}\boldsymbol{\nabla} \boldsymbol{\cdot}\boldsymbol{u}=0. \end{gather}$$
Here, the Reynolds number for the given laminar centreline velocity is defined as  ${Re=\rho U_{cl}h/(\eta _s + \eta _p)}$, where
 $(\eta _s+\eta _p)$ is the total zero-shear-rate viscosity. The subscripts ‘
 $s$’ and ‘
 $p$’ represent the solvent and polymer contributions to the viscosity, respectively. The viscosity ratio
 $\beta =\eta _s/(\eta _s+\eta _p)$ (for a Newtonian fluid,
 $\beta = 1$). For dilute polymer solutions,
 $(1-\beta )$ is proportional to polymer concentration; hereinafter, the polymer concentration is represented as
 $c = 1 - \beta$. The concentration is assumed constant in time and homogeneous in space. Although the viscosity of polymer solutions displays shear thinning, the total shear viscosity is hardly affected by the presence of the polymers for dilute solutions of polymers make a small contribution to the shear viscosity in the first place (Graham Reference Graham2014). The polymer stress tensor
 $\boldsymbol {\tau }_p$ is modelled by the FENE-P constitutive relation (Bird et al. Reference Bird, Curtiss, Armstrong and Hassager1987) as
 \begin{equation} \boldsymbol{\tau}_p = \frac{1}{Wi} \left[ \frac{\boldsymbol{\alpha}}{1-\textrm{tr}(\boldsymbol{\alpha})/b}-{{\boldsymbol{\mathsf{I}}}} \right], \end{equation}
where the Weissenberg number is defined as  $Wi=\lambda U_{cl}/h$, where
 $\lambda$ is the polymer relaxation time. The parameter
 $b$ defines the maximum extensibility of the polymers (i.e.
 $\max {(\textrm {tr}(\boldsymbol {\alpha }))}\le b$), which is proportional to the number of monomer units. The polymer conformation tensor
 $\boldsymbol {\alpha }=\langle \boldsymbol {q}\boldsymbol {q} \rangle$ quantifies the second moment of the probability distribution for the polymer end-to-end vector
 $\boldsymbol {q}$, satisfying the evolution equation
 \begin{equation} \frac{\partial \boldsymbol{\alpha}}{\partial t}+ \boldsymbol{u}\boldsymbol{\cdot} \boldsymbol{\nabla} \boldsymbol{\alpha}-\boldsymbol{\alpha}\boldsymbol{\cdot} \boldsymbol{\nabla} \boldsymbol{u} -(\boldsymbol{\alpha}\boldsymbol{\cdot} \boldsymbol{\nabla} \boldsymbol{u})^{\textrm{T}} ={-}\boldsymbol{\tau}_p, \end{equation}
which includes the upper convective derivative of  $\boldsymbol {\alpha }$ and stress relaxation due to the elastic nature of the polymer.
Simulations are performed using the open-source code Channelflow written and maintained by Gibson (Reference Gibson2012) from which a modified version was made and verified for viscoelastic flows used in the current study (Xi & Graham Reference Xi and Graham2010; Rogge & Park Reference Rogge and Park2022). This study focuses on results for the range of  $2000\le Re\le 5000$. This Reynolds number range for Newtonian flows is found to be subcritical and below the linear stability limit for two-dimensional flows but slightly beyond the transition for three-dimensional flows (Schmid & Henningson Reference Schmid and Henningson2001). For the viscoelastic cases, the polymer concentration ranges from dilute to semi-dilute regimes:
 $0.01\le c\le 0.09$. The Weissenberg number is in the range
 $32\lesssim Wi\lesssim 65$. Note that the current study holds the elasticity number constant at
 $El \approx 0.017$. The parameter
 $b = 5000$, which corresponds to a moderately flexible, high-molecular-weight polymer (Xi & Graham Reference Xi and Graham2010, Reference Xi and Graham2012). The extensibility parameter
 $Ex$ is defined as the polymer contribution to the steady-state stress in uniaxial extensional flow. For the FENE-P model,
 $Ex=2b(1-\beta )/3\beta$. Significant effects of polymers on turbulence are only expected when
 $Ex \gg 1$ for a dilute solution
 $(1-\beta \ll 1)$, which is the case of this study. For the sets of
 $\beta$ and
 $b$ studied, the values of
 $Ex$ are in the range of 34–330, which is sufficient to observe the effects of polymer solutions (Xi & Graham Reference Xi and Graham2010). This parameter space for the viscoelastic flow is found to be linearly stable (Castillo-Sánchez et al. Reference Castillo-Sánchez, Jovanović, Kumar, Morozov, Shankar, Subramanian and Wilson2022; Datta et al. Reference Datta2022).
The equation system above is coupled and integrated in time with a third-order semi-implicit backward differentiation and Adams–Bashforth method for the linear and nonlinear terms, respectively (Peyret Reference Peyret2002). As an effective approach to identifying the self-sustaining process in both Newtonian and viscoelastic flows (Jimenez & Moin Reference Jimenez and Moin1991; Webber, Handler & Sirovich Reference Webber, Handler and Sirovich1997), the so-called minimal flow unit (MFU) is employed. We use a domain of  $L_x\times L_y\times L_z=2{\rm \pi} \times 2\times {\rm \pi}$ and
 $4{\rm \pi} \times 2\times 2{\rm \pi}$ to simulate Newtonian and viscoelastic flows, respectively. It is worth noting that viscoelastic MFUs are larger than Newtonian ones to attain sustained turbulence (Wang et al. Reference Wang, Graham, Hahn and Xi2014). A numerical grid system is generated on
 $(N_x,N_y,N_z)$ (in
 $x$,
 $y$ and
 $z$) meshes, where a Fourier–Chebyshev–Fourier spectral spatial discretization is applied to all variables and nonlinear terms are calculated with the collocation method, for which the standard
 $2/3'$ dealiasing is used. The numerical grid systems used are
 $(N_x,N_y,N_z) = (64,81,76)$ for the Newtonian simulations and
 $(N_x,N_y,N_z) = (126,81,126)$ for the viscoelastic simulations, unless specified otherwise. The numerical grid spacings in the streamwise and spanwise directions are uniform with
 $\Delta x^+\approx 12$ and
 $\Delta z^+\approx 7$, respectively, for all cases. In the wall-normal direction, the non-uniform Chebyshev spacing is
 $\Delta y_{min}^+\lesssim 0.1$ at the wall and
 $\Delta y_{max}^+\approx 5$ at the channel centre.
An artificial diffusivity term  $1/(ScRe)\nabla ^2\boldsymbol {\alpha }$, with the Schmidt number
 $Sc = 0.5$, is added to the right-hand side of (2.4) to improve its numerical stability, as is common practice for spectral simulations of viscoelastic flows (Sureshkumar, Beris & Handler Reference Sureshkumar, Beris and Handler1997; Dimitropoulos, Sureshkumar & Beris Reference Dimitropoulos, Sureshkumar and Beris1998; Xi & Graham Reference Xi and Graham2010, Reference Xi and Graham2012; Rogge & Park Reference Rogge and Park2022). For the range of
 $Re$ given above, an artificial diffusivity
 $1/(ScRe)$ is of the order of
 $10^{-3}\unicode{x2013}10^{-4}$, which is much lower than often used in other studies with
 $1/(ScRe) = O(10^{-2})$ (Sureshkumar et al. Reference Sureshkumar, Beris and Handler1997; Ptasinski et al. Reference Ptasinski, Boersma, Nieuwstadt, Hulsen, Van Den Brule and Hunt2003; Li, Sureshkumar & Khomami Reference Li, Sureshkumar and Khomami2006, Reference Li, Sureshkumar and Khomami2015). In the low-to-moderate
 $Wi$ and dilute-to-semi-dilute regimes of the present study, these very small magnitudes of artificial diffusivity should not have a significant impact on the numerical solutions, while still contributing to numerical stability, which has also been confirmed by previous studies (Sureshkumar et al. Reference Sureshkumar, Beris and Handler1997; Housiadas, Beris & Handler Reference Housiadas, Beris and Handler2005; Li et al. Reference Li, Sureshkumar and Khomami2006; Kim et al. Reference Kim, Li, Sureshkumar, Balachandar and Adrian2007; Zhu & Xi Reference Zhu and Xi2020). Since introducing such an artificial term, an additional treatment for a boundary condition on (2.4) is needed. We update
 $\boldsymbol {\alpha }$ at the walls using the solution without the artificial diffusivity. These results are then used as the boundary condition to solve (2.4) with the artificial diffusivity term and we then update
 $\boldsymbol {\alpha }$ for the rest of the channel. The numerical details used in the present study can be found in Xi (Reference Xi2009). The numerical code used here has been extensively validated in the previous studies (Xi & Graham Reference Xi and Graham2010, Reference Xi and Graham2012; Wang et al. Reference Wang, Graham, Hahn and Xi2014; Wang, Shekar & Graham Reference Wang, Shekar and Graham2017; Rogge & Park Reference Rogge and Park2022).
The initial velocity field is a superposition of the parabolic laminar base flow  $\boldsymbol {u}_{lam}$ and a three-dimensional perturbation flow:
 $\boldsymbol {u} = \boldsymbol {u}_{lam} + a\boldsymbol {u}_{p}$, where
 $a$ is the magnitude of the perturbation flow field, which is adjustable in the current study. Different laminar base flows
 $\boldsymbol {u}_{lam}$ are used for Newtonian and viscoelastic flows. The Newtonian laminar flow is a typical parabolic velocity profile of a plane Poiseuille flow (White Reference White2006), while a viscoelastic laminar flow is obtained from the plane Poiseuille flow solution of a FENE-P fluid (Cruz, Pinho & Oliveira Reference Cruz, Pinho and Oliveira2005). The viscoelastic laminar flow is a modified version of the Newtonian laminar flow to which contributions due to polymers (i.e.
 $Wi$,
 $\beta$ and
 $b$) are added. In addition, the laminar base state for the polymer stress tensor is also considered (Lee & Zaki Reference Lee and Zaki2017). The perturbation field
 $\boldsymbol {u}_{p}$ is generated using the subroutine randomfield through Channelflow (Gibson Reference Gibson2012), where its spectral coefficients of the three velocity components are set to decay exponentially with respect to the wavenumber to ensure the smoothness of the flow, similar to turbulent fields. The perturbation field also satisfies no-slip and divergence-free conditions (see Appendix C in Pershin et al. (Reference Pershin, Beaume, Eaves and Tobias2022) for details of the subroutine randomfield). This perturbation field is similar to that commonly used for the optimal disturbance to control a transition to turbulence (Farano et al. Reference Farano, Cherubini, Robinet and De Palma2015; Pershin et al. Reference Pershin, Beaume, Eaves and Tobias2022). However, it should be emphasized that the particular form of
 $\boldsymbol {u}_p$ does not matter as long as it leads to an instability that triggers a transition to turbulence (Faisst & Eckhardt Reference Faisst and Eckhardt2004). Owing to the extensional flow nature of transitional and turbulent flows, there are always positive Lyapunov exponents in Newtonian channel flows (Keefe, Moin & Kim Reference Keefe, Moin and Kim1992; Nikitin Reference Nikitin2018) and even viscoelastic channel flows (Stone & Graham Reference Stone and Graham2003), resulting in a quick memory loss of the initial conditions. Darbyshire & Mullin (Reference Darbyshire and Mullin1995) also experimentally confirmed that different kinds of perturbations result in a very similar stability curve. Nonetheless, the choices of the different forms of the perturbation field were tested, showing similar behaviours such as scaling laws (Mullin Reference Mullin2011). In addition, for optimal perturbations, where the maximum energy growth is efficiently reached during the transition process, similar scaling behaviour was observed (Farano et al. Reference Farano, Cherubini, Robinet and De Palma2015). Therefore, it can be safely assumed that the effect of the perturbation field on the transition to turbulence can be focused only on its magnitude.
Throughout the paper, the perturbation amplitude  $A$ is defined as the ratio of the
 $L_2$-norm of the perturbation velocity field
 $\boldsymbol {u}_{p}$ to that of the base laminar velocity field
 $\boldsymbol {u}_{lam}$
 \begin{equation} A = \frac{\| \boldsymbol{u}_{p}\|_2}{\| \boldsymbol{u}_{lam}\|_2} = a \sqrt{ \int_{V}\boldsymbol{u}_{p}^2\,{\rm d}V \left/\, \int_{V}\boldsymbol{u}_{lam}^2\,{\rm d}V \right.}, \end{equation}
where  $V = 2L_x L_z$ is the volume of the computational domain. The amplitude squared
 $A^2$ can also be referred to the ratio of the kinetic energy of
 $\boldsymbol {u}_{p}$ to that of
 $\boldsymbol {u}_{lam}$. The perturbation amplitude studied is in the range of
 $0.014 \leq A \leq 0.14$ to ensure small-amplitude perturbations for promoting a linear instability during the transition to turbulence (Schmid & Henningson Reference Schmid and Henningson2001). It is also important to note that, due to the addition of a global artificial diffusion and use of spectral method, it is almost unachievable to trigger transition to turbulence for
 $Re<2000$, even with a sufficiently large perturbation amplitude
 $A > 0.14$.
Prior to proceeding to the results, it is worth emphasizing the flow regime of the current study. For  $El < 0.02$ and
 $2000 \leq Re \leq 5000$, the flow regime of interest can be referred to as inertia-driven transition for both Newtonian and dilute viscoelastic flows (Datta et al. Reference Datta2022). The EIT flow regime, which is typically
 $El\gg 0.02$ (Dubief et al. Reference Dubief, Terrapon and Soria2013; Samanta et al. Reference Samanta, Dubief, Holzner, Schäfer, Morozov, Wagner and Hof2013), is distinctly different from the current flow regime. Thus, a quantitative or even qualitative comparison between the current inertia-driven transition and EIT transition should not necessarily be expected in the following results.
3. Results and discussion
We perform direct numerical simulations starting from a laminar base flow disturbed with a small finite-amplitude perturbation for both Newtonian and viscoelastic flows. The amplitude of the perturbation was set to be in the range of  $0.014\leq A \leq 0.14$ relative to the total energy of the laminar base flow.
3.1. Transition dynamics
To examine the temporal behaviour of the transition dynamics, figure 1(a) illustrates the evolution of the disturbance energy per unit volume  $E(t)$, which is given as
 \begin{equation} E(t)=\frac{1}{2L_xL_z}\int_{0}^{L_z}\int_{{-}1}^{1}\int_{0}^{L_x} (u'^2+v'^2+w'^2)\,\textrm{d}\,x\,\textrm{d}\kern0.05em y\,\textrm{d}z, \end{equation}
where the streamwise velocity fluctuation  $u' = u - u_{lam}$, while
 $v' = v$ and
 $w' = w$ since
 $v_{lam} = 0$ and
 $w_{lam} = 0$. Profiles are normalized by the initial disturbance energy
 $E_0$. At
 $t = 0$, the same amplitude of perturbation
 $A = 0.07$ was applied to both Newtonian and viscoelastic (
 $c=0.03$ or
 $\beta =0.97$) flows at
 $Re = 2500$. As has been typically observed in transition to turbulence (Schmid & Henningson Reference Schmid and Henningson2001), both flows exhibit a similar early-time behaviour of the energy growth: (i) an initial stable period, (ii) a sharp increase up to the maximum value, or namely a strong burst, and (iii) transition to a fully turbulent flow. However, the first notable distinction between both flows is the duration of the initial stable period. As clearly seen in figure 1(a), the viscoelastic flow experiences a shorter stable duration than the Newtonian counterpart. In other words, polymers appear to destabilize the flow earlier than the Newtonian flow, triggering an earlier transition. Another distinction lies in the strong burst whose magnitude is significantly reduced by polymers. This strong burst has also been referred to as the escaping process out of the so-called exact coherent solution along its most unstable manifold (Itano & Toh Reference Itano and Toh2001; Park, Shekar & Graham Reference Park, Shekar and Graham2018), comprising the linearly unstable stage followed by the nonlinear evolution stage. A log–linear representation of the evolution of the disturbance energy per unit volume
 $E(t)$ is shown in figure 1(b). The exponential amplification of the perturbations in both Newtonian and viscoelastic flows is marked by dotted lines with
 $\sigma$ values equal to
 $0.06$ and
 $0.05$ for Newtonian and viscoelastic flows, respectively. After the strong burst, both flows enter a fully turbulent regime at
 $t \approx 150$, where turbulent DR via polymers is manifested.
Temporal evolution of the disturbance energy  $E(t)$ normalized by the initial disturbance energy
 $E_0$ on (a) a linear–linear scale and (b) a log–linear scale for Newtonian (black dashed line/squares) and viscoelastic flows (
 $c = 0.03$ or
 $\beta = 0.97$; blue solid line/circles). Both flows are disturbed by the perturbation amplitude
 $A = 0.07$ at
 $Re = 2500$. The amplification of the perturbation (straight lines in
 $b$) behaves like
 $e^{\sigma t}$, where
 $\sigma = 0.06$ and
 $0.05$ for Newtonian and viscoelastic flows, respectively.

To further characterize the transition to turbulence, we utilize the mean wall shear stress  $\tau _w$ as a means to estimate the transitional trajectory of Newtonian and viscoelastic flows, as it has been widely utilized to characterize the intermittent dynamics of both flows (Xi & Graham Reference Xi and Graham2012). The top panels in figure 2 show the temporal evolution of the wall shear stress for Newtonian and viscoelastic flows of various polymer concentrations perturbed with
 $A = 0.07$ at
 $Re = 2000$,
 $2500$ and
 $3000$ along with the base laminar state whose wall shear stress
 $\tau _{w,lam} = 2$. The response of the flow to the perturbation can be divided in two distinct cases: (a) the flow remains undisturbed or (b) the flow departs from the base laminar state and begins its path to turbulence shortly after the introduction of the perturbation. For
 $Re = 2000$ (figure 2a), the Newtonian flow remains undisturbed (case a), whereas the viscoelastic flows of all polymer concentrations begin transition at a few time instants after the introduction of the perturbation (case b). For
 $Re\geq 2500$, both Newtonian and viscoelastic flows follow a transition trajectory (case b). As clearly seen in figure 2(b), the transition begins at an earlier time for viscoelastic flows than for their Newtonian counterpart, indicating an earlier transition. At a higher Reynolds number of
 $Re = 3000$ (figure 2c), however, the transition appears to begin at almost the same time for Newtonian and viscoelastic flows. Similar to the perturbation energy in figure 1(a), the maximum wall shear stress of the strong burst in viscoelastic flows is smaller than the one in Newtonian flow. Furthermore, the maximum wall shear stress is reduced with increasing polymer concentration, implying that the magnitude of the strong burst decreases with polymer concentration. The reduction of the aforementioned maximum wall shear stress of the polymer solutions is also an important indicator of DR in sustained turbulent flow regimes. Hence, turbulent DR is expected for viscoelastic flows compared with Newtonian counterparts, as can be seen in the wall shear stress in figure 2(b,c). The bottom panels in figure 2 show the temporal evolution of the bulk polymer stretching
 ${\rm tr}(\alpha )_b$ normalized by the maximum extensibility of polymers
 $b$ for various polymer concentrations. Interestingly, the bulk polymer stretching of all polymer concentrations is almost identical and increases very slowly until a sharp increase begins at almost the same time as the wall shear stress starts to increase sharply.
Temporal evolution of the (top panel) wall shear stress  $\tau _w$ and (bottom panel) bulk polymer stretching normalized by the maximum extensibility of polymers
 $tr(\alpha )_b/b$ for the perturbation amplitude
 $A=0.07$ at(a)
 $Re=2000$ (b)
 $Re=2500$ and (c)
 $Re=3000$: laminar state (black dashed line), Newtonian flow (black solid line) and viscoelastic flows of various polymer concentrations (coloured solid lines).

As an alternative to characterize the transition to turbulence, the distortion of the mean velocity profile has also been utilized for Newtonian flows, as its relationship to the formation of vortical structures during transition has been well established (Lemoult et al. Reference Lemoult, Aider and Wesfreid2012). Figure 3 shows snapshots of the mean velocity profile  $U_m$ normalized by the Newtonian laminar centreline velocity
 $U_{cl}$ at
 $Re = 2500$ at four different time instants for Newtonian and viscoelastic (
 $c = 0.03$) flows along with the base laminar profile as a reference. At
 $t = 55$, the velocity profile of both flows appears to be close to the base laminar profile. At the peak of the strong burst for the viscoelastic flow (
 $t = 90$), the deformation of the mean velocity profile is evident, while its Newtonian counterpart remains almost unchanged up to
 $t = 100$. At the peak of the strong burst for the Newtonian flow (
 $t = 125$), however, a severe deviation from the laminar profile is observed for both flows. Once the fully turbulent state is reached (
 $t = 300$), the viscoelastic profile is closer to the laminar profile, suggesting drag reduction by polymers. For a further investigation, figure 4 shows the temporal evolution of the peak velocity
 $U_{peak}$ normalized by the centreline velocity
 $U_{cl}$ for Newtonian and viscoelastic flows of various polymer concentrations at
 $Re = 2000$,
 $2500$ and
 $3000$ perturbed with
 $A=0.07$. The base laminar state is also included, for which
 $U_{peak}/U_{cl}=1$. Similarly, the response of the flow can be equally distinguished by cases (a) and (b) when utilizing
 $U_{peak}/U_{cl}$. For
 $Re=2000$ (figure 4a), the Newtonian flow departs slightly from the laminar state; however, the transition is not achieved and the flow remains laminar (case a), whereas the viscoelastic flows of all polymer concentrations deviate from the laminar state and continue the transitional path to turbulence (case b). Once the transition to turbulence is established, the velocity ratio quickly decreases until a fully turbulent state is reached. For
 $Re\geq 2500$, both Newtonian and viscoelastic flows respond following the path of case (b). The earlier departure from the laminar state ratio of 1 is clearly observed for viscoelastic flows in figure 4(b), as in the wall shear stress (figure 2b). The similarity in the start of transition in Newtonian and viscoelastic flows at
 $Re=3000$ can also be confirmed by figure 4(c).
Temporal evolution of the mean velocity profile  $U_m$ normalized by the laminar centreline velocity
 $U_{cl}$ for the perturbation amplitude
 $A=0.07$ at
 $Re=2500$ with the time instants
 $t = 55$, 90, 125 and 300: laminar state (black dotted line), Newtonian flow (black dashed line) and viscoelastic flow (
 $c=0.03$; blue solid line).

Temporal evolution of the peak velocity normalized by the laminar centreline velocity for the perturbation amplitude  $A=0.07$ at (a)
 $Re=2000$, (b)
 $Re=2500$ and (c)
 $Re=3000$: laminar state (black dashed line), Newtonian flow (black squares) and viscoelastic flow of various polymer concentrations (coloured symbols).

3.2. Transition time: onset of transition
Now, we proceed to investigate the time for the onset of transition. The transition time  $T_t$ is defined as the time at which the wall shear stress reaches 105 % of the base laminar value (
 $\tau _w = 2.1$). The sensitivity to the chosen threshold value was examined by utilizing different threshold values, such as 110 % and 115 %, showing almost identical trends with an upward shift in the time it takes for each case to reach the threshold criteria. In addition, the sensitivity to the chosen parameter was also examined by utilizing the peak velocity, such as figure 4, with the threshold of 95 % of the base laminar value, showing an almost identical trend. It should be noted that the aforementioned criteria for the onset of transition can only be detected in cases where the perturbation amplitude is strong enough to trigger transition for both Newtonian and viscoelastic flows.
Figure 5 shows the transition time for Newtonian and viscoelastic flows of various polymer concentrations at Reynolds numbers up to  $5000$ as a function of perturbation amplitude. As expected, the overall trend appears to be similar for both Newtonian and viscoelastic flows, where the transition time decreases with increasing perturbation amplitude and Reynolds number. The earlier transition for viscoelastic flows is also confirmed by a smaller
 $T_t$ regardless of polymer concentration (i.e. transition is initiated at an earlier time than Newtonian flow). Interestingly, it seems that the polymer concentration has a negligible effect on the transition time for all
 $Re$. Yet, as clearly observed in all Reynolds numbers studied, the main difference is that the viscoelastic flow requires a lower perturbation amplitude to trigger the transition in comparison with its Newtonian counterpart. For example, figure 5(a) shows that, at
 $Re = 2000$, the lowest or critical perturbation amplitudes to trigger transition are
 $A \approx 0.08$ and
 $A \approx 0.05$ for the Newtonian and viscoelastic flows, respectively. Increasing the Reynolds number lowers the critical perturbation amplitude for both Newtonian and viscoelastic flows. In addition, the difference between the Newtonian and viscoelastic transition times
 $\Delta T_t$ gets smaller with increasing
 $Re$. In order to better explore the effect of Reynolds number, we replot the transition time as a function of Reynolds number at a given perturbation amplitude, as shown in figure 6. For viscoelastic flows, the polymer concentration
 $c = 0.03$ is only used as the polymer concentration appears to have no impact on the transition time. At three perturbation amplitudes considered, the transition time decreases monotonically for both flows with increasing Reynolds number. For a relatively weak perturbation amplitude
 $A = 0.07$ (figure 6a),
 $\Delta T_t \approx 6$ and this value remains almost constant with increasing Reynolds number. However, for relatively strong perturbation amplitudes of
 $A > 0.07$ (figure 6b,c),
 $\Delta T_t$ becomes more significant for lower Reynolds numbers but gets much smaller with increasing Reynolds number. For
 $A = 0.12$ (figure 6c), the transition time of the viscoelastic flow barely decreases with Reynolds number, and
 $\Delta T_t$ is almost negligible at
 $Re = 5000$. It is worth noting that, at the given Reynolds number, the transition time decreases with the perturbation amplitude. However, the level of DR achieved by the same polymer parameters during sustained turbulence would be very similar and insensitive to the transition time.
Transition time as a function of perturbation amplitude  $A$ at (a)
 $Re=2000$, (b)
 $Re=3000$,(c)
 $Re=4000$ and (d)
 $Re=5000$: Newtonian flow (black open squares) and viscoelastic flow of various polymer concentrations (coloured solid circles). Refer to the legend in figure 2 for colours for polymer concentration.

Transition time as a function of Reynolds number  $Re$ for the perturbation amplitude (a)
 $A = 0.07$, (b)
 $A = 0.10$ and (c)
 $A = 0.12$ for Newtonian flow (black open squares) and viscoelastic flow (
 $c=0.03$; blue solid circles).

3.3. Stability curve: critical perturbation amplitude
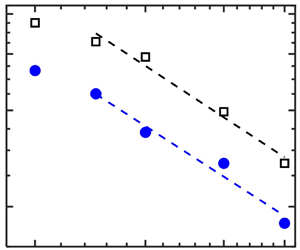
Next, we present the finite-amplitude thresholds for the perturbation to start triggering the transition or the critical perturbation amplitude  $A_c$ below which no transition occurs. Figure 7 shows
 $A_c$ for Newtonian and viscoelastic (
 $c = 0.03$) flows on a log–log scale. As expected from the previous studies for Newtonian flows (e.g. Hof et al. Reference Hof, Juel and Mullin2003; Lemoult et al. Reference Lemoult, Aider and Wesfreid2012), our Newtonian flow (black open squares) clearly follows a power-law scaling of
 $Re^\gamma$ for
 $Re \ge 2500$. As was observed by Lemoult et al. (Reference Lemoult, Aider and Wesfreid2012), it is also observed that the asymptotic regime is not reached at lower Reynolds numbers for
 $Re < 2500$. The critical exponent
 $\gamma$ for the Newtonian flow is very close to
 $-$1.25, which has also been reported for transition in PPF triggered by a perturbation leading to streamwise vortices (Chapman Reference Chapman2002). Most interestingly, the viscoelastic flow also follows almost the same power-law scaling as the Newtonian flow with
 $\gamma \approx -1.25$ for
 $Re \ge 2500$. It can also be observed that the viscoelastic
 $A_c$ is smaller than the Newtonian
 $A_c$, which suggests that smaller finite perturbation amplitudes are sufficient to trigger transition for viscoelastic flows compared with their Newtonian counterparts. It should be noted that the same scaling law with a constant exponent is found for different perturbation fields generated by Channelflow, while the asymptotic lines are shifted upward or downward depending on the characteristics of the perturbation structure (see the Appendix).
Log–log plot of the stability curve for the onset of transition to turbulence in the range of  $2000\le Re\le 5000$. Newtonian flow (black open squares) and viscoelastic flow (
 $c = 0.03$) (blue solid circles). For
 $Re \ge 2500$, the minimum or critical perturbation amplitude
 $A_c$ follows a power-law scaling of
 $A_c = O(Re^{\gamma })$, where
 $\gamma \approx -1.25$ for both Newtonian and viscoelastic flows.

For a comprehensive understanding of transition to turbulence and a direct comparison between Newtonian and viscoelastic flows, figure 8(a,b) presents the state diagram of the transition time  $T_t$ in a space of the perturbation amplitude
 $A$ and Reynolds number
 $Re$ for Newtonian and viscoelastic (
 $c = 0.03$) flows, respectively. As can be seen, there are two distinct regions, laminar and turbulent, separated by the laminar–turbulent boundary (thick black line) separating the basins of attraction of laminar and turbulent flows (Schneider, Eckhardt & Yorke Reference Schneider, Eckhardt and Yorke2007; Duguet, Willis & Kerswell Reference Duguet, Willis and Kerswell2008). This boundary indeed represents the critical perturbation amplitude
 $A_c$ in figure 7. Since there are theoretical arguments that the so-called exact coherent states (ECSs) form a part of the basin boundary (Kawahara Reference Kawahara2005; Wang, Gibson & Waleffe Reference Wang, Gibson and Waleffe2007), the dynamics on or near this boundary could play an important role in finding new ECSs in viscoelastic flows or EIT (Page et al. Reference Page, Dubief and Kerswell2020; Buza et al. Reference Buza, Beneitez, Page and Kerswell2022; Dubief et al. Reference Dubief, Page, Kerswell, Terrapon and Steinberg2022), which will be a subject of interesting future work.
Colour contour of the transition time  $T_t$ due to a finite amplitude of the perturbation
 $A$ at Reynolds number
 $Re$ for (a) Newtonian flow and (b) viscoelastic (
 $c = 0.03$) flow. The thick black line separates the basins of attraction of laminar and turbulent flows.

Clearly, this boundary is shifted down for the viscoelastic flow, suggesting that the laminar region is shrunk by polymers. It also suggests the reduction in the perturbation magnitude required to trigger transition for viscoelastic flows. A shorter transition time of the viscoelastic flow can be readily identified in comparison with the Newtonian flow at the given Reynolds number and perturbation amplitude. Interestingly, the decay rate of the transition time with respect to the Reynolds number shows distinct trends. As can be seen in lines of constant  $T_t$ values from 60 to 10, the slope of these lines gets steeper for the Newtonian flow, while the lines level off for the viscoelastic flow. This could suggest that, at very high perturbation amplitudes, the effect of polymers on the transition time or the early stage of transition is almost the same, regardless of Reynolds number, which can also be confirmed by figure 6(c).
3.4. Mechanism: velocity fluctuations, flow structures and polymer dynamics
We now attempt to elucidate the mechanisms behind the earlier transition triggered by polymers in viscoelastic flows. Figure 9(a) shows the evolution of the wall shear stress at  $Re = 2500$ for Newtonian and viscoelastic (
 $c = 0.03$) flows at four different time instants. Figure 9(b–d) shows snapshots of the velocity fluctuations in the streamwise
 $u_{rms}$, wall-normal
 $v_{rms}$ and spanwise
 $w_{rms}$ directions at each time instant for both flows. An observation to draw from figure 9(c,d) at
 $t = 55$ is that changes in the wall-normal velocity fluctuation
 $v_{rms}$ and spanwise velocity fluctuation
 $w_{rms}$ in the viscoelastic flow, with respect to its Newtonian counterparts, are somewhat more significant compared with the streamwise velocity fluctuation
 $u_{rms}$. For the Newtonian case,
 $v_{rms}$ is significantly lower near the wall and
 $w_{rms}$ is barely observed compared with ones for the viscoelastic flow. This suggests that the wall-normal and spanwise directions are destabilized earlier by polymers, eventually promoting an earlier transition. In other words, an early transition observed in the viscoelastic flow is attributed to the early destabilization of the wall-normal and spanwise directions due to polymers. As the transition process proceeds,
 $v_{rms}$ and
 $w_{rms}$ of the Newtonian flow take over and continue to be larger than those of the viscoelastic flow. Once the transitional period of both flows has passed (
 $t =300$), a fully sustained turbulent regime begins, where the expected characteristics of the drag-reduced flow are observed such that
 $v_{rms}$ and
 $w_{rms}$ of the viscoelastic flow are lower than those of the Newtonian flow (Li et al. Reference Li, Sureshkumar and Khomami2006). This whole process can be seen in the accompanying supplementary movie.
(a) Temporal evolution of the wall shear stress  $\tau _w$ at
 $Re = 2500$ for the perturbation amplitude
 $A = 0.07$ for Newtonian flow (black dashed line) and viscoelastic flow (
 $c = 0.03$; blue solid line) with the time instants
 $t = 55$, 90, 125 and 300. Snapshots of the (b) streamwise, (c) wall-normal and (d) spanwise velocity fluctuations at each time instant shown in (a). Also see the accompanying supplementary movie available at https://doi.org/10.1017/jfm.2023.930.

This destabilization mechanism is further studied by estimating the effect of viscoelasticity on flow structures. Vortex identification is performed by utilizing the so-called  $Q$-criterion (Jeong & Fazle Reference Jeong and Fazle1995) for which
 $Q=\frac {1}{2} (\|\boldsymbol {\varOmega }\|^2-\|{\boldsymbol {S}}\|^2)$ is computed, where
 ${\boldsymbol {S}}\equiv \frac {1}{2}(\boldsymbol {\nabla }{\boldsymbol {u}}+\boldsymbol {\nabla }{\boldsymbol {u}}^T)$ is the rate of strain tensor and
 $\boldsymbol {\varOmega }\equiv \frac {1}{2}(\boldsymbol {\nabla }{\boldsymbol {u}}-\boldsymbol {\nabla }{\boldsymbol {u}}^T)$ is the vorticity tensor. Regions of
 $Q > 0$ correspond to the areas of strong vortical motions. Figure 10 shows snapshots of these vortical structures for the lower half of the channel for Newtonian flow (a–d) and viscoelastic flows of
 $c = 0.03$ (e–h) at different time instants that can also be seen in the evolution of wall shear stress in figure 9(a). The red tubes represent isosurfaces of
 $Q = 0.216$, which is approximately half of the maximum of the sustained viscoelastic turbulent flow for this particular case. For comparison, the half of the maximum of the sustained Newtonian turbulent flow is
 $Q = 2.21$. The blue contours correspond to isosurfaces of constant streamwise velocity, which could represent a spatial structure for the streak.
Temporal evolution of vortical structures for the bottom half-channel: (a–d) for Newtonian and (e–h) viscoelastic ( $c=0.03$) flows at
 $Re = 2500$ triggered by the perturbation amplitude
 $A = 0.07$. The red tubes are isosurfaces at constant vortex strength
 $Q = 0.216$, and the blue contours are isosurfaces of constant streamwise velocity. The maximum strengths are (a) 0.018, (b) 1.29, (c) 14.64, (d) 4.25, (e) 4.49, ( f) 2.39,(g) 0.25 and (h) 0.63. For reference, the maximum vortex strengths for sustained turbulence are
 $Q = 4.42$ and
 $Q = 0.48$ for Newtonian and viscoelastic flows, respectively. Also see the accompanying supplementary movies. (a,e) t = 55, (b,f) t = 90, (c,g) t = 125 and (d,h) t = 300.

Figure 10(a,e) shows the flow structures at the beginning stage of the transition process ( $t = 55$) for Newtonian and viscoelastic flows, respectively. As polymers destabilize the flow earlier which results in rapid energy growth, the streamwise-elongated red tubes or quasi-streamwise vortices start to form around wavy, uplifted blue isosurfaces, whereas its Newtonian counterpart remains undisturbed. This wavy, uplifted structure indeed signifies the form of low-speed streaks, which is one of the key ingredients for the self-sustaining process (Waleffe Reference Waleffe1997). It should be noted that, given the flow regime of the current study, the spanwise-oriented structures that are predominantly observed in the EIT regime are unlikely to be observed. As the viscoelastic flow reaches its bursting peak at
 $t = 90$, figure 10( f) shows a relatively larger population of vortex cores formed around more enhanced low-speed streaks. After the bursting peak, the vortices are then quickly dampened as polymers work against them, entering a drag-reduced turbulent regime (figure 10
 $h$ at
 $t = 300$). In comparison, when its Newtonian counterpart reaches its bursting peak at
 $t = 125$ (figure 10c), more heavily populated vortex cores are formed across almost the entire domain, where the characteristics of the vortical structures are hard to identify. After the strong bursting peak, however, some of the quasi-streamwise vortices are observed as seen in figure 10(d).
In addition to the velocity fluctuations and flow structures, the polymer dynamics can also provide the underlying mechanism behind the early transition. As the more stretched polymer state ties into the more unstable flow state (Xi & Graham Reference Xi and Graham2010; Graham Reference Graham2014), we can refer to the bulk polymer stretching in figure 2. In the early transition stage, the polymers start to stretch slowly as they interact with the flow. As they keep stretching, polymers continue to destabilize the flow to enhance the velocity fluctuations. The transition eventually occurs when the bulk polymer stretching reaches a certain value, depending on the Reynolds number and perturbation amplitude, after which the bulk polymer stretching starts to increase sharply, as seen in figure 2.
In short, the destabilization mechanism of polymers during transition is attributed to the early amplification of the wall-normal and spanwise velocity fluctuations and the formation of the quasi-streamwise vortices around a low-speed streak, all of which facilitate an early transition. Interestingly, the vortical structures observed in both Newtonian and viscoelastic flows also support the power exponent  $\gamma = -1.25$ in the power-law scaling of the critical perturbation amplitude in figure 7, as also observed in the previous study (Chapman Reference Chapman2002). It should be noted, however, that a perturbation leading to different flow structures could provide a power-law scaling with a different exponent. In addition, this study focuses on a dilute polymer solution (
 $c < 0.1$) and low elasticity (
 $El < 0.02$), where only an early transition is observed. Thus, it could suggest a subject of future work for the transition to turbulence in polymer solutions at semi-concentrated or highly concentrated regimes above the overlap concentration and at high elasticity (
 $El \gg 0.02$) such as within the EIT regime, where different transition scenarios or flow structures could arise (Datta et al. Reference Datta2022).
4. Conclusion
Direct numerical simulations of dilute polymer solutions with a FENE-P model were performed to investigate the effect of polymers on the laminar–turbulent transition in plane Poiseuille (channel) flow. Starting from a base laminar state, which is disturbed with a small finite-amplitude perturbation, the short stable period was observed for both Newtonian and viscoelastic flows at the beginning followed by the linear and nonlinear evolution of the disturbance energy. However, the viscoelastic flow experiences a shorter duration of the stable period, hinting at a destabilizing effect of the polymers during the early stages of transition. Also, we observed that the viscoelastic flow requires a smaller amplitude of perturbation to trigger transition, whereas the Newtonian counterpart remains undisturbed until a larger amplitude is utilized to trigger transition. We show that the transition time  $T_t$, defined as the onset time of transition, decreases with increasing perturbation amplitude. As polymers promote an early transition, the Newtonian flow exhibits a higher
 $T_t$ than the viscoelastic flow, but this difference becomes less pronounced as
 $Re$ is increased. Interestingly, the polymer concentration studied (
 $0.01 \le c \le 0.09$) barely has an effect on the transition time. However, the higher the polymer concentration, the lower the magnitude of the strong burst, suggesting that higher polymer concentrations exhibit enhanced drag-reducing behaviour after the onset of transition.
We then investigated the critical perturbation amplitude  $A_c$, which is the minimum amplitude to trigger the transition. The viscoelastic flow shows a smaller
 $A_c$ than its Newtonian counterpart, suggesting that polymers kick in the destabilizing effect early. Similar to previous studies for Newtonian transition, the critical amplitude of our Newtonian flow follows a power-law scaling of
 $Re^\gamma$ for
 $Re \ge 2500$, where
 $\gamma \approx -1.25$. More interestingly, a viscoelastic flow also follows almost the identical power-law scaling as the Newtonian flow. Both flows display almost the same critical exponent of
 $\gamma \approx -1.25$ for
 $Re \ge 2500$. This critical exponent implies that the perturbation of the current study leads to the formation of quasi-streamwise vortices (Chapman Reference Chapman2002).
The early transition or destabilization effect triggered by polymers is further investigated. During the stable period at the beginning stage of transition, the wall-normal and spanwise velocity fluctuations start to grow early in the viscoelastic flow, compared with those of the Newtonian flow. Hence, the polymers appear to destabilize these components of the velocity fluctuation quickly, promoting an earlier transition. Once the fully turbulent stage is reached after the strong burst, however, the drag-reducing behaviour of polymers is observed, where the wall-normal and spanwise velocity fluctuations for the viscoelastic flow are reduced and become smaller than those of the Newtonian flow. This destabilizing effect of polymers was also confirmed by considering the bulk polymer stretching and visualizing the flow structure, where the vortical motions are shown up earlier around low-speed streaks for a viscoelastic flow. Interestingly, it is possible to see the formation of quasi-streamwise vortices for both flows, which supports the critical exponent of  $\gamma \approx -1.25$ for the power-law scaling of the critical amplitude.
This study further complements the previous studies on the laminar–turbulent transition by providing the power-law scaling of the critical perturbation amplitude for both Newtonian and viscoelastic flows, which has been mostly unexplored. The destabilizing effect of polymers during the early stage of transition is consistent with the effects of a low elasticity number and polymer concentration, as is the case of our study. Moving forward, the robustness of the power-law scaling on different perturbation structures should be further investigated. Additionally, higher elasticity numbers and polymer concentrations may lead to different transition dynamics and mechanisms, which will be a subject of interesting future work.
Supplementary movies
Supplementary movies are available at https://doi.org/10.1017/jfm.2023.930.
Acknowledgements
The direct numerical simulation code used was developed and distributed by J. Gibson at the University of New Hampshire. The authors also acknowledge the computing facilities used at the Holland Computing Center at the University of Nebraska-Lincoln.
Funding
Research is supported by the US Department of Energy, Office of Science, Office of Basic Energy Sciences under award number DE-SC0022280 (modelling studies) and by the National Science Foundation under award numbers OIA-1832976 and CBET-2142916 (CAREER) (computational studies).
Declaration of interests
The authors report no conflict of interest.
Appendix. Different perturbation forms
Figure 11 shows the critical perturbation amplitude  $A_c$ for Newtonian and viscoelastic (
 $c = 0.03$) flows on a log–log scale for various perturbation forms, where form I is the perturbation used in the current study. These perturbations were generated by Channelflow, which allows us to create different forms of the perturbation field in terms of different vortical structures and strengths. It is observed that the same power-law scaling of
 $A_c = O(Re^{\gamma })$ with
 $\gamma \approx -1.25$ is found for both Newtonian and viscoelastic flows with all perturbation forms studied for
 $Re \geq 2500$, while asymptotic lines are shifted upward or downward depending on different perturbation forms. It should be noted, however, that a Newtonian flow of form IV exhibits a slightly higher exponent of
 $\gamma \approx -1.50$. Although the different forms of the perturbation lead to the same stability scaling, a detailed analysis of the transition dynamics due to each different perturbation form is necessary but beyond the scope of the current study, and will be a subject of future work.
Log–log plot of the stability curve for the onset of transition to turbulence in the range of  $2000 \leq Re \leq 5000$ of the different perturbations: (a) form I (current study), (b) form II, (c) form III and (d) form IV. Each form is meant to display different vortical structures in terms of the strength and shape. Newtonian flow (black open squares); viscoelastic flow (
 $c = 0.03$) (blue solid circles). For
 $Re \geq 2500$, the minimum or critical perturbation amplitude
 $A_c$ follows a power-law scaling of
 $A_c = O(Re^\gamma )$, where
 $\gamma \approx -1.25$ for all the cases, except for a Newtonian case in form IV of
 $\gamma \approx -1.50$.


 Open access

