


A well-established and yet still-growing literature seeks to evaluate democracy's impact on a range of development outcomes: health, education, wages, and economic growth (John Reference John2003; Lake and Baum Reference Lake and Baum2001; Leftwich Reference Leftwich2002; Olson Reference Olson1993; Przeworski et al. Reference Przeworski and Alvarez2000; Rodrik Reference Rodrik1999; Wintrobe, Reference Wintrobe1998). Distributional considerations often lie at this literature's conceptual core: democracy's impact on education, health, and economic performance often depends on how political leaders in different regimes divide the pie. Although we now understand more about the empirical patterns linking democracy to a variety of socioeconomic outcomes, we know less about exactly why those patterns exist. Many of the theoretical explanations are statements about democracy's distributional effects that relate to how the existence of an electoral challenge changes the politician's calculus (Bueno de Mesquita et al. Reference Bueno de Mesquita and Morrow2001; Lake and Baum Reference Lake and Baum2001; Przeworski Reference Przeworski1990; Przeworski et al. Reference Przeworski and Alvarez2000). The classic formulation of the theoretical question asks whether democracy compels politicians to place more weight on the preferences expressed by wide segments of the electorate (usually consumption) relative to more narrowly construed, yet economically powerful interests (usually investment) (de Schweinitz Reference de Schweinitz1964; Huntington Reference Huntington1968; Pastor and Sung Reference Pastor and Sung1995).
Unfortunately, there is little direct empirical evidence that democracy forces politicians to broaden their political support to win elections. We know, for example, that there are strong correlations between democracy and a host of important socioeconomic outcomes (education, infant mortality rates, fertility, etc.), but we can only assume that (but remain unsure whether) these patterns result from attempts to broaden electoral support. This study is designed to make modest progress toward clarifying the connections that link democracy to policies that benefit wide segments of the population using data on the distribution of electricity consumption across groups representing distinct electoral interests. The underlying theoretical motivation of this article concerns the relationship between democracy and the distribution of public benefits. Do politicians operating under electoral constraints adopt policies that benefit large segments of the population relative to their authoritarian counterparts?
Using a grouped data multinomial logit model on an unbalanced panel of 57 countries covering the period from 1973 to 1997, we examine democracy's impact on the share of electricity consumed by three sectors that represent distinct political interests: industry, agriculture, and residences.Footnote 1 Our main finding is that in poor countries movements toward democracy are associated with an increase in the residential sector's share of electricity consumption and a decrease in industry's. We use yearly data with country fixed effects so that much of the empirical inference is based on intertemporal movements in countries' democracy scores and associated changes in the sectoral composition of electricity consumption within countries.
Although political economy theories of public good provision often model the distributive consequences of politics (Alesina and Rodrik Reference Alesina and Rodrik1994; Becker Reference Becker1983), empirical papers on regime type and public goods typically examine the impact of democracy on only the quantities or types of public goods provided. By directly modeling the sectoral consumption of electricity—a publicly provided good that can affect health, education, and economic growth simultaneously—we establish one channel that connects democracy to a number of different “quantity” outcomes that other researchers have studied in reduced form.
We posit that once factors associated with demand are controlled for (size of each sector as a share of gross domestic product [GDP], GDP per capita), residual differences in electricity consumption patterns across groups are largely the result of politics. The provision of electricity is inherently political and is typically dominated by the state. Even in more privatized sectors, complex regulatory structures and differential pricing prevail. Politicians ultimately determine patterns of electricity consumption through state ownership, differential pricing, regulation, or the decision not to regulate. Subsidizing one sector at the expense of another (cross-subsidization) is common. Special provisions in recent Russian law that govern the electricity sector, for example, favor households in the countryside with a widening gap between industrial and residential prices (Lindseth Reference Lindseth2002). Electricity price data for a broad panel of countries from the International Energy Agency and Organisation for Economic Development and Co-operation (OECD) (Table 7) confirm that residential and industrial prices in the same country can be very different from each other. We interpret this as stemming from distributive preferences because pricing and other investment decisions by the state ultimately determine consumption in each sector. The positive correlation we find between democratization and the residential share of electricity consumption can be explained by a number of different underlying mechanisms: cross-subsidization could lead to an absolute decrease in the price of electricity charged to households; governments, through state-owned utilities, could decrease the absolute levels of electricity consumed by the industrial sector; and governments could also alter the sectoral composition of consumption through changes in regulatory legislation. Although we remain agnostic about the specific mechanism at play, we conduct supporting regression analysis on price data to show that the unit price of electricity charged to residences relative to industry is lower in democracies, which is consistent with the logic underlying our main results.
Interest group theories of regulation (Becker Reference Becker1983; Peltzman Reference Peltzman1976; Stigler Reference Stigler1971) and theories of decision making under electoral constraints (Bueno de Mesquita et al. Reference Bueno de Mesquita and Morrow2001, Reference Bueno de Mesquita and Morrow2002, Reference Bueno de Mesquita and Smith2003; Foster and Rosenzweig Reference Foster and Rosenzweig2001, Grossman and Helpman Reference Grossman and Helpman2001, Lake and Baum Reference Lake and Baum2001; McGillivray Reference McGillivray2004) generally predict that more democratic decision making would favor residential consumers—a group with less financial clout but a stronger voice in elections—over industry groups when allocating resources. Furthermore, we expect this effect to be stronger in areas where existing rates of residential electrification are lower. We find evidence consistent with these predictions. In the poorest countries, movements toward democracy are associated with an increase in the proportion of electricity consumed by ordinary citizens (residential consumers) and a decrease in the share consumed by industry.
There is excess demand for electricity in most of the developing world (as anyone who has experienced “load shedding” in Tehran, Dhaka, or Nairobi would attest to), making the consumption of electricity across sectors a significant policy decision with important welfare consequences. Electricity affects a multitude of political, economic, and social outcomes. Access to cheap and reliable energy can directly affect economic growth by spurring industrial activity. Access to electricity can help education by lighting a school room or by allowing a child to read after dark, it can help health care provision by allowing the storage of perishable vaccines in health clinics, and it can increase productivity and save natural resources because less time is spent gathering cruder forms of fuel such as biomass (Price Reference Price2000). Although more than 1 billion people in the developing world have gained access to electricity in the past 25 years, about 2 billion remain without access (Barnes and Halpern Reference Barnes and Halpern2000).
Previous research that links democracy to economic growth, health, or education services is typically susceptible to endogeneity problems because income growth engenders a demand for democracy. In our work, the endogeneity of democracy with respect to the pattern of electricity consumption across different groups is less of a concern.Footnote 2 We do, however, put our main results linking democracy to the sectoral composition of electricity consumption through a variety of specification and sensitivity checks to bolster confidence that this is not a spurious link.Footnote 3
The article is organized as follows. The next section discusses recent theories of democracy and its relationship to public service allocation. It also provides some background on the politics of electricity. The subsequent section describes the data and estimation procedure, and discusses the results. The last section concludes the article.
CONCEPTUAL BACKGROUND: THE POLITICS OF ELECTRICITY
To motivate the empirical analysis, we review the existing literature on democracy and its distributional consequences. We then discuss the politics of electricity to draw connections between democracy and the consumption of electricity by three politically distinct groups: industry, agriculture, and residential consumers. To conclude the section, we generate two hypotheses designed to clarify the relationship between the constraints politicians face in democratic regimes and their distributional consequences.
An extensive literature examines how regime type influences the strategies politicians pursue in their search for political support (Ames Reference Ames1987; Brown Reference Brown1999; Brown and Hunter Reference Brown and Hunter1999; Bueno de Mesquita et al. Reference Bueno de Mesquita and Smith2003; de Schweinitz Reference de Schweinitz1964; Dornbusch and Edwards Reference Dornbusch and Edwards1991; Galenson Reference Galenson1959; Haggard Reference Haggard1990; Olson Reference Olson1993; Przeworski et al. Reference Przeworski and Alvarez2000; Lake and Baum Reference Lake and Baum2001; Remmer Reference Remmer1990; Wintrobe Reference Wintrobe1998). To a large extent, the underlying logic is based on whether democratic institutions compel politicians to distribute public goods to a wide segment of the population in order to remain in office. Whether couched in terms of larger minimal winning coalitions (Bueno de Mesquita et al. Reference Bueno de Mesquita and Morrow2001, Reference Bueno de Mesquita and Smith2003) or lower costs of participation for citizens (Baum and Lake Reference Baum and Lake2003; Lake and Baum Reference Lake and Baum2001), democratic political institutions force politicians to expend greater effort towards the provision of public goods. Contributions to this literature often make the implicit assumption that when dividing the pie, politicians operating under democratic institutions allocate resources away from narrow interests toward larger segments of the population. Our study is designed to directly test whether there is a trade-off in appealing to wide segments of the population versus more narrowly construed interests: do democratic institutions change the sectoral composition of electricity consumption away from industry and toward residential consumers?
The Politics of Electricity
The production of electricity involves substantial government involvement for three reasons: the generation, transmission, and distribution of electricity requires large, specific sunk costs; economies of scale are significant; and output is consumed widely (Bergara et al. Reference Bergara and Henisz1997). Consequently, many governments initially structured their electricity industries as vertically integrated state-run monopolies. Largely as a result of budgetary exigencies during the debt crisis of the 1980s, politicians in the developing world turned to market-based reforms (Williams and Ghanadan Reference Williams and Ghanadan2006). In a recent survey of 115 countries, 57% had undertaken one of several market-based reforms (World Bank 2004). Substantial regional variation exists: Latin America leads in the reform effort with Eastern Europe and Asia not far behind (Williams and Ghanadan Reference Williams and Ghanadan2006). In sub-Saharan Africa, publicly owned electricity companies still predominate, with the state controlling tariff setting, investment decisions, and the appointment of top managerial staff (Turkson and Wohlgemuth Reference Turkson and Wohlgemuth2000). Despite the reform trend, governments maintain a significant role by varying regulatory schemes, prices, and informal methods of control. Even in the most liberalized and privatized electricity markets, governments still can manipulate unit prices.
Regulatory frameworks and interests vary widely in the electricity sector and are extremely political. Regulation that increases barriers to entry, places constraints on market mechanisms, and establishes politically appointed regulatory bodies can provide significant benefits to existing domestic players in the industry. Regulatory frameworks that decrease barriers to entry, allow the market to operate freely, and eschew regulatory bodies friendly to industry might favor middle-class consumers (Murillo Reference Murillo2001). A review of Latin American evidence suggests that executive capacity, ideological polarization, and degree of political competition influences when and how privatization and the subsequent regulatory framework is implemented (Murillo and Martínez-Gallardo Reference Murillo and Martínez-Gallardo2007). The universe of actors and their interests in electricity are both varied and politically significant. J. Robert Branston et al. (Reference Branston and Sugden2006) identify, for example, the range of actors and their contrasting interests in Mexican reform efforts. Industrial consumers favor low tariffs for large-volume users. Owners of a privatized electricity company will, however, want to charge prices that maximize profits, regardless of the relative prices incurred by industry, agriculture, or residential consumers. Prices that maximize profits—usually charging residential consumers relatively more than large-volume users—might sabotage the interests of a Mexican government interested in providing service to the poor. In addition, Mexican unions want to protect the number of workers employed. Finally, residential consumers are keenly aware of their monthly utility bills and generally suspect that market reforms will lead to higher prices (Nellis Reference Nellis2003). Consequently, politicians proposing market reform in electricity production face the possibility that residential consumers will take to the streets. Given these conflicting interests, how the industry is regulated and by whom can have an extremely important impact on the welfare of distinct groups.
Price manipulation is common through what is known as cross-subsidization. Cross-subsidization involves charging relatively higher prices in one sector (usually industry) to help subsidize prices in another (usually agriculture and residential consumption). The electricity industry in India provides a prime example. In India, the rate of subsidy expressed as a proportion of the full cost-of-supply reference price amounted to 93% for agriculture and 58% for households in 2000 (Audinet and Verneyre Reference Audinet and Verneyre2002, 64). Politics is a recognized impediment to electricity reform in India. According to Navroz K. Dubash and Sudhir C. Rajan (Reference Dubash and Rajan2002), “from 1977 onward, electricity increasingly became an instrument of populist politics. By offering electricity at flat rates—based on pump capacity rather than metered consumption—or even completely free, several state governments cultivated farmers as a vote bloc” (53). Cited in their study, a World Bank report estimates that during the mid-1990s roughly 1.5% of India's GDP (about $4.6 billion) was paid out as an annual subsidy to agricultural and residential users (Dubash and Rajan Reference Dubash and Rajan2002; World Bank 1999).
As the Indian example illustrates, governments use the price mechanism to regulate the consumption of electricity. Electricity price data reported by the International Energy Agency for 55 countries show significant variation across sectors. Residential consumers are charged over twice as much per unit of electricity compared to industry in Brazil, Uruguay, Paraguay, and much of Western Europe, whereas in India they are charged roughly half.
In addition to varying regulatory frameworks and price schedules, governments can influence the consumption of electricity through informal means. Some examples come from Nigeria, a country that when not governed by populist strongmen, has been governed by the military. The Nigerian electricity sector is characterized by extremely poor performance: unreliable service, rolling blackouts, and illegal connections to transmission lines are the norm. Locals claim that the acronym NEPA (National Electric Power Authority) really stands for “Never Expect Power Always” (Olukoju Reference Olukoju2004). The state electric power authority is considered by some a substantial conduit of massive corruption. Both serving and former staff have been caught stealing cables, transformers, and other equipment for private gain. Other forms of state action effectively raise the price of electricity for residential consumers. NEPA officials are slow to respond to maintenance problems. In cases where there is a response, a gratuity or bribe is often demanded by company officials. Officials have also been accused of shutting down the power supply in order to blackmail targeted neighborhoods. NEPA officials “routinely” disconnect entire blocks when individual inhabitants fail to pay their bills (Olukoju Reference Olukoju2004). These actions affect the true cost of electricity for large segments of the population.
It is difficult to overstate the role of politics in the supply of electricity. Some previous work attempts to demonstrate how political institutions characterized by a relatively large number of veto players (read democracies) make it difficult for the dominant interest in an economy to dictate policy. Henisz and Zelner (Reference Henisz and Zelner2006) posit that in countries with a relatively large industrial base, the growth in electricity generation will be relatively small because industrial interests are likely to support a more efficient use of electricity rather than subsidizing an increased rate of production. Where industry is sufficiently strong, it will lobby government to resist building white elephants (large state-owned generating plants that serve more of a political purpose than an economic one). Industry's ability to limit growth in the electricity sector is dependent, however, on the number of veto players active in any given political system. Note that Henisz and Zelner's results imply democracy—an institution with more veto players relative to authoritarian regimes—does not favor one group over another, it simply serves as a check or constraint on each group's aspirations. There is preliminary empirical evidence, therefore, to suggest that there is no simple correlation between regime type and who gets what. Our goal is to directly examine the distributional issues that remain unresolved in the theoretical literature.
We conceive the problem as being one of distribution: politicians (regulators) make decisions—through pricing, regulation, or more informal means—about which sectors to favor in the provision of electricity. We use as our point of departure the theoretical and empirical work by Lake and Baum (Reference Lake and Baum2001), along with Bueno de Mesquita et al. (Reference Bueno de Mesquita and Morrow2001, Reference Bueno de Mesquita and Morrow2002, Reference Bueno de Mesquita and Smith2003), who argue that politicians acting under electoral constraints maximize their utility by producing legislation benefiting relatively large segments of the population. In the context of electricity consumption, legislation takes the form of subsidies and regulatory structures that either raise or lower the cost of electricity for different groups. The three groups we consider—industry, agriculture, residential—provide a clear distinction between encompassing groups and more narrowly construed interests. Industrial consumers of electricity have high per capita stakes in the price they pay for electricity and are relatively small in number. Agricultural interests also have a high per capita stake, but are usually larger in number. Although smaller in number than residential consumers because of the geographic logic under which the legislative branch is based, agriculturalists are usually overrepresented in the legislative arena. Finally, residential consumers have low per capita stakes and are large in number.
Given the nature of the electricity sector and the theory on regime type already discussed, we derive two testable hypotheses. As political competition increases, politicians favor groups with less financial clout but a stronger voice in elections: consumers and agricultural interests. The first hypothesis can be stated as follows:
Hypothesis 1. Democracies provide subsidies and regulatory structures that favor residential and agriculture consumers of electricity relative to industrial consumers.
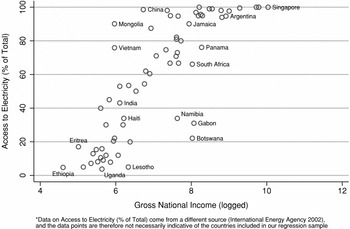
We expect democracy's impact on the distribution of electricity as hypothesized previously to be more pronounced in the world's poorest countries. Regulatory reform in industrialized countries focuses on providing a more efficient, cleaner, and cheaper source of electricity to customers, whereas in the developing world providing basic access to those without any electricity is the primary concern (Jamasb Reference Jamasb2002). In OECD countries, more than 99% of the population has access to electricity. Electrification rates in the Middle East, North Africa, East Asia/China, and Latin America are all above 85%, whereas in the rest of the developing world, the figure is 64% (International Energy Agency 2002). In South Asia and sub-Saharan Africa, the rates of access to electricity average 30%, and vary from 4.7% (Ethiopia) to 52.9% (Pakistan).
The relationship between income levels and access to electricity (Figure 1) suggests that governments can make the largest gains in electrification in the poorest countries where there is currently the least supply. Four out of five people without access are residents of rural areas in low-income countries. Because the electricity needs of the majority of residential consumers in middle- and high-income countries have already been met, a movement toward democracy in these countries would not necessarily lead to increases in the residential share of electricity consumption. We therefore expect democracy's impact on residential consumption to be most evident among the poorest countries in our sample. Consequently, we treat the interaction of income per capita and democracy as a potential determinant of sectoral electricity consumption patterns.
Plot of “% of Population with Access to Electricity” against Log of Gross National Income*

Hypothesis 2. Democracy's impact on the share of electricity consumed by the residential sector is greater in poorer countries.
ESTIMATION
The Empirical Model
In this section, we present our empirical model, both specifying our underlying theory and justifying the use of our estimator. The underlying model of democracy, politicians, and electricity consumption by each sector has several components that we hypothesize behave in the following way. Politicians have some estimates of demand for electricity by each group conditional on a set of prices and regulatory choices. They also have some sense of the importance of each group's preferences in their political calculus, which we hypothesize is conditional on regime type. Politicians then choose prices and regulatory conditions to affect electricity consumption patterns in such a way so as to maximize their own utility.
We do not have data on regulatory choices and all relevant prices for our panel of country-years. Consequently, we can only run regressions that relate regime type (which affects politicians preferences) to a market outcome (the composition of consumption) that is determined by the interplay of supply (regulation, prices) and demand (industrialization, level of development, urbanization, etc.). Not having a direct measure of regulatory choices and all relevant prices requires us to make additional assumptions about the role of the demand side in determining the market outcome. The formal framework we use forces us to be explicit about these assumptions that lead to our choice of the multinomial logit model (Achen Reference Achen2002).Footnote 4 We derive the multinomial logit-based empirical specifications used in this article from a random utility model of government preferences over electricity allocation (Maddala Reference Maddala1983).
We assume that through regulatory policies, cross-subsidization, or more informal means, a government may choose to promote the consumption of electricity in one of four different consumer groups: agriculture (A), industry (I), residential consumers (R), and others (O). The utility the government in country i at time t (UGit) derives from consumption by group G (G = A, I, R, or O) is assumed to depend linearly on regime type, proxied by a Democracy indicator (D it):

Theories outlined in the previous section suggest that democracies favor residences relative to industry (δR > δ I): that is, that we are more likely to observe URit > UIit for Dit = 1 rather than Dit = 0 because government utility would be more sensitive to residential consumers' voting behavior in a democratic regime. Based on its preference for one group over another (comparisons of UR, UI, UA, UO conditional on regime type), the government could choose a regulatory instrument such as discriminatory pricing to promote electricity consumption by its preferred group(s). The price charged to group G is denoted PGit, which depends on government utility and therefore on regime type:

In other words, the price charged to a particular sector depends on how much politicians value a particular sector's support, which we hypothesize will depend on regime type.
The consumption outcome in the market, CGit (i.e., the likelihood that group G actually consumes an additional unit of electricity) is not just a function of the government's regulatory instrument (i.e., the relative prices charged), but it also depends on demand conditions such as the size of each group or the extent of urbanization, and characteristics of the economy such as average incomes:

CGit can be interpreted as the unobserved latent demand of group G for electricity. Yit is a vector of variables that determine demand for each country in each time period, and it may include country-specific unobserved factors (i.e., a set of country fixed effects) as well as a time-specific effect. The random variable ɛGit is an unobserved demand parameter for each consumer group, and it may contain a country-specific fixed component (i.e., errors clustered by country). The coefficients γ and β vary by consumer groups (G), but not by country (i) or year (t). The primary coefficient of interest in this article, β, captures the effect of regulatory preferences (based on regime type) on electricity consumption outcomes observed in the market, after demand conditions that affect consumption patterns are controlled for.
In this random utility model, the micro foundation for each sector's share of electricity consumption is the probability that a particular unit of electricity is consumed by any one group. For example, we can use Equation (1) to solve for this probability for residential consumers (defined by Pr(CRit > CGit) for all G ≠ R):

In this case, the unit of electricity is more likely to be consumed by residences if the government is democratic (through the government utility and regulatory instrument effect), and if demand conditions favor the residential group over other consumer groups (e.g., the size of the residential group is large relative to industry or agriculture). This unit-by-unit electricity consumption decision, although not actually observed, determines the proportion of electricity consumed by each of the four groups: EGit, which is what we have data on for each country in each year. If ɛGit is assumed to be independently and identically distributed across countries with a Weibull distribution,Footnote 5 then the proportion EGit can be expressed as
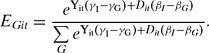
Equation (2) defines multiple share equations (one for each consumer group) in a grouped-data multinomial logit model, which yield three sets of coefficients for each conditioning variable: the effect of democracy on (a) group A's (i.e., agriculture) share of electricity consumption relative to group I (industry), (b) group R's (residences) share of electricity consumption relative to group I, and (c) group O's share of electricity consumption relative to group I.
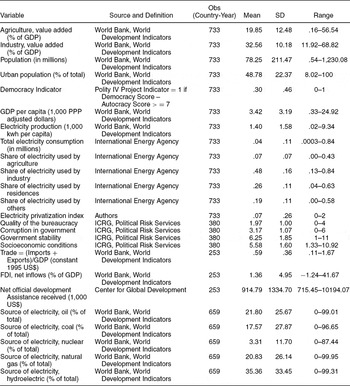
We implement this model using data from the International Energy Agency on the percentage shares of electricity consumed by agriculture, industry, residential consumers, and others for 733 country-year observations (Table 1a). These shares define our dependent variable in a grouped data multinomial logit model. For the conditioning variables in Y, we collect data from the World Bank on the size of each consumer group in the economy (industrial share of GDP, agricultural share of GDP, total population), extent of urbanization (which may increase residential electricity demand), nonlinear terms of average income (GDP per capita and its GDPpc squared), and total electricity production and consumption. We also create and control for a two-point index of electricity sector privatization in each country-year. The Appendix provides details on the construction of this index. The democracy indicator (Dit) is constructed by subtracting “Autocracy” from “Democracy” scores in the Polity data set, producing a 21-point ordinal scale for each country-year, ranging from −10 to +10 (Marshall Reference Marshall2003). Because a vast majority of authoritarian cases cluster around −10 and democracies cluster around +10, to simplify the analysis and our interpretation of the coefficients we dichotomized the scale: cases that score above a combined (Democracy − Autocracy) score of 6 were coded as democratic.Footnote 6 We add country dummies to account for permanent unobserved differences in climate or the quality of institutions across countries that may affect the electricity share of each group. We also add year dummies to capture the impact of global energy shocks (e.g., the oil price shocks) that affected all countries in particular years. The year effects will also capture long-term global trends in democratization and residential electrification. We allow a heteroskedasticity-corrected error term to be correlated across yearly observations for each country, in case there are unobserved factors that vary in a nonconstant way over time within countries that are not picked up by the country dummies. Specifically, we cluster standard errors at the country level, which allows for arbitrary correlation for observations for the same country. As a check, in one specification we explicitly assume serial correlation with AR(1) disturbances. Finally, we allow the impact of democracy to vary across income levels by including interaction terms between GDP per capita and the democracy indicator. This reflects the proposition that in richer countries where electrification is nearly universal, movements in democracy are less likely to be reflected in increased electricity allocation to residential consumers. To conduct various specification and sensitivity checks, some of our regressions include controls for institutional quality measures from the International Country Risk Guide (ICRG), measures of trade openness, net inflows of FDI and sources of electricity (coal, nuclear, gas, hydro) from the World Bank, and net official development assistance received from the Center for Global Development (CGD) (see Table 1a for variable descriptions).
Variable Sources and Summary Statistics

To stay true to theoretical formulations of democracy's influence on the share of consumption by each sector, our choice of dependent variable and empirical model conceives of electricity as a pie of fixed size, allowing country characteristics to alter the relative shares consumed by agriculture, industry, and residences. Consequently, the empirical results should be interpreted in relative terms (e.g., the effect of democratization on the residential sector's share of electricity consumption relative to industry). Under this framework, it is important to note that the change in shares of consumption can come in a number of different ways. For example, a decrease in absolute consumption in one sector accompanied by an absolute increase in another can result in the same estimates as increasing absolute consumption in both sectors at different rates. The estimates do not identify the nature of absolute change nor do they identify the specific causal mechanisms responsible. We do, however, provide some preliminary evidence on democracy and relative sector prices, allowing us to identify one potential underlying causal mechanism.
Results
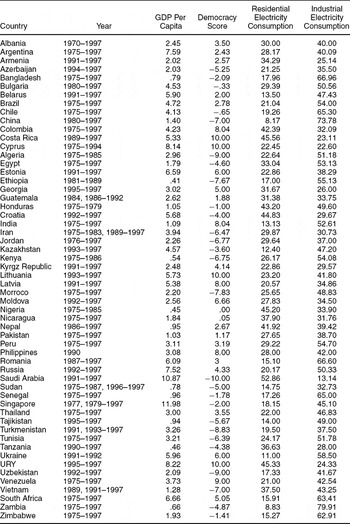
Table 1a reports sample characteristics. The 733 country-year observations in our sample represent 58 countries and span from 1975 to 1997. The average GDP per capita is $3,420 purchasing power parity (PPP) adjusted dollars, which indicates that low- and middle-income countries are overrepresented in this sample relative to the rest of the world. Although 30% of observations in our sample are coded as “Democracy,” 37% of all observations in the world are “democracies” during the sample period, which again suggests that our sample overrepresents developing countries. The countries and years included in the regressions, as well as mean values for the variables of interest by country, are detailed in Table 1b.
Country Sample Description

*Table values based solely on designated years.
Sectoral electricity consumption expressed as average yearly percentage of total use.
Average annual democracy score (ranges from −10 to +10) calculated by subtracting “democracy” score from “autocracy” score, based on 21-point ordinal scale (Marshall Reference Marshall2003).
Average annual GDP expressed in terms of 1,000 PPP adjusted dollars.
On average across the sample, 48% of electricity is consumed by industrial consumers. The second largest consumer group is “residences” with 26%. Agricultural consumers receive 7%, whereas all others (transport, public sectors, etc.) account for the remaining 19%. There is reasonable variation in the group-specific electricity consumption share figures across the sample. At the extremes, only 13% of electricity is consumed by industry in Saudi Arabia in 1995,Footnote 7 whereas industry consumes 84% of electricity in Zambia in 1987. Variation across countries accounts for about 71% of the total variability in the relative residential to industrial electricity shares, whereas the remaining 29% is due to intertemporal variation within countries. This, coupled with the fact that the democracy indicator exhibits greater variation across countries than over time, suggests country fixed effects estimation will be a more stringent test of democracy's effect on electricity distribution compared to cross-sectional estimates or pooled estimators on the panel data.
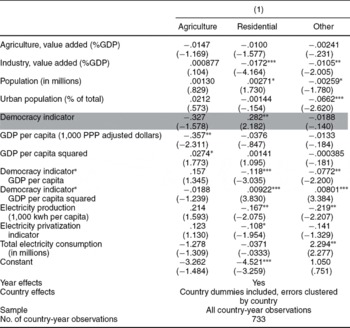
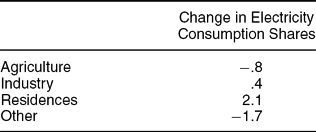
Table 2a reports the coefficient estimates for the grouped data multinomial logit model (as defined by Equation (2)) of electricity allocation across the four groups. The share consumed by industry is treated as the omitted category, so the three columns in specification 1 report, respectively, the effect of each independent variable on (1) the agricultural sector's share of consumption relative to industry, (2) the residential sector's share of consumption relative to industry, and (3) the sectoral share labeled “others” relative to industry. The regression in Table 2a contains a full set of country dummies (whose coefficients are not reported), and standard errors that are clustered by country. The signs on the coefficients indicate that democratization increases the residential sector's share of consumption relative to industry and that the size of the effect varies across countries at different income levels. We need, however, to construct marginal effects based on the three coefficients on democracy and its interactions in order to interpret the substantive size of democracy's influence. Table 2b reports the average marginal effect of the democracy indicator on each sector's share of consumption for the entire sample. A movement toward democracy increases the residential sector's share by 2.1 percentage points. From a baseline share of 28% in the average country, this is a substantial change in the composition of consumption across sectors.
Multinomial Logit Models of Electricity Allocation across Four Groups

Heteroskedasticity-corrected z statistics in parentheses.
*Significant at 10%; **significant at 5%; *** significant at 1%.
Allocation to “industry” is the omitted category.
Average Marginal Effect of the Democracy Indicator in the Multinomial Logit Model (Based on Table 2a)
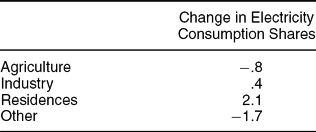
Note: The value in each cell is the percentage point change in the electricity consumption share of that group in response to a unit change in the democracy indicator. See Figure 2, which calculates the marginal effect for every decile of GDP per capita.
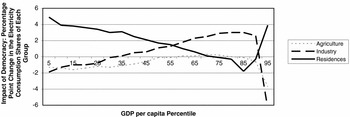
Because of the model's nonlinear specification and use of interactions, the average marginal effect calculated for the entire sample gives a incomplete picture of democracy's influence on the consumption of electricity by each sector. To clarify what our estimates imply, we calculated the average marginal effect for each decile along the distribution for GDP per capita (Figure 2). As expected, the positive effect of democracy on the residential sector's share is largest among the poorest countries in the sample. In the poorest 25% of our sample (countries with GDP per capita less than $1,200, PPP adjusted), the residential share of electricity is about 4 percentage points larger in democracies than in nondemocratic countries. We should note that the average marginal effect is much larger (it roughly doubles) when excluding the country dummies. Also note that at the 30th percentile, the average marginal effect of democracy on industry's share becomes positive: with a change to democracy, industry's share increases. Even though the average marginal effect of democracy on industry's share is positive, democracy's impact on the residential sector is even greater (up until the 60th percentile where the two lines intersect).
Marginal Effect of Democracy as GDP Per Capita Varies (Based on Table 2a)

The impact of democracy on residential electricity consumption remains positive for the poorest 75% of the sample (countries with GDP per capita less than $5,000, PPP adjusted), but actually reverses for the richest quarter, where industry gains a greater share with democratization. However, when we use the delta method to compute the 95% confidence interval around the marginal effect estimate, we find that the standard errors are largest in the richest segment of the sample. The effect of democracy on the residential share of consumption is not statistically distinguishable from zero in the richest quarter of the sample. Also, in additional regressions reported later in the article, democracy's influence on industry's predicted share was unstable in the richest 25% of the sample. Consequently, we focus our attention on the poorest half of the sample where the predicted differences survive a battery of stability tests and are substantively and statistically significant, and we should be careful to always note that conclusions drawn from these stable and robust results only apply to the poorer half of the sample.
In regressions based on shares of consumption, gains observed in one sector have to be accompanied by losses in another. We find the sectoral composition of consumption shifts in favor of residences at the expense of all other sectors in the poorest countries. The average effect of regime type on industry across the entire sample is close to zero, but as Figure 2 shows, this masks a negative impact democracy has on industry's share in the poorest quarter of the sample. When we run this same regression breaking up the sample into two groups of “rich” and “poor” countries (using GDP per capita cutoff of $3,000), we find that democracy increases the residential sector's share of consumption and decreases the relative share for industry only in the sample of poor countries. This effect is not evident in the rich country sample. We also divided the sample by time period (before and after 1982 to coincide with the debt crisis), finding democracy has comparable positive effects on residential electricity consumption across both periods.Footnote 8
The other control variables in Table 2a do not have strong effects on electricity consumption patterns across the four groups. As expected, the industrial share of electricity tends to be larger in countries where the industrial sector contributes a larger share of GDP. Countries that produce a larger amount of electricity seem to observe a larger share consumed by the agricultural and industrial sectors over residential consumers. There is no robust impact of average income levels per se, except through its interaction effect with democracy.
Sensitivity Analysis of Multinomial Logit Models
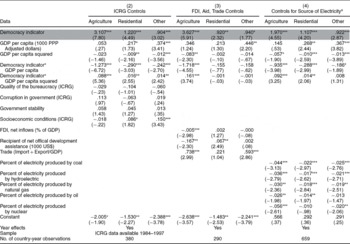
Table 3 conducts a number of specification tests to examine whether the link between democracy and sectoral electricity consumption patterns can be explained by other country-specific institutional, economic, or technological changes that occurred during the sample period. Specification 2 adds a set of institutional indicators available from the ICRG to examine whether the democracy indicator merely picks up the effect of broader institutional quality measures, because democracies are more likely to be advanced countries with better institutions. The democracy indicator and its interaction term with GDP per capita remain statistically significant, and the marginal effects of democracy stay comparable to that computed from specification 1. It is therefore unlikely that the impact of democracy on electricity consumption patterns that we observe are merely the result of greater residential consumption in more advanced economies with better institutions. None of the other ICRG indicators included in the model are statistically significant.
Multinomial Logit Models of Electricity Allocation: Robustness Tests

Heteroskedasticity-corrected z statistics in parentheses. Standard errors clustered by country.
*Significant at 10%; **significant at 5%; ***significant at 1%.
Allocation to “industry” is the omitted category for the multinomial logit.
aExcluded group is “other” sources.
These specifications include all other control variables from Table 2a (urbanization, population, electricity consumption, privatization, size of agricultural and industrial sectors), but some coefficients are not shown to preserve space.
In specification 3, we explore the possibility that exposure to multilateral lender, aid, trade, and FDI occur contemporaneously with democratization and electricity sector reform, reducing the relative power of domestic industry. Regimes that receive more foreign aid also have a larger residential share of consumption, and greater trade openness reduces industry's share. The aid, trade, and FDI variables jointly reduce the size of the democracy coefficient from 1.22 to .92 in the residential consumption equation, but this slightly smaller effect remains strongly significant both substantively and statistically. In specification 4, we control for the share of domestic electricity production from each major source (coal, hydro, gas, oil, nuclear) to explore the role of production technology differences, but these controls leave our democracy coefficient virtually unchanged.
Sensitivity Analysis Using Panel Regressions
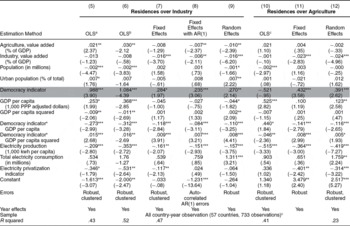
To further check the stability of our results with respect to model specification and to test a substantive implication of the multinomial estimates, we estimate several additional models (Table 4a). First, we simplify our data to examine democracy's effect on the residential sector's share of consumption relative to both industry and agriculture separately: we define residential electricity consumption as a fraction of residential plus industrial consumption or as a fraction of residential plus agricultural consumption. An important advantage of these models is that the specifications are linear (whereas the multinomial logit is not), which implies that fixed effects estimates in this setting are truly “within panel estimates” where intertemporal variation within countries completely determines the coefficients, and between-country variation in the data is ignored.
Panel Data Models of Residential Electricity Consumption as a Fraction of (Residential + Industrial) or (Residential + Agricultural) Consumption

Robust (heteroskedasticity-corrected) t statistic in parentheses. Errors clustered by country.
*Significant at 10%; **significant at 5%; ***significant at 1%.
aLogistic transformation of the dependent variable (depvar = ln[y/(1 – y)]) so predictions are not outside the natural bounds of 0,1.
bSame as OLS regression (5) without the fomer communist countries.
cIn regression (6), there are 610 observations once the former-communist countries have been removed.
These models also hold other advantages. First, they can provide some preliminary answers to an important question: does the residential sector's share of consumption come at the cost of industry's share, at least for the poorest cases in our sample? In other words, do the positive changes in the residential sector's share of consumption come at the expense of industry, or is it an artifact of democracy's impact on the two other sectors (a possibility under the multinomial logit estimation)? Second, we fully recognize that most data do not call for one and only one estimator (Achen Reference Achen2002). Consequently, we estimate fixed effects, random effects, and a model accounting for autoregressive errors to illustrate that our results do not depend on important underlying assumptions associated with each model.Footnote 9 Finally, we also test whether our results are stable relative to the inclusion or exclusion of an important subset of the cases (former communist countries).Footnote 10
In the first four columns of Table 4a, we use ordinary least squares (OLS), fixed and random effects models to explore the determinants of electricity consumption by the residential sector relative to the industrial sector (ignoring movements in consumption by agriculture and others). Because it ranges between 0 and 1, we undertake a logistic transformation of the dependent variable.Footnote 11 The last four columns show the results of three analogous models for residential consumption as a fraction of agricultural consumption. Specification 5 reports the OLS results with errors clustered by country, 6 excludes the former communist countries, 7 adds country fixed effects, 8 presumes an AR(1) autocorrelation process to the errors in addition to the country fixed effects, and 9 replaces the fixed effects with random effects by country.
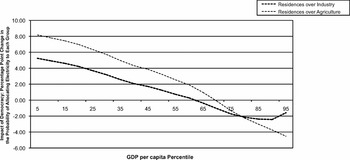
Consistent with the multinomial logit results, the effect of democracy is to increase the residential share of consumption at the cost of industry's share. The magnitude of this impact reduces considerably with fixed or random effects. This change in magnitude also varies with changes in GDP per capita. Table 4b reports the average marginal effect for the entire sample. The share of electricity received by residences relative to industry increases by more than 7 percentage points on average with democracy according to the OLS model. For the average country in our sample, this takes electricity consumption from a 65‒35 split in favor of industry to a 58‒42 split. The effect reduces to 1.2 percentage points in the fixed effects model.Footnote 12 As with our multinomial estimates, the average marginal effect for the entire sample masks important differences between the rich and poor nations. To make transparent exactly what the substantive effects are, we calculate the marginal effects across GDP percentiles (Figure 3). Figure 3 shows that democracy's beneficial effect on residential consumers only exists for the poorest 65% of the sample. At the 65th percentile the residential/industry line crosses the X axis; at this point, democracy does not change the residential sector's share relative to industry's. This corresponds closely to Figure 2, where the residential line and the industry line intersect somewhere between the 55th and 60th percentile.Footnote 13 In the poorest quarter of the sample, democracy increases the residential sector's share of consumption by 4 to 6 percentage points in the fixed effects model. Consistent with Figure 2, it appears that in the richest quarter of the sample, democracy's impact is to reduce this share by about 2 to 3 percentage points. Again, computing confidence intervals for the predicted values indicated that any predicted differences above the 75th percentile could not be distinguished from zero. The magnitude of these effects in the fixed versus random effects models are comparable. Specification 8 presumes an AR(1) autocorrelation process for the errors under the fixed effects model. Both democracy scores and sectoral electricity shares are correlated over time for any given country, and the AR(1) assumption reduces the democracy coefficient, but it remains statistically significant. In terms of the other control variables, we find that for each percentage point increase in the industrial share of GDP, the relative electricity consumption of residences over industry decreases by 1.6% in the OLS specification. We again find that industrial consumption is greater in countries that produce more electricity.
Marginal Effect of Democracy in Linear Models

Note: The value in each cell is the increase in the share of electricity allocated to residences (in percentage terms) in response to a unit increase in the democracy indicator.
Marginal Effect of Democracy in Fixed Effects Models (Models 7 and 11)

Specifications 10 to 12 show that democracy's impact on the share of electricity consumed by the residential sector relative to the agricultural sector follows similar patterns. In the fixed effects model, when a country democratizes, it increases the relative allocation to residences by 2.6 percentage points on average. Figure 3 shows that this effect is only positive for the poorest 70% of the sample, and it reverses for the richest 30%.
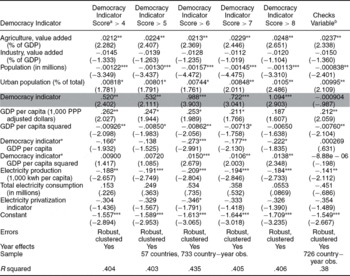
In Table 5, we examine the sensitivity of our results to changes in the definition of democracy. We have defined democracy as cases where a country's “democracy” score in polity exceeds its “autocracy” score by 6. The different columns in Table 5 shift this difference criterion between 4 and 8. Our main result (that democratization is associated with greater electricity allocation to residences as opposed to industry) continues to hold under these alternative criterions.
Logistic Model of Residential Electricity Consumption (as a Fraction of Residential + Industrial Consumption) – Varying Democracy Indicator Criterion

Robust (heteroskedasticity-corrected) t statistics in parentheses. Errors clustered by country.
*Significant at 10%; **significant at 5%; ***significant at 1%.
aDIS calculated as combined (Democracy - Autocracy) score (Marshall Reference Marshall2003). Democracies defined as countries having democracy indicator score > stated criterion.
bChecks variable is a measure of democracy (by extent of checks and balances) from the World Bank Database of Political Institutions.
In the last specification of Table 5, we replace our democracy indicator with a “veto players” measure (“extent of checks and balances”) from the World Bank Database of Political Institutions. Our intention here is to check how a variable that is conceptually similar to, but not as good a fit for our theory as the polity indicator, performs in explaining the sectoral distribution of electricity. This “checks and balances” measures captures the credibility of the institutional environment in addition to opportunities for voice. It appears to have little correlation with the relative electricity consumption of the residential and industrial sectors. This suggests that the aspect of democratic institutions that matters for the distribution of electricity is the weight placed on the welfare of competing interest groups, and not institutional credibility.
Democracy and the Price of Electricity
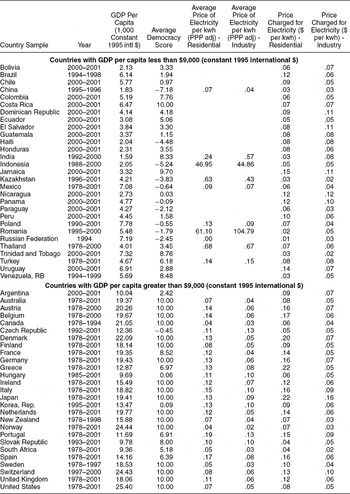
We conduct some ancillary analysis with sector-specific electricity price data to better understand the mechanism underlying the relative consumption results we observe. Governments may affect the sectoral distribution of electricity through a variety of regulatory mechanisms, including differential pricing and price subsidization. The analysis in this section uses data on sector-specific industrial and residential kilowatt-hour prices for electricity for a range of country-years. These data are reported by the OECD, and unfortunately, they overrepresent OECD and other developed economies, which means that this is not a great match for our electricity consumption sample populated mostly by developing countries.
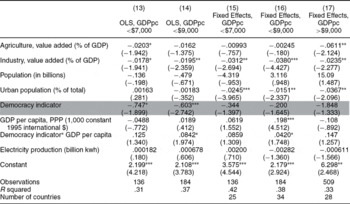
Table 6 specifies the sample of country-years for which we have electricity price data and shows the sectoral average prices for each country. The ratio of the residential unit price of electricity to the industrial price varies between .23 and 3.8, and averages 1.65, which is prima facie evidence that differential pricing is commonly practiced around the world. Within the sample of poor and middle-income countries, residences appear to be subsidized in India, El Salvador, and Romania in recent years, whereas industry appears to be subsidized in much of Latin America. Interestingly, the raw cross-country correlation between the relative price charged to residences and the country's democracy score is positive in this sample, indicating that democracies charge higher relative prices to residences than nondemocracies. Once we focus on within-country movements in prices and democracy and examine this correlation conditional on country fixed effects, we find that the relative price charged to residences decreases after a country democratizes. In Table 7, we run regressions on the relative price of residential versus industrial electricity with additional control variables to examine its relationship to the democracy and income levels more systematically. We find evidence on differential pricing that is consistent with the sectoral consumption patterns, helping explain the effect of regime type on the observed sectoral distribution of electricity. OLS regressions (specifications 13 and 14) show that in the sample of poor and middle-income countries, democracy lowers the relative price of electricity charged to residences. The effect is statistically significant, but these results should be interpreted with caution because the sample is small relative to our sectoral consumption sample, and also different from that sample. The statistical significance of the democracy coefficient disappears once country fixed effects are added, but the direction of the effect remains the same. We do not find a statistically significant relationship between democracy and relative prices in the rich country sample, although the direction of the relationship is the same and the magnitude of the coefficient estimate is large. In summary, we view the price analysis as supporting evidence that governments use this regulatory instrument to direct electricity to preferred sectors. This, however, does not rule out the possibility that other mechanisms—such as directed allotment—might also be at play.
Country Sample Description, Price Data

Panel Data Models of Relative Prices for Electricity in Residential versus Industrial Sectors
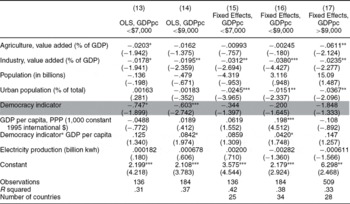
Robust (heteroskedasticity-corrected) t statistics in parenthese. Errors clustered by country.
*Significant at 10%; **significant at 5%; ***significant at 1%.
CONCLUSION
Democratic political institutions hold important consequences for the consumption of electricity by different groups in society. We show evidence of an important substantive and statistically significant relationship between regime type and the sectoral consumption of electricity. We find that democratic governments increase the residential sector's share of electricity consumption relative to industry's share in poor countries. The trade-off between the residential sector and the industrial sector does not exist in rich countries, and given large standard errors in the rich portion of the sample, we cannot even rule out that the trade-off might actually reverse in the richest quarter. In poor countries where electricity access is far from universal, politicians in democracies pursue strategies that favor residences relative to industry.
Although a strong relationship exists between regime type and the consumption of electricity by different sectors in the economy, it is important to recognize an important limitation of our study. Our explanation of the results relies on a number of intermediate steps for which we have limited data. The foundation of our argument rests on politicians and their decisions to favor one sector of the economy over others. We argue that politicians construct a variety of different regulatory instruments that have important effects on the price the various sectors pay for electricity. Although a preliminary examination of price data provided additional evidence, examining additional price data by sector as it becomes available would be the next logical step to uncover the causal mechanisms at play. Although price data with more coverage might help confirm our causal explanation, it may not disconfirm it. In addition to price, governments have a variety of means with which to affect consumption patterns. Governments can manipulate the “real” price (e.g., constant black-outs and general reliability of service may translate into higher real prices) or can even direct allotment of electricity to preferred groups or regions through placement decisions on infrastructure that service particular cities or industrial concerns. Lipscomb, Mobarak, and Barham (Reference Lipscomb, Mobarak and Barham2008) show that the spatial allocation of hydropower plants across Brazil is partly based on exogenous geologic concerns, but also partly driven by demand-side considerations such as concentrations of industrial activity and population.
Another potential limitation of this work is that some unobserved factors possibly correlated with the democracy indicator, such as regulation of the electricity sector, may affect electricity consumption patterns. It is important to note, however, that our results concerning democracy's beneficial impact on electricity consumption by the residential sector includes country fixed effects and survives after controls for income, electricity sector privatization, urbanization, indicators of institutional quality, trade openness, foreign aid and investment, total electricity consumption, and sources of electricity are included in the model. These are admittedly not perfect solutions, but data on all possibly relevant covariates simply do not exist for our panel of 733 country-year observations, and instruments for democratic institutions proposed in the literature (Acemoglu et al. Reference Acemoglu and Robinson2002; Mobarak Reference Mobarak2005) are cross sectional.
Despite the limitations, we have uncovered a strong empirical pattern in poor countries that holds important consequences both for economic development and democracy itself. Noted previously, access to electricity can affect a number of different development outcomes: improved education (reading at night), health (refrigeration), and communication (radio, television, telephony). It is not clear that the reallocation of electricity among sectors necessarily affects economic growth because we do not have estimates of the relative productivity of electricity in each sector. Improving access to electricity may also help in an indirect but no less important way. Access to electricity demands the establishment of legal residences so that that electricity consumption by residences and small businesses can be accurately measured. Supplying electricity therefore provides an incentive for communities to establish a minimal system of property rights. According to Hernando de Soto, establishing property rights is the most important factor in unleashing the economic potential of developing countries (De Soto Reference De Soto2000).
There is also a hidden cost incurred when people lack access to electricity: time spent gathering fuel. In many developing countries, an inordinate amount of time and energy is spent collecting fuel for everyday use. Not only is the fuel inefficient, but it also often poses a number of health risks for those who depend on it. The most often cited example involves the respiratory problems that result from burning wood or charcoal indoors.
In closing, our results extend the growing literature linking democracy with important development outcomes (education, health, and spending on social programs) in a new direction. This study establishes an empirical link that may simultaneously affect developments in a majority of these areas. We also hope to have developed a methodological logic that will allow others to examine how politics affects the various trade-offs politicians make in their allocative decisions. Finally, and perhaps most important, for the poorest countries in the sample, our results corroborate implicit theoretical assumptions about democracy itself: democratic institutions compel politicians to favor wide segments of the population relative to more narrowly construed interests. In the case of electricity, democracy's role in compelling politicians to favor consumers relative to industrial interests in developing countries holds important unforeseen consequences for the quality of life for a large number of people.
APPENDIX
Construction of the Electricity Sector Privatization Index
We construct a 2-point (0-1-2) index of the state of electricity sector privatization for each country-year observation in the sample by consulting texts, articles, and reports on the energy sectors in various countries. If the electricity sector in a country is predominantly owned by the state or municipalities in a given year, then it gets a score of 0. If the country has undergone some action such that part of the market has been opened to and is being accessed by private investment, then it receives a score of 1. If reforms have been discussed or even passed in the legislative branch, but no private participation has yet occurred, then the country still gets a score of 0 for that year. If the electricity sector is primarily in the hands of private investors and all reforms have passed, then it receives a score of 2. We try to identify particular events in each country associated with privatization through our search of the written literature on the topics, and such events are typically associated with a change in the score. As an example, Finland switched from a score of 0 to a 1 in 1995 when an Electricity Market Act opened up the markets to competition. As another example, in Italy, the legislature allowed for sector liberalization in November 1995, and an increase in the private stake and price deregulation occurred in 1996.
It is important to note that the electricity sector privatization index is not synonymous with either an index of efficiency in that sector or a regulatory index. For example, Canada reportedly has an extremely efficient system (relative to other countries) that belongs to the public sector, and therefore receives a score of zero in our index. In contrast, Japan's system is reportedly rather inefficient and heavily regulated, but it belongs to the private sector and therefore receives a score of 2.
References Consulted to Construct the Index
The Benefits and Deficiencies of Energy Sector Liberalization, 1998, World Energy Council
The Americas in a World Context, 1999, Energy Information Administration, U.S. Department of Energy
International Energy Outlook 1996, 1997, 1998, 1999, 2000, Energy Information Administration, U.S. Department of Energy
Electricity Sector Deregulation in the APEC Region, 2000, Asia Pacific Energy Research Centre
Privatization and the Globalization of Energy Markets, 1996, Energy Information Administration, U.S. Department of Energy
Electricity Market Reform; An IEA Handbook, 1999, International Energy Agency/OECD
Electricity Reform: Power Generation Costs and Investment, International Energy Agency/OECD
Robert Bacon, “A Scorecard for Energy Reform in Developing Countries,” Public Policy for the Private Sector Note No. 175, World Bank, April 1999
Encyclopedia of the Nations, www.nationsencyclopedia.com
Wikipedia, The Free Encyclopedia, www.wikipedia.com
CIA World Factbook, www.cia.gov/cia/publications/factbook/geos/cs.html
Country Studies, Library of Congress, http://lcweb2.loc.gov/frd/cs/
Country Encyclopedia, www.countryenciclopedia.com
Country Risk Briefing: Ukraine, 11/10/05, Economist Intelligence Unit, The Economist
Belize Electric Limited, www.bel.com.bz/
Endesa, www.endesa.es
Interconexión Electrica S.A., http://isa.com.co/




Comments
No Comments have been published for this article.