Personality disorders are hypothesized to be genetically influenced forms of psychopathology that have their onset in adolescence or early adulthood and show a pattern of dysfunction throughout the life span (American Psychiatric Association [APA], 1994, 2000). Personality disorders are thus developmental constructs that are best understood within a life span perspective. However, a number of theorists have raised concerns about the potential deleterious effects of premature labeling that could arise as a consequence of diagnosing children and adolescents with personality disorders. Indeed, earlier versions of the current diagnostic system (Diagnostic and Statistical Manual of Mental Disorders—Third Edition, Revised; APA, 1987) required that an individual reach adulthood before a diagnosis of a personality disorder could be made. Because of such concerns and restrictions, much of the extant personality disorder research focuses on adults. The focus on adult samples, in turn, limits our understanding of the developmental origins of personality disorders as well as their normative trajectories across the life course.
Current theoretical frameworks such as the developmental psychopathology perspective (e.g., Cicchetti & Rogosch, Reference Cicchetti and Rogosch2002) argue that to understand psychopathology at a given endpoint (i.e., in adulthood), it is necessary to examine the course and variability of dysfunction beginning at a much earlier time point, such as adolescence or childhood. Such work would enable researchers to understand the factors underlying the continuity or discontinuity of psychopathology trajectories through the life span (e.g., Stattin & Magnusson, Reference Stattin and Magnusson1996).
Current conceptual and empirical work holds that the understanding of normative personality development can assist in understanding the development of personality pathology (Cicchetti & Rogosch, Reference Cicchetti and Rogosch2002). Specifically, multiple studies provide data for the notion that personality disorders are extreme variants on normal personality dimensions rather than distinct, independent categories (Edens, Marcus, & Ruiz, Reference Edens, Marcus and Ruiz2008; O'Connor & Dyce, Reference O'Connor and Dyce2001; Rothschild, Cleland, Haslam, & Zimmerman, Reference Rothschild, Cleland, Haslam and Zimmerman2003; Trull, Widiger, Lyham, & Costa, Reference Trull, Widiger, Lynam and Costa2003; Wilberg, Umes, Frits, Pedersen, & Karterud, Reference Wilberg, Urnes, Friis, Pedersen and Karterud1999). Moreover, recent work indicates etiologic (genetic and environmental) overlap (Jang & Livesley, Reference Jang and Livesley1999; Markon, Krueger, Bouchard, & Gottesman, Reference Markon, Krueger, Bouchard and Gottesman2002) and a common structural model (Markon, Krueger, & Watson, Reference Markon, Krueger and Watson2005; O'Connor, Reference O'Connor2002) between normal and abnormal personality. Given this overlap between normal personality dimensions and personality disorders, it is beneficial to draw upon research documenting the course and heritability of normal personality to understand maladaptive developmental processes (Cicchetti, Reference Cicchetti1984, Reference Cicchetti, Rolf, Masten, Cicchetti, Nuechterlein and Weintraub1990; Sroufe, Reference Sroufe1990).
Current research documenting the course of normal personality dimensions shows that these dimensions show significant mean-level change but high stability (Roberts & DelVecchio, Reference Roberts and DelVecchio2000) over the life span. In particular, traits such as negative affectivity and behavioral disinhibition show a pattern of mean-level decline over the life span, with the largest decline evidenced in the period between adolescence and adulthood (Blonigen, Carlson, Hicks, Krueger, & Iacono, Reference Blonigen, Carlson, Hicks, Krueger and Iacono2008; McGue, Bacon, & Lykken, Reference McGue, Bacon and Lykken1993; Roberts, Caspi, & Moffitt, Reference Roberts, Caspi and Moffitt2001), reflecting an increased maturity and flexibility (Roberts et al., Reference Roberts, Caspi and Moffitt2001). Finally, processes contributing to both the stability and change in personality traits are heritable (Blonigen et al., Reference Blonigen, Carlson, Hicks, Krueger and Iacono2008). Specifically, Blonigen et al. (Reference Blonigen, Carlson, Hicks, Krueger and Iacono2008) found that the factors that influence personality traits at both age 17 and 24 (i.e., contributions to stability) have an average heritability of about .30, whereas the factors that influence age 24 personality only (contributing to change since age 17) have a heritability of about .20.
Beyond mean-level changes and stability indices of individual differences, work on how heritability changes throughout adolescence and early adulthood can also inform researchers about risk processes and person–environment transactions. Again, it is useful to draw on work with normal personality dimensions to inform hypotheses about character pathology. In particular, personality traits such as aggression, fearfulness, approach, and religiosity (Koenig, McGue, Krueger, & Bouchard, Reference Koenig, McGue, Krueger and Bouchard2005; Matheny, Reference Matheny1989; Miles & Carey, Reference Miles and Carey1997) as well as some forms of personality pathology (i.e., antisocial personality disorder; Jacobson, Prescott, & Kandler, Reference Jacobson, Prescott and Kendler2002) show an age-related linear increase in heritability and a decrease in environmental influences. Similarly, Bergen, Gardner, and Kendler (Reference Bergen, Gardner and Kendler2007) reported evidence for cross-time heritability increases for externalizing/antisocial behavior, mood and anxiety disorder symptoms, and substance use. In part, these changes in heritability may be accounted for by gene expression changes, as genes are switched on or off in response to environmental context (Whitelaw & Whitelaw, Reference Whitelaw and Whitelaw2006). As an additional reason, behavior during childhood and preadolescence is more strongly influenced by social and/or familial environment (e.g., parental guidance) than in late adolescence and adulthood. With the transition into adolescence, however, individuals have an increased opportunity to actively select their own environments, experiences, and behavior, in turn leading to increased expression of the latent genotypes. Together, this analysis indicates that examining the change in heritability rather than simply relying on cross-sectional snapshots is likely to better inform our understanding of how changes in gene–environment interplay contribute to the development of personality.
This large research literature on the normative development and genetic and environmental influences on normal-range personality constructs can inform and guide research on the development of personality disorders. One disorder in which this type of extrapolation might be especially useful is borderline personality disorder (BPD). BPD is characterized by persistent problems with emotional (e.g., emotional lability), behavioral (e.g., deliberate self-harm and suicidal behavior), cognitive (e.g., dissociation), and interpersonal (e.g., chaotic relationships) functioning (APA, 1994). Individuals with BPD exhibit heightened levels of numerous health-compromising behaviors, including deliberate self-harm and suicidal behaviors, drug and alcohol abuse, unsafe sexual behavior, and disrupted eating behaviors (APA, 1994; Frankenburg & Zanarini, Reference Frankenburg and Zanarini2004; Links, Heslegrave, Mitton, van Reekum, & Patrick, Reference Links, Heslegrave, Mitton, van Reekum and Patrick1995; Skodol et al., Reference Skodol, Gunderson, Pfohl, Widiger, Livesley and Siever2002, Reference Skodol, Oldham, Bender, Dyck, Stout and Morey2005). Moreover, BPD frequently co-occurs with several Axis I disorders including mood, anxiety, eating, and substance use disorders (Zanarini et al., Reference Zanarini, Frankenburg, Dubo, Sickel, Trikha and Levin1998b; Wonderlich, Swift, Slomik, & Goodman, Reference Wonderlich, Swift, Slotnick and Goodman1990; Trull, Sher, Minks-Brown, Durbin, & Burr, Reference Trull, Sher, Minks-Brown, Durbin and Burr2000). Because of the public health costs and distress to individuals and families of those with BPD, there is an especially strong need for an understanding of the etiological factors involved in its development and persistence.
As is the case for most personality disorders, BPD is considered to be a genetically influenced disorder that has its etiologic roots in childhood and its onset in adolescence. Because of this developmental pattern, it is logical to begin investigating the stability and genetic and environmental influences at this window of time. However, a number of commentaries have questioned whether adolescent BPD is meaningful, in the light of findings indicating the diagnosis may not be temporally stabile. Specifically, studies of both community and hospitalized adolescents have reported that BPD in adolescence has low diagnostic stability over a period of 2–3 years (Mattanah, Becker, Levy, Edell, & McGlashan, Reference Mattanah, Becker, Levy, Edell and McGlashan1995; Meijer, Goedhart, & Traqffers, Reference Meijer, Goedhart and Treffers1998). For instance, Bernstein et al. (Reference Bernstein, Cohen, Velez, Schwabstone, Siever and Shinsato1993) followed a large sample of community adolescents over a period of 2 years and found that less than a third of those originally diagnosed with BPD met criteria for the disorder at the follow-up assessment. A similar pattern of findings was reported for longitudinal studies of adult psychiatric inpatients, such that across studies only about a third of patients originally diagnosed with BPD met the criteria for the disorder at 1–3 year follow-up assessments (Paris, Brown, & Nowlis, Reference Paris, Brown and Nowlis1987; Shea et al., Reference Shea, Stout, Gunderson, Morey, Grilo and McGlashan2002; Zanarini, Frankenburg, Hennen, & Silk, Reference Zanarini, Frankenburg, Hennen and Silk2003). Because clinical lore suggests that once a personality disorder has been diagnosed an individual is likely to meet the diagnosis indefinitely (Clark, Reference Clark2009), these disappointing findings have lead researchers to conclude that adolescent BPD is not a valid construct.
However, the low temporal stability in these studies is not surprising given that in every study a dichotomous diagnosis of BPD (presence or absence of a disorder) was used. As pointed out in a recent review (Clark, Reference Clark2009), a dichotomous diagnosis artificially widens the gap between individuals who are just above threshold and those that present with a subclinical level of symptoms (e.g., four out of five BPD symptoms). In turn, this categorization scheme renders it easy to switch from a clinical to a nonclinical group, leading to low diagnostic stability over time. A method that will yield more sensitive and precise measures of longitudinal stability is a dimensional assessment of BPD traits. The use of dimensional BPD scales allows the detection of slight variations in the level of symptom or trait expression. Moreover, scores on a dimensional scale can be compared to an individual's peer group, taking into account the normative adolescent behavior and emotional functioning at a given age. As an example of this methodology, Chanen et al. (Reference Chanen, Jackson, McGorry, Allot, Clarkson and Yuen2004) examined the temporal stability of BPD traits and other psychiatric disorders over a period of 2 years, using both a categorical and dimensional assessment of BPD. The results of this study indicated that the stability of the categorical BPD diagnosis was rather low, but the stability of BPD measured dimensionally was considerably higher (for similar results, see also Crick, Murray–Close, & Woods, Reference Crick, Murray-Close and Woods2005; Lenzenweger, Reference Lenzenweger1999). Taken together, these results suggest the utility of dimensional assessments in longitudinal BPD research.
In terms of etiological influences, relatively few investigations have examined the genetic and environmental contributions to BPD characteristics. Studies testing the heritability of the temperamental vulnerability to BPD, such as the traits of affective dysregulation and behavioral undercontrol, however, have reported moderate heritability estimates of .40 to .60 (Jang, Livesley, Vernon, & Jackson, Reference Jang, Livesley, Vernon and Jackson1996; Livesley, Jang, Jackson, & Vernon, Reference Livesley, Jang, Jackson and Vernon1993; Livesley, Jang, & Vernon, Reference Livesley, Jang and Vernon1998). To date, only four cross-sectional twin studies have examined the heritability of BPD traits per se and reported inconsistent results. A study focusing on a small sample of preadolescent twins (Coolidge, Thede, & Jang, Reference Coolidge, Thede and Jang2001) reported a BPD heritability estimate of 76%. However, recent studies focused on adult samples report heritability estimates ranging from 0% to 70% (Distel et al., Reference Distel, Trull, Derom, Thiery, Grimmer and Martin2008; Kendler et al., Reference Kendler, Aggen, Czajkowski, Roysamb, Tambs and Torgersen2008; Torgersen, Reference Torgersen1984; Torgersen et al., Reference Torgersen, Lygren, Oien, Skre, Onstad and Edvardsen2000, Reference Torgersen, Czajkowski, Jacobson, Reichborn-Kjennerud, Roysamb and Neale2008). The most recent studies provide a heritability estimates around 40%. For instance, in a large-scale study (2,748 adult twin pairs), Distel et al. (Reference Distel, Trull, Derom, Thiery, Grimmer and Martin2008) investigated the heritability of BPD using a well-validated self-report measure, the Personality Assessment Inventory Borderline Scale (Morey, Reference Morey1991). The authors reported that BPD features are influenced by a combination of genetic and nonshared environmental factors, with a heritability estimate of 42%. Finally, in a recent large-scale study (2,794 adult twin pairs) Torgersen et al. (Reference Torgersen, Czajkowski, Jacobson, Reichborn-Kjennerud, Roysamb and Neale2008) reported that the heritability of BPD as measured by a diagnostic interview was 35% (for similar results, see also Kendler et al., Reference Kendler, Aggen, Czajkowski, Roysamb, Tambs and Torgersen2008).
These cross-sectional studies represent excellent steps toward determining the genetic and environmental influences on BPD. But because these studies focused almost exclusively on adults, it is difficult to make inferences about the changing nature of risk processes throughout development. Indeed, as noted above, for most behavioral phenotypes, heritability increases in the transition from adolescence to adulthood. The examination of this change in heritability affords excellent opportunities to make inferences about the transactions between personality and environment. Specific to BPD, adolescence is a period of time in which the prodromal condition or the actual disorder first manifests. As such, there is a clear need for the use of longitudinal designs that examine the genetics and the unfolding of BPD characteristics in the period between adolescence and early adulthood (cf. Lenzenweger & Cicchetti, Reference Lenzenweger and Cicchetti2005).
Current Study
The current study examined the longitudinal course and heritability of BPD traits over a period of 10 years starting in adolescence (age 14) and ending in adulthood (age 24). In doing so, we extended prior work that mostly utilized small adult and/or clinical samples, categorical measures of BPD, and relatively short (2–3 year) follow-up intervals. We took advantage of a large community sample of adolescent twins; a new, well-validated dimensional measure of BPD traits; and an extended follow-up period to investigate the heritability of BPD traits over the critical age span during which they typically first become manifest.
In examining the longitudinal course of BPD characteristics, we examined two indices of stability and change. The first was mean-level stability, an analysis examining how the level of expressed BPD varies with age. As a second index of stability and change, we explored the differential or rank-order stability of BPD traits. This index refers to the retention of an individual's relative placement in the group over a period of time. We also examined the genetic and environmental influences on trait BPD at each of four assessment ages (14, 17, 20, and 24). Finally, we used a genetically informed latent growth curve model to examine the genetic and environmental influences on the change and stability of BPD traits over time. Based on the studies examining the trajectories of normal personality, we expected that the mean-level BPD scores would diminish from adolescence to adulthood, whereas rank-order stability would remain moderate to high. Consistent with previous data on externalizing, internalizing, and substance use disorders (Bergen et al., Reference Bergen, Gardner and Kendler2007), we expected an increase in heritability from adolescence to adulthood. Finally, we expected a moderate to strong genetic contribution to the stability and change of BPD traits over time.
Method
Sample
Participants were adolescent female twins taking part in the Minnesota Twin Family Study (MTFS), an ongoing population-based, longitudinal study of twins and their families (Iacono, Carlson, Taylor, Elkins, & McGue, Reference Iacono, Carlson, Taylor, Elkins and McGue1999). Birth records and public databases were used to locate more than 90% of families that included a twin birth in the state of Minnesota from 1975 to 1984 and 1988 to 1994. Eligible twins and their families were (a) living within a day's drive of Minneapolis with at least one biological parent, and (b) had no mental or physical handicap precluding participation. All protocols were approved by the institutional review board. Parents and children gave informed consent or assent as appropriate.
The MTFS intake sample includes an 11-year-old and a 17-year-old cohort consisting of male and female twins. However, the current study focused on the female twins, as the male twins only had BPD data at two assessment time points. Intake and follow-up assessments are scheduled to coincide with major transitions in the lives of adolescents and young adults. The younger cohort (age 11 at intake) was recruited using two methods. Approximately 60% of this sample was drawn from the general community with no exclusions other than the ones described above. The remaining 40% of families (enrichment sample, ES) were recruited using a procedure designed to enrich the participation of high-risk adolescents, that is, adolescents who are at risk for the development of a childhood disruptive disorder by age 14. Specifically, half of the families were screened via an interview with the mother and retained if at least one twin exhibited elevated symptoms of attention-deficit/hyperactivity disorder or conduct disorder. These screener variables were chosen based on data from the larger MTFS study, as they serve as predictors for the onset of a childhood disruptive disorders by age 14. Previous investigations have successfully used a similar sampling method (Kim-Cohen, Moffitt, Taylor, Pawlby, & Caspi, Reference Kim-Cohen, Moffitt, Taylor, Pawlby and Caspi2005). The other half of this subset was recruited using the same methods as the larger study. As this sampling procedure was successful in elevating the prevalence of psychopathology in this cohort, a weighting procedure was used to adjust for the nonrandom recruitment for the portion of the sample that was screened prior to inclusion. To adjust for the unequal selection probabilities of families in this sample, we weighted each pair by the inverse of its probability of inclusion in the sample. Because selection occurred at the level of the twin pair, weights are applied at this level as well. The original MTFS sample was an equal probability sample; all twin pairs are therefore equally weighted.
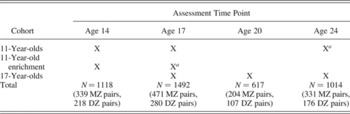
BPD traits were first assessed at age 14 for the younger cohort, and at age 17 for the older cohort. Follow-up assessments of BPD traits were conducted at age 17 and 24 in the younger cohort and at ages 20 and 24 in the older cohort. Attrition rates ranged from 5% to 10% for any given assessment; however, if an individual did not participant in a given follow up assessment attempts were made to recruit that individual to participate in later follow up assessments. Table 1 provides a schematic representation of the available data. Specifically, at age 14, BPD data were available for the younger cohort and the 11-year-old ES twins. At age 17, data were combined for the older and younger cohorts as well as for the portion of the ES twin sample that had completed their second follow up assessment (with assessments ongoing for the majority of ES twins). At age 20, data were available for the older cohort twins, and a small number of younger cohort twins for whom personality was not assessed at the age 17 follow-up. At age 24, BPD data were available for the older and younger cohorts. In the current study, the cohorts were combined and matched by age of assessment (see Table 1 for breakdown of Ns across cohorts). It should be noted that despite the fact that subjects did not all have data available at each time point, the analytic procedures used in the current study (see below for description) provide an optimal representation of the data, as long as the data were missing at random (Little & Rubin, Reference Little and Rubin1987; for similar methods and analyses, see Carlson & Iacono, Reference Carlson and Iacono2006; Johnson, McGue, & Iacono, Reference Johnson, McGue and Iacono2006).
Schedule of assessments across cohorts

Note: MZ, monozygotic; DZ, dizygotic.
aData are still being collected for this assessment point.
Zygosity was determined by agreement among three estimates: MTFS staff evaluations of the twins' physical similarity, parents' completion of a standard zygosity questionnaire, and twin similarity on an algorithm of ponderal and cephalic indices and fingerprint ridge count. A serological analysis was performed if the three estimates did not agree.
Consistent with the demographics of Minnesota for the birth years sampled, over 95% of the twins were Caucasian. Although the assessments were scheduled at specific ages, there was still slight variability in age at each assessment. Because preliminary analyses of the current data indicated that the scores on the Multidimensional Personality Questionnaire—Borderline Personality Disorder Scale (MPQ-BPD; Bornovalova, Hicks, Patrick, Iacono, & McGue, Reference Bornovalova, Hicks, Patrick, Iacono and McGue2009) are negatively associated with age, we used a centering procedure to regress out the age effects on BPD traits within a particular time frame. For instance, scores at the age 14 assessment actually ranged from 13.5 to 17. To center the BPD scores around age, we regressed these variations out of the age 14 personality assessment.
Measures
MPQ-BPD
The MPQ (Tellegen, Reference Tellegen1982; Tellegen et al., Reference Tellegen, Lykken, Bouchard, Wilcox, Segal and Rich1988; Tellegen & Waller, Reference Tellegen, Waller, Boyle, Matthews and Saklofske2008) is a self-report inventory that was developed through factor analysis to assess a variety of personality traits and temperament constructs frequently identified in the personality literature. The MPQ includes 11 primary trait scales that load onto three higher order factors. The traits of well-being, achievement, social closeness, and social potency load onto the higher order factor of positive emotionality (predisposition to experience positive affect); the traits of stress reactivity, alienation, and aggression make up the higher order factor of Negative Emotionality (the predisposition to experience negative affect); the traits of control, harm avoidance, and traditionalism load on the higher order factor of Constraint (predisposition to behavioral self-control, the converse of disinhibition); and the trait of absorption (the tendency to experience vivid and compelling images and become easily engrossed in sensory stimuli) does not load preferentially on any of the higher order factors. Scores from the traits scales of the MPQ have demonstrated high internal consistency (Cronbach αs = .74–.84; Tellegen, Reference Tellegen1982; Tellegen & Waller, Reference Tellegen, Waller, Boyle, Matthews and Saklofske2008). The 198-item version of the MPQ was administered at ages 17 and 24. A shorter version (133 items), administered at ages 14 and 20, included 6 of the 11 scales: well-being, stress reaction, alienation, aggression, control, and harm avoidance (for a further description of this measure, see Johnson, Hicks, McGue, & Iacono, Reference Johnson, Hicks, McGue and Iacono2007). Each MPQ item was answered “definitely true,” “probably true,” “probably false,” or “definitely false” and assigned a score from 1 to 4.
The MPQ-BPD is a 19-item scale developed through item and content analysis of the 198-item version of the MPQ, and it was designed to be similar to the Personality Assessment Inventory—Borderline Scale (Morey, Reference Morey1991), the BPD measures used in the Distel et al. (Reference Distel, Trull, Derom, Thiery, Grimmer and Martin2008) heritability study. Items on the MPQ-BPD were rated on the 4-point scale and keyed such that higher scores indicated a higher level of trait BPD. Hence, a total BPD trait score was calculated by adding the ratings on the 19 items, with possible scores ranging from 19 to 76.
The MPQ-BPD was developed and validated in five samples. Final scale items were identified after conducting various psychometric analyses in a sample of undergraduate students (n = 274) and cross-validation analyses in a large community sample of twins in late adolescence (n = 1,132). The resulting item set was drawn from the stress reaction, alienation, control, aggression, well-being, and absorption scales of the MPQ, and scores on this scale were strongly related to the Personality Assessment Inventory—Borderline Scale in the undergraduate sample (r = .80).
A valid measure of the BPD construct should show a theoretically expected pattern of associations with childhood trauma, posttraumatic stress symptoms, substance use disorders, internalizing distress, and externalizing behaviors, in line with well-established findings (Siever, Torgersen, Gunderson, Livesley, & Kendler, Reference Siever, Torgersen, Gunderson, Livesley and Kendler2002; Skodol et al., Reference Skodol, Gunderson, Pfohl, Widiger, Livesley and Siever2002; Zanarini et al., Reference Zanarini, Williams, Lewis, Reich, Vera and Marino1997, Reference Zanarini, Frankenburg, Dubo, Sickel, Trikha and Levin1998b). Consistent with expectation, the MPQ-BPD was correlated with indices of depression, anxiety, substance use disorders, and antisocial behavior in the adolescent twin sample.
To further explore the construct validity of the MPQ-BPD, we examined the relationship of the MPQ-BPD to a number of external/clinical correlates in three clinical samples that are known to have elevated rates of BPD: female prisoners, male prisoners, and urban substance users. The MPQ-BPD showed an expected pattern of associations and was significantly related to the external variables that should be associated with the latent construct of BPD: a history of traumatic exposure (r = .27); symptoms of posttraumatic stress disorder (r = .56); indices of behavioral disinhibition including a diagnosis of conduct disorder and adult antisocial behavior, criminal charges before age 17, a violent behavior composite, and measures of trait impulsivity (r = .19–.42); indices of internalizing distress including symptoms of depression and anxiety as well as history of past suicide attempts (rs = .31–.48); and drug/alcohol use severity including alcohol abuse and dependence scales, substance use frequency, and a number of substance dependence diagnoses (r = .25–.42). In addition, the MPQ-BPD was significantly related to scores on normal-range personality scales tapping negative affect (including the dimensions of distress, fearfulness, anger, neuroticism, and negative affectivity r = .47–.64), positive affect (r =−.39), and disinhibition (including the dimensions of [lack of] socialization; sensation seeking and impulsivity, r = .26–.32).
As a further index of construct validity, the MPQ-BPD scores were strongly related to another continuous measure of BPD (the Inventory of Interpersonal Problems [IIP]-BPD; Lejuez et al., Reference Lejuez, Daughters, Nowak, Lynch, Rosenthal and Kosson2003; r = .62) as well as the DSM-based diagnosis of BPD (point-biserial correlation = .60). Beyond this general correlation, we examined the incremental validity of our new measure by testing if it was predictive of clinical/external variables even after controlling for the diagnosis of BPD. Our findings revealed that the MPQ-BPD was predictive of childhood trauma (ΔR 2 = .058, p < .001), depression symptoms (ΔR 2 = .126, p < .001), impulsivity (ΔR 2 = .254, p < .001), drug use frequency (ΔR 2 = .028, p < .01), and the self-report measure of BPD (IIP-BPD; ΔR 2 = .275, p < .001). This pattern of findings held even when a BPD symptom count rather than a diagnostic variable was used as a covariate. Similarly, we examined whether the MPQ-BPD was adding predictive utility beyond simply negative affectivity. The MPQ-BPD was predictive of depression symptoms (ΔR 2 = .076, p < .001), impulsivity (ΔR 2 = .179, p < .001), number of substance dependence diagnoses (ΔR 2 = .030, p < .05), and the IIP-BPD (ΔR 2 = .051, p < .001). These results suggest that the MPQ-BPD is capturing something over and above negative emotionality.
Internal consistency was high across the community and clinical samples (Cronbach α = .81–.83). Thus, the MPQ-BPD demonstrates substantial construct validity across a number of criteria and shows excellent promise for use in studies of development and etiology (Bornovalova et al., Reference Bornovalova, Hicks, Patrick, Iacono and McGue2009).
As noted above, at age 14 and 20, participants received a 133-item shortened version of the MPQ. Because this version lacked two items on the MPQ-BPD scale (these items are part of the original Absorption scale), scores were prorated for the age 14 and 20 assessments (mean of scores on 17 items multiplied by 19).
Statistical analyses
Mean-level change and rank-order stability of BPD traits
We conducted two sets of analyses to assess developmental change in BPD traits: mean-level change, and rank-order stability. Mean-level change refers to the magnitude of change in the average scale scores over time for a given population. Mean-level effects were evaluated by calculating effect sizes for the change in mean score relative to the age 14 mean (see above discussion about centering age at 14). Our second index of developmental change was rank-order stability. This index refers to the consistency of the relative ordering of individuals over time, and provides an indicator of the extent to which participants maintain their relative position in a group over time. In the current study, rank-order stability was assessed via the test–retest Pearson correlation coefficients for the MPQ-BPD over all follow-up points. Significance levels were adjusted with linear mixed models in SPSS to account for the nonindependence of the twin observations.
Biometric analyses
Standard biometric models were used to estimate the influence of additive genetic, shared environmental, and nonshared environmental factors on MPQ-BPD scores at each time point. In all biometric models, the additive genetic component (A) refers to the additive effect of individual genes summed over loci on trait variance. Genetic influences are inferred if the monozygotic correlation is greater than the dizygotic correlation for a given trait. Shared environmental (C) effects refer to environmental influences that increase similarity between members of a twin pair. Shared environmental effects are inferred if the dizygotic correlation is more than one-half of the monozygotic correlation. Nonshared environmental (E) effects refer to environmental factors that contribute to differences between members of a twin pair. Measurement error is also included in the estimate of E.
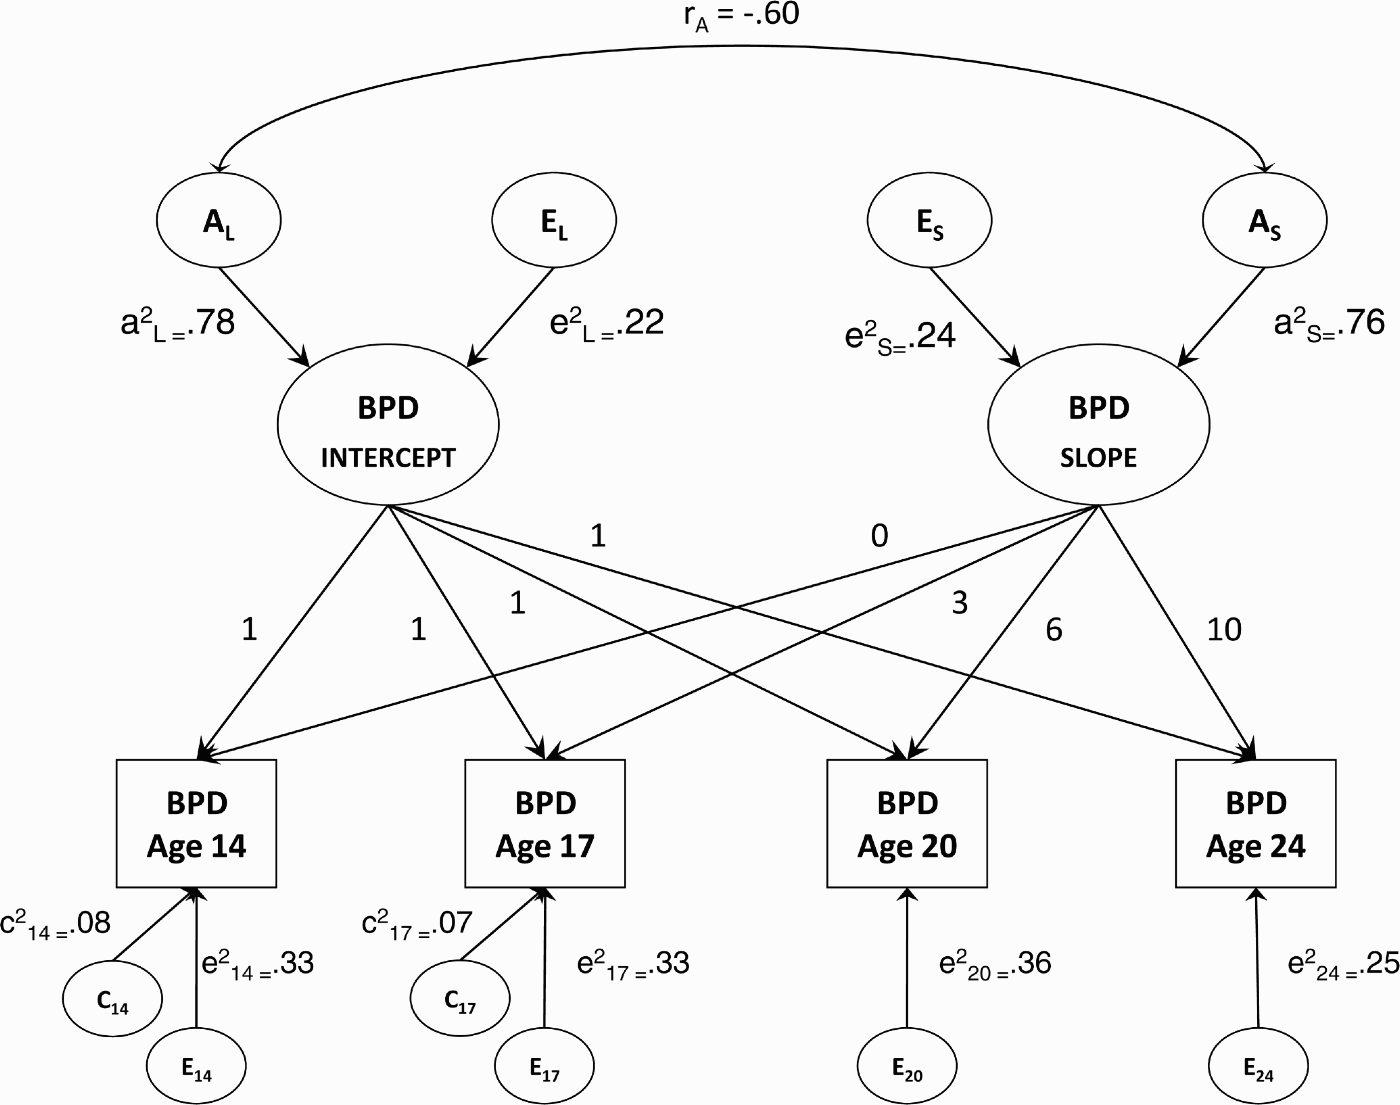
Finally, a biometric growth model was fit to the multiple waves of BPD trait data to examine the genetic and environmental effects on change and stability in BPD traits over time. All models were fit in the computer program Mx (Neale, Boker, Xie, & Maes, Reference Neale, Boker, Xie and Maes1999) using raw data maximum likelihood estimation. The biometric growth model extends the latent growth model to twin data (Neale & McArdle, Reference Neale and McArdle2000). Figure 1 provides a graphical depiction of the model. In the growth model, BPD traits at each age are a function of an intercept (initial status) or overall level effect, and a slope or rate of change effect. The variance of the latent intercept and slope variables can be further decomposed into additive genetic, shared environment, and nonshared environmental effects. The intercept and slope variables are also allowed to correlate, and the source of their covariance can also be decomposed into genetic and environmental effects (r a, r c, r e). In addition to the general intercept and slope effects, BPD traits at each age are also influenced by occasion-specific residual effects, which can also be decomposed into genetic and environmental effects. Latent growth models can easily accommodate missing data as long as the data is missing at random, a reasonable assumption for the current study. Previous work indicates that maximum likelihood estimation that uses all available data results in less bias in parameter estimates and fewer convergence failures in structural equation models than common alternative methods such as listwise deletion, pairwise deletion, regression based imputation, or mean imputation (Enders & Bandalos, Reference Enders and Bandalos2001) under the assumption of data as missing at random. Moreover, simulation studies (Newman, Reference Newman2003) support the idea that using maximum likelihood estimation with all available data under the assumption that data are missing at random results in solutions with less bias, smaller standard errors, more stable estimates of population parameters over successive repetitions, and fewer inadmissible solutions than these other methods. This is true even when 50% of the data are missing at random. Even if the data are not missing at random, a maximum likelihood approach using all available data is no worse than and often better than other approaches when as much as 50% of data are missing.
A graphical depiction of the initial biometric growth model (all paths included) for initial borderline personality disorder (BPD) status and BPD change over time. The model allows for BPD scores to be observed at four assessment points (age 14–17). Each assessment point is assumed to reflect an effect of initial status (intercept), change (slope), and assessment-specific additive genetic (A), shared environmental (C), and nonshared environmental effects (E). The intercept and slope effects are also decomposed into correlated additive genetic, shared environmental, and nonshared environmental effects. Subscripted numbers refer to the age of measurement, and numbers above the paths from the initial level and slope to occasion-specific scores refer to years from initial assessment.

Model fit was evaluated using the likelihood ratio test. That is, the −2 × log-likelihood (−2LL) of the full growth model was compared to the −2LL of nested model that removed nonsignificant parameters from the model. Differences between models in the likelihood are distributed as a chi-square with degrees of freedom equal to the difference in the number of model parameters. In addition to the chi-square statistics, we also used several information theoretic fit indices that balance overall fit with model parsimony such that lower values are indicative of better fit. These fit indices included the Akaike information criterion, the Bayesian information criterion, the sample-size adjusted Bayesian information criterion, and the deviance information criterion. The Akaike information criterion, Bayesian information criterion, and deviance information criterion are not interpreted in isolation; rather, they are interpreted collectively to compare alternative models such that lower values are indicative of better fit.
Results
Mean-level change and rank-order stability over four time points
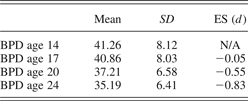
Table 2 provides the means, standard deviations, and effect sizes of change for the MPQ-BPD scores for four time points. To estimate these means and effect sizes despite the missing data patterns, we utilized an expectation–maximization algorithm in SPSS to impute missing values. To obtain effect size indices, the age 17, 20, and 24 scores were compared to age 14 scores. The overall pattern indicates steady declines in MPQ-BPD scores from age 14 to age 24. Specifically, there was no meaningful change from age 14 to age 17, moderate change from age 14 to 20, and a large change from age 14 to 24.
Means and longitudinal change of BPD traits as measured by the MPQ-BPD across five time points
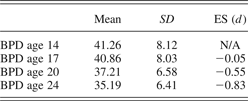
Note: BPD, borderline personality disorder; MPQ-BPD, Multidimensional Personality Questionnaire—Borderline Personality Disorder Scale (Tellegen, Reference Tellegen1982); ES (d), effect sizes of difference from age 14.
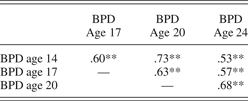
Table 3 provides the correlations among the MPQ-BPD scores across the four time points. The MPQ-BPD scores evidenced high rank-order stability, as indexed by the high correlations between all time points (r = .53–.73, all ps < .001).
Rank order stability of BPD symptoms from age 14 to age 24
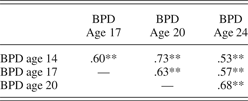
Note: BPD, borderline personality disorder.
**p < .01.
Univariate biometric analyses
Table 4 presents the genetic and environmental contributions to the MPQ-BPD scores across the four time points. The univariate biometric models revealed that, at age 14, there was a modest effect of additive genetic and shared environmental factors and a large effect of nonshared environmental factors. In contrast, at ages 17, 20, and 24, the influence of additive genetic factors tended to increase, whereas the effects of shared environmental factors gradually fell to zero. The effects of nonshared environmental factors became slightly stronger from age 17 to 24.
Variance component estimates for each assessment time point

Note: MZ, monozygotic; DZ, dizygotic; BPD, borderline personality disorder.
Biometic growth curve modeling
We began by fitting a full model that included all possible parameters, including general genetic and environmental effects on both intercept and slope; occasion (assessment time point)-specific genetic and environmental effects; and genetic and environmental correlations between the general genetic and environmental influences on intercept and slope. This model was used as a “standard” of model fit. Next, consistent with previous investigations using these modeling techniques (e.g., Carlson & Iacono, Reference Carlson and Iacono2006; McGue & Christensen, Reference McGue and Christensen2003), we began removing nonsignificant parameters from the model. All subsequent models were compared to the full model to see if they fit the observed data as well or better than the full model. These reduced-growth models allowed us to test for necessity of genetic and environmental factors to the intercept, slope, and occasion-specific effects.
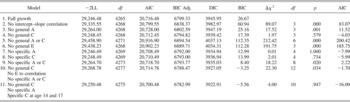
The fit statistics for these reduced models are listed in Table 5. Several reduced models yielded improved fit relative to the full growth model. Model fit improved (decreases in fit indices) when shared environmental effects to the latent intercept and slope variables were removed (Model 4), when occasion-specific additive genetic and shared environment effects were removed (Models 7 and 8, see also Model 9), and when covariance between the intercept and slope variables was restricted to genetic factors only (i.e., nonshared environmental effects are set equal to zero, Model 10). Removal of any other parameters decreased model fit (Models 2, 3, 5, and 6). Because taking out the specific genetic and shared environmental factors simultaneously resulted in a slightly worse model fit, we examined the residuals as well as the univariate models. Together, these suggested that adding occasion-specific shared environmental effects at age 14 and 17 might improve model fit. Putting these parameters back into the model significantly improved model fit, with all three fit indices favoring Model 11 which yielded the best fitting model in terms of balancing overall fit with model parsimony.
Model fit statistics for biometric growth model

Note: −2 LL, −2 log likelihood; AIC, Akaike information criterion; BIC, Bayesian information criterion; DIC, deviance information criterion.
Figure 2 provides a graphical depiction of the best fitting model that included additive genetic and nonshared environmental effects on the latent intercept and slope variables, the correlation between the intercept and slope because of genetic factors, occasion-specific shared environmental effects at ages 14 and 17, and occasion-specific nonshared environmental effects present at each time point. In terms of how well the model approximated the observed data, the model estimated mean intercept corresponded to a BPD trait score of 42.1, and the mean slope indicated that the trait score declined by −.69 units on the MPQ-BPD scale per year. These model estimates are similar to the observed mean MPQ-BPD score at age 14 (41.3) followed by a linear decline in scores over the succeeding 10 years (42.1–10[−.69] = 35.2, similar to the observed mean MPQ-BPD score of 35.19 at age 24). The correlation between the intercept and slope was −.44, indicating a tendency for female twins with higher initial scores to exhibit greater declines in their MPQ-BPD scores over time.
A graphical depiction of the final biometric growth model after removal of nonsignificant paths for initial borderline personality disorder (BPD) status (level) and BPD change over time (slope). Genetic influence (A), shared environmental influence (C), and nonshared environmental influence (E) effects are shown. Subscripted numbers refer to the age of measurement. Coefficients on the diagram are standardized variance component estimates (i.e., paths squared).

The biometric results showed that both the intercept (a 2 = .78, 95% confidence interval = .53, 1.00) and slope (a 2 = .76, 95% confidence interval = .69, .82) were highly heritable with modest nonshared environmental effects. This indicates that both a person's stable or average-level of BPD traits at different time points and their rate of change across time was highly heritable. In addition, there was a high genetic correlation between initial status and slope (r = .60), indicating that the same genetic factors that influence BPD trait stability also influence change. It was notable that the heritability of the latent intercept and slope variables was much higher than the heritability estimate for any given specific time point (see Table 4). In terms of occasion-specific effects, there were modest shared environmental effects at age 14 and 17, but these dropped to zero at the older assessments in young adulthood. Occasion-specific nonshared environmental effects were present at each time point, indicating both time-specific environmental influences and measurement error.
Discussion
Although personality disorders are considered to be problems that are best understood in the context of lifetime development, there is a paucity of work examining their stability and change during the key period from adolescence to young adulthood, and little regarding how genetic and environmental influences contribute to their development. To understand the unfolding of the underlying risk processes contributing to the development of personality disorders, it is necessary to examine the onset, course, duration, and stability of PDs using repeated assessment of youths as they mature to adulthood. This is especially true in the case of BPD. Indeed, although BPD is considered to have an onset in adolescence or young adulthood, there is a limited literature examining its developmental course. The studies that do focus on adolescents or longitudinal course are mostly limited by the predominant use of clinical samples, small sample sizes, and relatively short follow-up times, as well as the use of dichotomous/diagnostic measures of BPD that limit the ability to examine subtle changes over time. Finally, no studies have yet examined the gene–environment interplay of BPD traits in the window between adolescence and adulthood, which is a necessary step in understanding (and in turn, influencing) the pathways of risk and resilience (Cicchetti & Curtis, Reference Cicchetti and Curtis2007; Lenzenweger & Cicchetti, Reference Lenzenweger and Cicchetti2005).
In the current study, we aimed to fill in these conceptual and methodological gaps in the literature. In particular, we aimed to provide more definitive answers about the longitudinal course and stability of BPD characteristics over the period of adolescence to adulthood, that is, the period when BPD traits become manifest (Bernstein et al., Reference Bernstein, Cohen, Velez, Schwabstone, Siever and Shinsato1993). In doing so, we utilized a overlapping sequential cohort longitudinal design that improves considerably on previous studies. Specifically, we utilized a large representative community sample of adolescent twins, a sensitive dimensional measure of BPD traits, and repeated assessments over an extended follow-up period (spanning 10 years after the initial assessment). In addition, we examined how genetic and environmental influences contributing the trait BPD vary over this developmental period, providing novel findings that set the stage for future work that examines the exact nature of gene–environment interplay in BPD over the course of development.
In exploring the course of BPD traits, we examined the degree to which the mean level of trait BPD traits as well as its rank ordering over the span of 10 years. The results indicated that mean-level MPQ-BPD declined from adolescence to adulthood. Although there was little change from age 14 to 17, thereafter, the mean-level BPD traits declined significantly at each assessment point. This leveling off of trait BPD from mid to late adolescence is not necessarily an intuitive finding. Indeed, given the overlap between normal personality and personality pathology, it would instead be reasonable to predict that BPD traits would first increase from age 14 to 17, and only then decrease at follow-up assessments, which is a pattern found with the normal personality dimension of negative affect (DiRago, Hicks, & Iacono, Reference DiRago, Hicks and Iacono2009; Johnson et al., Reference Johnson, Hicks, McGue and Iacono2007). In contrast, two studies on personality pathology proper report that BPD traits as well as the absolute prevalence of the disorder are highest around puberty (ages 12–14) and decline thereafter (Bernstein et al., Reference Bernstein, Cohen, Velez, Schwabstone, Siever and Shinsato1993; Johnson et al., Reference Johnson, Cohen, Kasen, Skodol, Hamagami and Brook2000). The fact that our results are consistent with the latter two studies suggests that we are capturing the “true state of affairs.”
The MPQ-BPD also showed moderate rank-order stability from age 14 to 24, which is a pattern of results similar to those of Chanen et al. (Reference Chanen, Jackson, McGorry, Allot, Clarkson and Yuen2004), who found a BPD stability index of .54 (albeit over 2 rather than 10 years). The current pattern of stability and change are also in line with previous longitudinal studies of normal personality dimensions. Indeed, a large number of empirical studies and meta-analyses report that the degree of distress, dysfunction, and behavioral undercontrol as measured by traits such as negative affect and disinhibition decline from adolescence to adulthood (Blonigen et al., Reference Blonigen, Carlson, Hicks, Krueger and Iacono2008; Roberts et al., Reference Roberts, Caspi and Moffitt2001; Roberts, Walton, & Viechtbauer, Reference Roberts, Walton and Viechtbauer2006), reflecting a trend toward an increased level of maturity and ability to adjust to progressively more challenging environmental demands. These and other studies also provide evidence for an increase in the stability of personality from childhood to adulthood (Caspi et al., Reference Caspi, Roberts and Shiner2005; Roberts & DelVecchio, Reference Roberts and DelVecchio2000). Thus, the similarity of the trajectory of BPD traits with the longitudinal pattern evidenced by normal personality dimensions provides some evidence for the previously suggested notion that BPD is an extreme version on a continuum of normal personality functioning (e.g., Trull et al., Reference Trull, Widiger, Lynam and Costa2003).
As another approach to the study of risk trajectories, we also examined the genetic and environmental influences on BPD traits at the four time points. This type of longitudinal examination of heritability affords the opportunity to make inferences about the transactions between personality and environment during the window between adolescence and adulthood. We found evidence for the average heritability of approximately .3–.5, consistent with the results of Distel et al. (Reference Distel, Trull, Derom, Thiery, Grimmer and Martin2008). Yet, unlike the results of Distel et al. and others (Coolidge et al., Reference Coolidge, Thede and Jang2001; Torgersen et al., Reference Torgersen, Lygren, Oien, Skre, Onstad and Edvardsen2000), we found some limited evidence for a shared environmental influence, although this effect failed to reach significance. The strength of shared environment also declined with increasing age. The disparity between the studies is not surprising. Indeed, previous work indicates that the influence of shared environment on many behavioral phenotypes declines over time (Bergen et al., Reference Bergen, Gardner and Kendler2007), and the Distel et al. (Reference Distel, Trull, Derom, Thiery, Grimmer and Martin2008) and Torgersen (Reference Torgersen1984; Torgersen et al., Reference Torgersen, Lygren, Oien, Skre, Onstad and Edvardsen2000) studies mainly utilized samples that were generally late into adulthood. Finally, we found evidence for consistently strong effects of nonshared environment. The exact origin of this variance remains to be investigated; however, it most likely stems from factors such as exposure to childhood abuse and other traumatic life events, differential parental treatment (or perceptions of such), and nonsystematic events (e.g., accidents).
Our results also indicated a trend for increasing heritability of trait BPD over the course of 10 years. This finding is similar to that observed in studies concerning other forms of psychopathology (i.e., externalizing behavior, anxiety symptoms, depressive symptoms, substance use). This trend might be due to the declining influence of shared environmental factors, gene expression changes, or a transaction between environment and personality (i.e., gene–environment correlations), such that over time, individuals have more opportunities to choose environments in which their genetic risk is more likely to become expressed (Bergen et al., Reference Bergen, Gardner and Kendler2007; Fruzzetti, Shenk, & Hoffman, Reference Fruzzetti, Shenk and Hoffman2005). These competing hypotheses remain to be disentangled in follow-up studies.
Finally, we fit a series of biometric latent growth models to examine the genetic and environmental influences on the stability and change in BPD traits over time. The final reduced model revealed that there were strong additive genetic effects and modest nonshared environmental effects on both stability and change of BPD traits. Thus, although BPD scores at any given time point were only moderately heritable, an individual's overall, stable level of trait BPD as well as the degree to which one changes in her level of BPD are strongly heritable. The most likely reason for the difference between the moderate univariate heritability and the large latent factor heritability is reduced measurement error in trait BPD when all four assessment time points are accounted for in the biometric model. In addition, the high negative correlation between the genetic effects on the intercept and slope suggests that the genes influencing the latent BPD trait stability overlap highly with the genes influencing change in BPD trait levels. Finally, examination of the residual or occasion-specific effects revealed an absence of specific genetic influences for any given time point. Instead, the best-fitting model revealed a limited presence of occasion-specific shared environmental factors that disappear by age 20 and a stable presence of nonshared environment or idiosyncratic factors plus error.
The sum of the current findings has a number of clinical implications that should be noted. First, the current findings on the stability and change of BPD traits belie the clinical myth of “once a personality disorder, always a personality disorder.” Instead, our results indicate that personality disorders in general and BPD in particular are developmental processes that have normative increases and decreases throughout development (Clark, Reference Clark2009). In other words, an adolescent who scores in the top ranges on BPD scales at age 14 will not necessarily have the same level of pathology and dysfunction at age 24. Instead, this same adolescent will most likely show the steepest decrease in symptoms/traits at a later age. Second, the current findings establish that the critical risk period (the window or point in time where symptoms are at their peak) for BPD characteristics is around ages 14–17. In the tradition of successful interventions during periods of highest risk (e.g., prevention of alcohol use disorders and antisocial behavior), it may be most useful to intervene at this critical time to influence the trajectory of BPD in a positive direction.
Finally, the increasing influences of genetic factors over time and the strong influence of such factors on both stability and change do not mean that environmental influences (i.e., family) “don't matter” at later ages. As noted in the introduction, environment is likely to influence gene expression (Bergen et al., Reference Bergen, Gardner and Kendler2007). In turn, this implies that an intervention at the level of, for instance, family might ensure an environment that serves as a protective factor against the expression of pathological traits.
Despite these interesting and informative results and implications, a number of methodological constraints should be acknowledged. First, the current study focused on a sample of female twins. As such, we were not able to examine gender differences in the course and heritability of the MPQ-BPD. Second, the current study relied on a novel self-report of BPD levels. Although the construct validity of this measure is supported by a host of findings derived from studies of five different community and clinical samples, future studies would benefit from the use of a multi-assessment, multi-informer design, because previous work suggests that different assessment methods and informants eachprovide unique and valid information (Oltmanns & Turkheimer, Reference Oltmanns and Turkheimer2009). Third and finally, the current study followed the participants only up to age 24. It will be informative to continue following the current participants through middle adulthood and even further to continue examining the course and heritability over the entire life span.
Conclusion
In summary, the current study was successful in indexing the longitudinal course and heritability of BPD levels in the time period between adolescence and adulthood. This work provides a basis for a number of follow-up studies. For instance, future work might aim to address the question of “what makes the developmental challenges of mid and late adolescence (e.g., identity development, orientation to romantic relationships) so challenging?” (Lenzenweger & Cicchetti, Reference Lenzenweger and Cicchetti2005). As an example of this line of research, it would be interesting to attempt to account for the variance in the initial status and change in BPD traits using several predictors such as environmental stress (e.g., childhood trauma) or the presence of co-occurring distress and dysfunction (e.g., substance use, depression). Such variables might also be used to predict the initial status and slope of BPD trait levels in structural models such as one used in the current study (e.g., Lenzenweger & Castro, Reference Lenzenweger and Castro2005). Likewise, future work might examine whether protective factors including environmental, neurobiological, and molecular genetic variables (Charney, Reference Charney2004; Cicchetti & Gunnar, Reference Cicchetti and Gunnar2008; Cicchetti, Rogosch, & Sturge-Apple, Reference Cicchetti, Rogosch and Sturge-Apple2007; Curtis & Cicchetti, Reference Curtis and Cicchetti2007) can be used to predict the rate of change in BPD traits over time, a research avenue that is in line with the need to understand competent adaptation despite adversity at multiple levels of analysis (Cicchetti & Curtis, Reference Cicchetti and Curtis2007; Cicchetti & Garmezy, Reference Cicchetti and Garmezy1993). Moreover, the current study sets the basis for testing sophisticated models that include not only genetic and environmental influences on BPD traits, but gene–environment correlations as well (Fruzzetti et al., Reference Fruzzetti, Shenk and Hoffman2005). In other words, future work might examine how, across different ages, at-risk individuals choose their environments. Work of this kind is likely to contribute substantially to knowledge of the etiology of BPD, and in turn, to methods for preventing and treating this disorder.