


INTRODUCTION
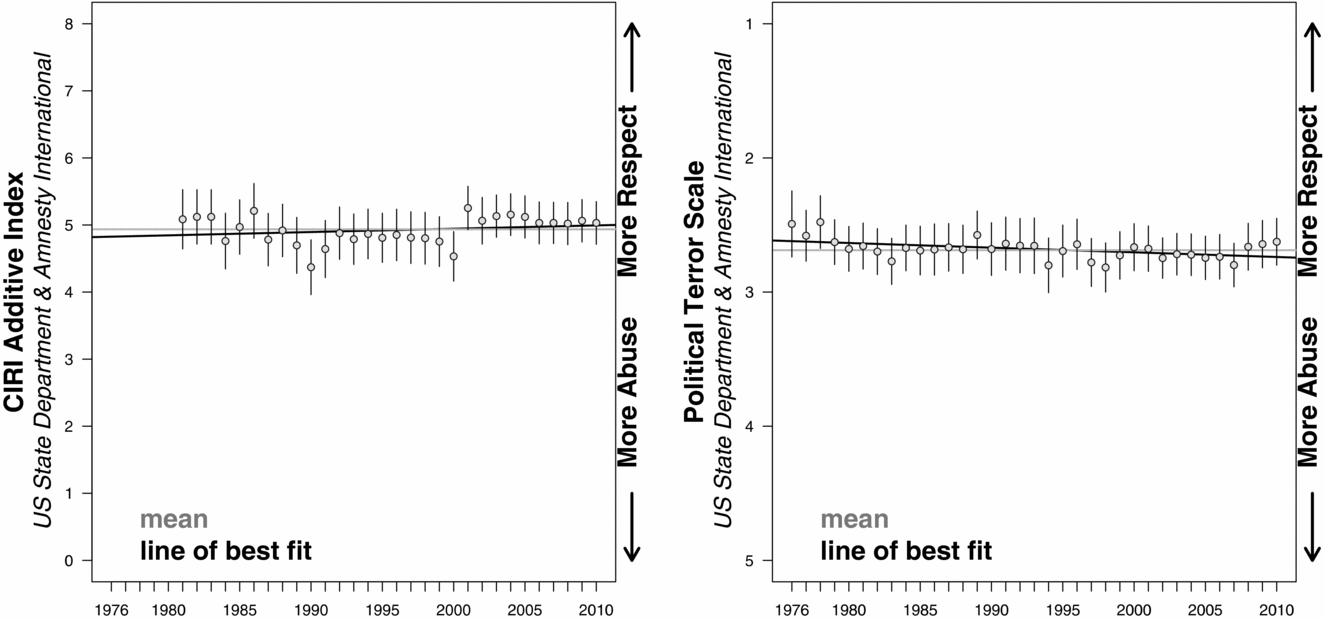
Have levels of political repression changed? “Repression” or violations of “physical integrity rights” include arrests and political imprisonment, beatings and torture, extrajudicial executions, mass killings, and disappearances, all of which are practices used by political authorities against those under their jurisdiction.Footnote 1 This question is important because current indicators of political repression imply that human rights practices have been essentially constant over the last 35 years (see Figure 1), despite the spread of human rights norms, better monitoring by private and public agencies, and the increasing prevalence of electoral democracy. While some theorists take issue with this empirical pattern and the data used to support it,Footnote 2 hundreds of studies rely on these indicators to analyze the determinants of repressionFootnote 3 and the effects of international institutions on human rights treaty compliance.Footnote 4
Yearly Mean and 95% Confidence Intervals for the Estimated Level of Repression Using the CIRI Additive Index (left), and the Political Terror Scale Index (right)
Notes: Each series is based on the human rights reports from the U.S. State Department and Amnesty International. Note that the averages for the Political Terror Scale estimates are based on two scales coded independently, one from the U.S. State Department reports and one from the Amnesty International reports. Similar figures for the individual PTS variables are displayed in Appendix D.

The data generated by several coding projects have come to dominate the quantitative study of human rights, yet contested empirical patterns have emerged regarding the overall trend in human rights respect and the relationship between the state behaviors and domestic and international institutions, such as the UN Convention Against Torture. I argue that the pattern of constant abuse found in data derived from human rights reports is not an indication of stagnating human rights practices. Instead, it reflects a systematic change in the way monitoring agencies, like Amnesty International and the U.S. State Department, encounter and interpret information about human rights abuses. Over time, this process has led to what I call a changing standard of accountability. As a consequence of this change, human rights reports have become increasingly stringent assessments of state behaviors. This change occurs because (1) government authorities have an incentive to hide the use of these policy tools and (2) observers and activists use countervailing strategies in order to reveal, understand, and ultimately change repressive practices for the better. This interaction between state actors and observers, both academic and activist, affects the production of information used by researchers to quantify repressive behaviors.Footnote 5
In this article, I present results for a new view of repression: physical integrity practices have improved over time. To support my claim, I compare an existing dynamic ordinal item response theory model (Schnakenberg and Fariss Reference Schnakenberg and Fariss2014), which I call the constant standard model, to a new extension of this model, which I call the dynamic standard model.Footnote 6 The constant standard model, like other existing models of repression (e.g., the CIRI Additive index, the Political Terror Scale index, the Hathaway torture index, and the latent variable model developed by Schnakenberg and Fariss), implicitly assumes that the standard of accountability does not change over time. The dynamic standard model relaxes this assumption. Thus, by comparing the information derived from these models, I am able to demonstrate that unobserved changes to the standard of accountability explain why average levels of repression have appeared to remain unchanged as all existing models of human rights suggest.
In sum, for the constant standard model to be more consistent with reality and for this same pattern to obtain, Amnesty International and the U.S. State Department would need to produce human rights reports consistently from year to year and the producers of the event-based data (introduced below) would need to use a less and less stringent definition of repression in the assessment of repressive events over time. This is unlikely because the event-based variables I introduce below are consistently updated as new information about the specific events becomes available. In addition to periodic updating, the producers of these event-based variables are focused on the extreme end of the repression spectrum (e.g., genocide, politicide, mass repression). Both of these features suggest that the event-based data are a valid representation of the historical record to date. The event-based data therefore act as a consistent baseline by which to compare the levels of the standards-based variables, which are produced in a specific historical context and never updated. I provide more detailed information about this point below.
The solution proposed here may be applied more broadly to data derived from other documents that might vary systematically. Issues of comparability are of increasing concern for social scientists—not just human rights scholars—interested in comparing data derived from human rights documents over time. This is because recent advances in computational throughput, digital storage, and automated content methods have made the analysis of large scale corpuses of primary source documents cost effective and increasingly popular. Though this article is not about automated content analysis per se, it is concerned with the comparison of coded documents over time. As the tools of automated content analysis become more popular and accepted in the mainstream of political science and academia generally, it will be all the more important to determine if the primary source documents selected for analysis are comparable. That is, have the documents systematically changed, thus biasing the resulting codings? If so, what are the solutions to such issues? In this article, I offer an applied solution for this problem in the context of hand-coded human rights documents.
Overall, I make several important contributions: First, I develop a theory of the standard of accountability and a new measurement model that accounts for it. Second, though the primary motivation of this article is substantive, I make two methodological contributions, as the measurement model I develop is the first in the political science literature to estimate time-varying item-difficulty cut points for some variables (i.e., the repression outcome variables).Footnote 7 More broadly, I highlight the importance of determining if primary source political texts selected for analysis are comparable. This measurement issue exists independent of whether the documents are coded by experts or using the increasingly popular automated content analysis techniques. Third, I introduce and make publicly available new unbiased country-year estimates of repression that cover the time period beginning in 1949 and ending in 2010 (n = 9267). The resulting data are the most comprehensive estimates of repression that currently exist and will help academics and policy makers begin to reassess what has become common knowledge in the human rights literature.Footnote 8 Fourth, I provide empirical evidence that human rights practices have improved over time, which contradicts the patterns found in existing data. Fifth, I illustrate the substantive importance of the results to international relations theory by showing that the relationship between human rights respect and ratification of the UN Convention Against Torture is positive, which contradicts controversial findings from existing research. Finally, I offer suggestions for how to correct for temporal bias in standard models of repression, which will allow researchers to continue to analyze the original ordered human rights variables coded directly from human rights country reports.
WHY THE STANDARD OF ACCOUNTABILITY CHANGES OVER TIME
The standard of accountability, which I define as the set of expectations that monitoring agencies use to hold states responsible for repressive actions, has not been systematically addressed because much of the data measuring repression are derived from the same primary sources (Cingranelli and Richards Reference Cingranelli and Richards1999, Reference Cingranelli and Richards2012a , Reference Cingranelli and Richards b ; Gibney, Cornett and Wood Reference Gibney, Cornett and Wood2012; Hathaway Reference Hathaway2002). The documents used to measure repression are The Country Reports on Human Rights Practices published annually by the U.S. State Department and The State of the World's Human Rights report published annually by Amnesty International. The information captured in these documents will bias assessments of repression over time if changes to these documents are not also taken into account. I argue that the standard of accountability changes over time because of the tactics used by reporting agencies to (1) gather accurate information about credible allegations of repression, (2) broaden the coverage of information gathering campaigns with the help of other NGOs, and (3) continually press governments to reform through naming and shaming campaigns, even after real reforms are implemented to reduce more egregious rights violations by those governments. In the language of research design, instrumentation bias occurs if the measurement tool used to assess a behavior changes over time (Trochim and Donnelly Reference Trochim and Donnelly2008).
The standard of accountability changes due to a combination the three tactics, described above, which I will refer to as (1) information, (2) access, and (3) classification. These tactics make up the strategies used by observers and activists interested in revealing, understanding, and ultimately changing repressive practices for the better. First, improvements in the quality and increases in the quantity of information have led to more accurate assessments of the conditions in each country over time. Second, access to countries by NGOs, like Amnesty International and Human Rights First (formerly the Lawyer's Committee for Human Rights), which seek to collect and disseminate accurate information about repression allegations and practices, has increased as these organizations grow and cooperate with one another. Third, changes in the subjective views of what constitutes a “good” human rights record held by analysts at the monitoring agencies are anchored by the status quo, which improves as the global average of rights respect improves. That is, monitoring agencies continually press governments to institute new reforms, even after real reforms are implemented to reduce more egregious rights violations like extra-judicial killings and disappearances. Thus, the set of expectations that monitoring agencies use to assess and document state behaviors changes over time as these monitors look harder for abuse, look in more places for abuse, and classify more acts as abuse. In the remainder of this section, I discuss each of these tactics in more detail and provide examples illustrating how monitoring agencies have used these tactics to respond to changes in state behaviors over time.
Human rights theorists recognize that the information used to assess government behaviors may change over time and that this could mask underlying improvements in human rights practices.Footnote 9 Keck and Sikkink (Reference Keck and Sikkink1998) attribute this change to an “information paradox.” The paradox occurs when an increase in information leads to difficulties in assessing the efficacy of advocacy campaigns over time because of the very success in collecting and aggregating accounts of repressive actions in the first place. Clark and Sikkink (Reference Clark and Sikkink2013) coin a similar term—“human rights information paradox”—to describe this issue as it relates to human rights abuses specifically. As a result of this paradox, the global human rights situation may appear to have worsened over time because there is simply an increasing amount of information with which to assess human rights practices. Moreover, Innes de Neufville (Reference Innes de Neufville1986) argues that the quality of the human rights reports produced by the U.S. State Department increased because of changes to the reporting requirements, which “altered practices and norms within the Department of State and created an arena for public evaluation of the information” (682). Improvements in the reports are corroborated by yearly critiques published by the Lawyers Committee for Human Rights and a quantitative analysis by Poe, Carey and Vazquez (Reference Poe, Carey and Vazquez2001). Thus, monitoring agencies look harder for information about human rights abuse over time.
In addition to the quality and quantity of information, access to government documentation, witnesses, victims, prison sites, and other areas are important for assessing state behaviors. Both Amnesty International and the U.S. State Department rely on reports from other NGOs that collect and disseminate information about human rights abuses within states. The number and effectiveness of these actors have increased over time, especially since the end of the Cold War.Footnote 10 Moreover, as Hill, Moore and Mukherjee (Reference Hill, Moore and Mukherjee2013) argue, increasing numbers of domestic NGOs generate more credible signals about government abuse, which are then used by Amnesty International and, by extension, the U.S. State Department in the production of human rights reports. Monitors are therefore capable of looking in more places for abuse, as their numbers increase and their collaborative networks develop and expand over time (Keck and Sikkink Reference Keck and Sikkink1998).
Monitoring agencies are also increasingly sensitive to the various kinds of ill-treatment that previously fell short of abuse but that still constitute violations of human rights. Therefore, monitors such as Amnesty International are continually pressing for additional reforms through naming and shaming campaigns, even as more egregious violations by state actors cease to occur. As Sikkink notes, these monitoring agencies and others “have expanded their focus over time from a narrow concentration on direct government responsibility for the death, disappearance, and imprisonment of political opponents to a wider range of rights, including the right of people to be free from police brutality and the excessive use of lethal force” (Reference Sikkink2011, 159). Moreover, there is specific evidence from case law of a rising standard of acceptable treatment, whereby more acts come to be classified as inhuman treatment or torture over time. For example, the European Court of Human Rights, in Selmouni v. France (1999), “consider certain acts which were classified in the past as ‘inhuman and degrading treatment’ as opposed to ‘torture’ could be classified differently in future.” That is, acts by state agents that might have previously been classified within the less severe category of ill-treatment and degrading punishment might now be classified as torture. The court states further “that the increasingly high standard being required in the area of the protection of human rights and fundamental liberties correspondingly and inevitably requires greater firmness in assessing breaches of the fundamental values of democratic societies.”Footnote 11 As this example illustrates, human rights monitors are increasingly stringent in their assessment of state behaviors precisely because they are classifying more acts as abuse over time and because they are continually pressing for additional reforms from states even as those very states limit and eventually cease the use of more egregious tactics.
Overall, the standard of accountability becomes more stringent as the U.S. State Department and Amnesty International look harder for abuse, look in more places for abuse, and classify more acts as abuse. For example, Amnesty International expanded its strategy over time as it responded to developments in the repressive behaviors used by states.Footnote 12 The initial focus of Amnesty International on political prisoners during the 1960s and 1970s precluded the reporting of extrajudicial killings that took place outside of prisons (Clark, Reference Clark2001, chap. 5). Also during the 1960s and 1970s, state agents in Guatemala frequently disappeared opposition members, yet Amnesty International did not document these policies until 1976, because these actions were not initially a policy tool of concern (Clark, Reference Clark2001, chap. 4).
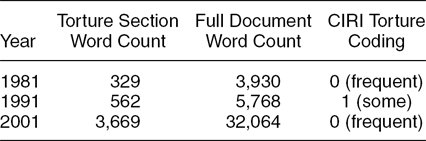
For another illustration, consider the text from the torture section contained in the State Department human rights reports on Guatemala for the years 1981, 1991, and 2001. The document as a whole and the torture section in particular both provide more detailed information in later years about the government agencies committing human rights violations and the groups experiencing those violations when compared to earlier years. The word count of the document and torture section both dramatically increase in length as displayed in Table 1 as well. Consider just one of the human rights variables discussed in more detail below: the differences between the coding of “frequent torture” on the CIRI Torture scale in 2001 relative to the less severe coding in 1991 could be a function of the amount of information and the specificity of the information included in the reports in the different years. It might also be due to increasing coverage of NGOs working in this country. It could also be because of the increasingly stringent standard (the rising standard of acceptable treatment) being required in the area of the protection of human rights and fundamental liberties or the continued pressure for reform over time, which are captured in the text of these documents. As these cases suggest, the reports published today represent a broader and more detailed view of the human rights practices than reports published in previous years (See Appendix C for examples of the text from the torture section for these country-years).Footnote 13
Changing Information Content in Three Human Rights Reports

The standard of accountability has increased due to at least one if not all of the mechanisms outlined above. Thus, as the theory suggests, the set of expectations that monitoring agencies use to hold states responsible for repressive actions changes over time. Unfortunately for scholars interested in these changes, the standard of accountability is not observable in human rights reports and is therefore impossible to directly measure. To make matters more complicated, alternative sources of information that were once highly cited are now largely forgotten and out of date (Harff and Gurr Reference Harff and Gurr1988; Rummel Reference Rummel1994a , Reference Rummel b , Reference Rummel1995; Taylor and Jodice Reference Taylor and Jodice1983). Contemporary alternatives often cover shorter periods of time (Conrad, Haglund and Moore Reference Conrad, Haglund and Moore2013; Eck and Hultman Reference Eck and Hultman2007), are not up to date (Conrad, Haglund and Moore Reference Conrad, Haglund and Moore2013; Hathaway Reference Hathaway2002), or still rely on the same standards-based human rights reports (Hathaway Reference Hathaway2002). All of these issues make the systematic comparison of results from different data sources difficult, which leaves the problem of instrumentation bias acknowledged but unaddressed in the literature. Fortunately, these issues can now be overcome thanks to the wide availability of computational tools capable of linking diverse sources of data in theoretically meaningful ways. The latent variable models I describe below are capable of (1) bringing together diverse sources of information, (2) assessing the relative quality of the information included, and (3) quantifying the certainty of the estimates of repression that are generated from the models. These models allow me to test for the influence of the standard of accountability by comparing the new model in which the probability of documenting a repressive action changes over time (dynamic standard model) to the existing model in which this probability does not change (constant standard model). In the next section, I introduce and make a theoretical distinction between standards-based data and event-based data. I then introduce the latent variable models.
STANDARDS-BASED DATA AND EVENT-BASED DATA
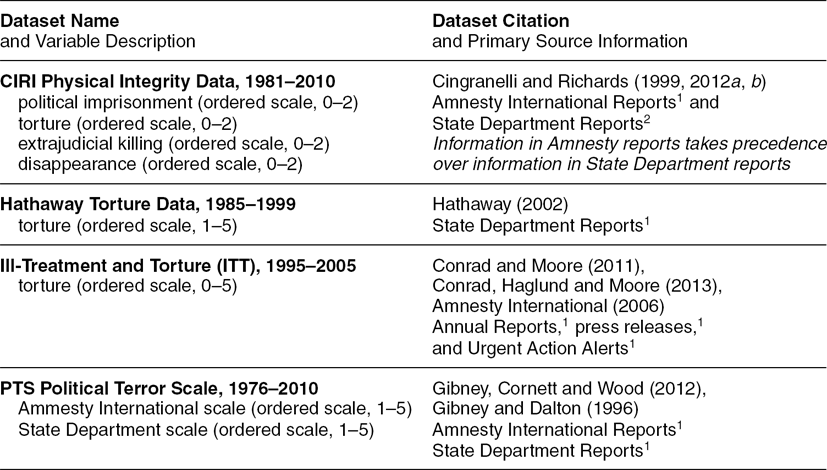
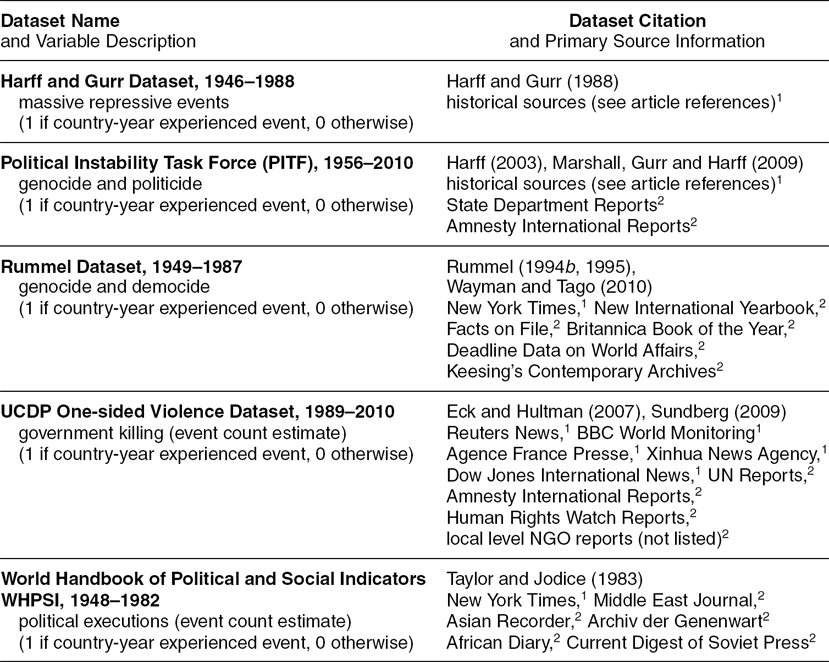
The event-based variables (sources: multiple, see Table 3) introduced in this section act as a consistent baseline by which to compare the levels of the standards-based variables (sources: Amnesty International and the U.S. State Department; see Table 2), which are produced in a specific historical context and never updated. This is because the event-based variables included in this article are consistently updated as new information about the specific events becomes available. In addition to periodic updating, the producers of these event-based variables are focused on the extreme end of the repression spectrum (e.g., genocide, politicide, mass repression). This focus makes identifying these events much easier than more difficult to observe behaviors, such as torture. Both of these features suggest that the event-based data included in this article are a valid representation of the historical record to date, which acts as a baseline for the latent variable model described in detail in the next section.
Standards-based Repression Data Sources

Notes: 1Primary source. 2Secondary source.
Event-based Repression Data Sources

Notes: 1Primary source. 2Secondary source.
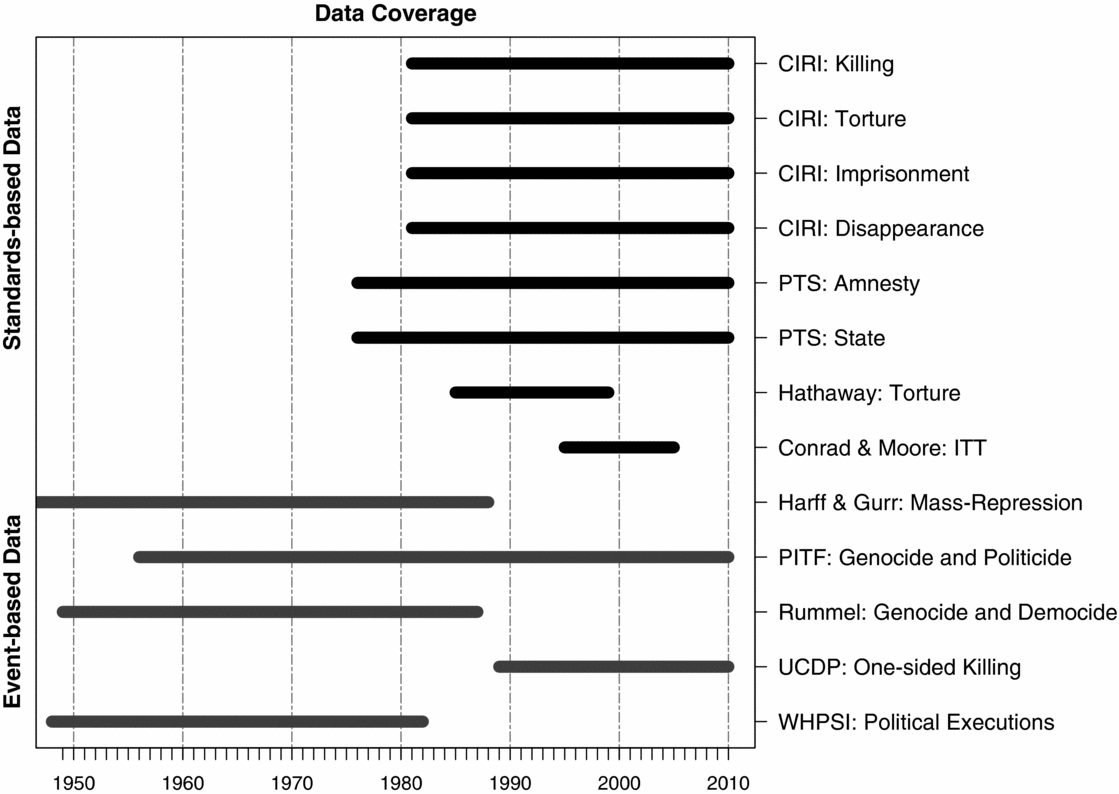
Before discussing the theoretical differences between standards-based data and event-based data in more detail, the reader should keep in mind that all of the variables included in the two competing latent variable models are the same and that they are each operationalized to capture one or more of the repressive behaviors identified in the definition of repression used throughout this article. Recall that the definition of “repression” or violations of “physical integrity rights” and sometimes called “state sanctioned terror” includes arrests and political imprisonment, beatings and torture, extrajudicial executions, mass killings, and disappearances, all of which are practices used by political authorities against those under their jurisdiction. The standards-based and event-based variable names, operationalizations, citations, and data sources are displayed in Tables 2 and 3, respectively. The temporal coverage and data type of each variable are displayed in Figure 2.

In some cases, leaders or regimes choose to attempt the complete elimination of a political group (politicide) or other group designation (genocide) (Harff Reference Harff2003; Rummel Reference Rummel1994b , Reference Rummel1995). Massive repressive events are related to the intent of genocide in the use of mass slaughters or pogroms to eliminate substantial portions of a predetermined group but are a broader category that includes a greater number of events than those captured by the genocide or politicide definition (Harff and Gurr Reference Harff and Gurr1988). Though the definitions of genocide, politicide, and massive repression are complex (see Appendix B), each variable is focused on capturing instances of large-scale aggregated mass killings of individuals which occur for a variety reasons. Thus, these variables are focused on the extreme end of the repression spectrum. Relatedly, the measurement of one-sided government killing captures instances in which more than 25 individuals (noncombatants) are killed, though this variable excludes extrajudical killings that occur inside a prison and combatant deaths that occur during civil conflicts (Eck and Hultman Reference Eck and Hultman2007). Extrajudicial killing more generally is captured by both the political execution data (Taylor and Jodice Reference Taylor and Jodice1983) and several of the variables derived from the human rights reports (Cingranelli and Richards Reference Cingranelli and Richards2012a , Reference Cingranelli and Richards b ; Gibney, Cornett and Wood Reference Gibney, Cornett and Wood2012). In addition to the events-based variables, the standards-based variables included in this article capture, individually or as part of an index, extrajudicial killing, in addition to torture, political imprisonment, and disappearances (Cingranelli and Richards Reference Cingranelli and Richards2012a , Reference Cingranelli and Richards b ; Conrad and Moore Reference Conrad and Moore2011; Conrad, Haglund and Moore Reference Conrad, Haglund and Moore2013; Gibney, Cornett and Wood Reference Gibney, Cornett and Wood2012; Hathaway Reference Hathaway2002).Footnote 14 In sum, all of these variables capture information about the use of “repression” or violations of “physical integrity rights.”
If the standard of accountability has increased over time, then comparisons of data derived from standards-based documents will be biased over time because of unaccounted for changes in the instrument (human rights documents) used to measure behavioral change (levels of repression). Temporal comparisons of categorical measures derived from the standards-based data sources are problematic because the data are based on content of reports that were prepared in a specific historical context. The reports are primary source documents that are used by analysts to derive variables on repression. The issue of temporal comparability arises because the older reports are not updated or revised even if new information about specific repressive events is obtained over time or as the goals, strategic incentives, or status quo expectations of the monitoring agencies evolve. These same issues make data derived from these reports quite useful for comparing state behaviors in the same year.
Event-based data sources contrast with the standards-based data because they are based on evidence derived from a pool of regularly augmented primary source documents. However, it is also likely that increased access to countries over time will also lead to an increase in the accuracy of the event-count data. The producers of the event-based data are aware of this process. When new information about repressive actions becomes available from NGOs, news reports, historians, or truth commissions, these scholars update their data. Moreover, information from multiple sources are used to help corroborate each datum.Footnote 15 These data therefore represent the best approximation of the historical pattern of repression for a given country at each update. For example, Rummel discusses the process by which he periodically updated the event-based information used in his articles and books.Footnote 16 Similar discussions can be found in the documentation of the other event-based data. Moreover, in addition to periodic updating, the producers of these event-based variables are focused on the extreme end of the repression spectrum. This focus makes identifying these events much easier than more difficult to observe behaviors such as torture. Both of these features suggest that the event-based data are a valid representation of historical record to date and therefore capable of acting as a baseline in the latent variable model described next.
Skepticism over the comparability of event data that counts the number of repressive events in country-year observations was one of the main reasons for the movement away from event data in cross-national human rights research.Footnote 17 Standards-based variables were developed in part because of the availability and comprehensiveness of the human rights reports but also in reaction to the use of event-based data.Footnote 18 I avoid this issue for now by focusing on event data that are binary, and therefore focused on country-year events that occur at the extreme end of the repression spectrum.Footnote 19 However, this raises another practical issue: binary event data only capture extreme levels of abuse. These data have been useful for comparing broad trends but the relative specificity of the standards-based reports is another reason for their preeminence over the event-based binary data. The standards-based data have provided analysts with more behavioral categories for comparison. The models I develop below can incorporate information from multiple sources, and quantify the uncertainty of each estimate, conditional on the availability of each variable included in the model. Missing data do not lead to a loss of country-year observations but only increase the uncertainty for the estimate of a given country-year. The models can also accommodate variables measured using different scales. Appendices A and B contain additional information about the development and coding rules for these variables.
TWO COMPETING LATENT VARIABLES MODELS OF REPRESSION
The latent variable models I develop in this article are item-response theory (IRT) models. The dynamic standard model is an extension of the DO-IRT (dynamic ordinal item response theory) model developed by Schnakenberg and Fariss (Reference Schnakenberg and Fariss2014). The constant standard model is identical to the DO-IRT model. Note that both models presented in this article are dynamic with respect to the estimated latent human rights variable. The models differ with respect to the standard of accountability. In one case the standard changes (dynamic standard model) and in one case it does not change (constant standard model).
The constant standard model in addition to all of the existing models of repression—those based on information from the annual human rights reports—implicitly assumes a constant standard of accountability over time. By comparing the estimates from the constant standard model, which makes this assumption, and the dynamic standard model, which relaxes this assumption, I am able to test the hypothesis that an increase in the standard of accountability—the probability of observing and therefore coding a repressive outcome (as modeled by time-varying item cut points)—increases over time for the repression variables derived from the human rights reports.
Schnakenberg and Fariss (Reference Schnakenberg and Fariss2014) model the latent respect for human rights for a country in a particular year as dependent on the value for the same country in the previous year. These authors demonstrate that the dynamic latent variable model fits the CIRI human rights data (Cingranelli and Richards Reference Cingranelli and Richards2012a , Reference Cingranelli and Richards b ) substantially better than a static latent variable model similar to those used in the democracy literature.Footnote 20 The latent variable models measuring democracy developed by Treier and Jackman (Reference Treier and Jackman2008) and Pemstein, Meserve and Melton (Reference Pemstein, Meserve and Melton2010) assume that the observed indicators used in the model are independent conditional on the value of the trait to be estimated, which is an overly strong assumption in the case of human rights as demonstrated by Schnakenberg and Fariss (Reference Schnakenberg and Fariss2014). And, though Armstrong (Reference Armstrong2011) relaxes this assumption by using a dynamic factor analytic model to analyze the Freedom House Indicators, he models the observed indicators as interval response variables instead of ordered categories and provides no evidence that the model performs better than any alternative parameterizations.Footnote 21 As I demonstrate below, model comparison statistics represent the best way to adjudicate between competing theories and the measurement models deduced from them.
To parameterize the changing standard of accountability, I allow the baseline probability of observing a given level of repression for a specific repression variable or item (as modeled by time-varying item cut points) to vary as a function of time in one model (dynamic standard model) and compare the resulting estimates to another in which this probability is constant (constant standard model).Footnote 22 This is accomplished by estimating time varying “item difficulty cut points” or “thresholds” for some of the items. These parameters are analogous to the intercept term in a linear model. The rest of the model parameters are similar to other latent variable models in the literature and are described in detail below. Thus, the changing standard of accountability is parameterized in the dynamic standard model by estimating the item difficulty cut points for the data sources that are derived from information contained in the annual human rights reports. Constant item difficulty cut points are estimated for the event-based data sources. This parameterization is motivated by the theoretical distinction between the standards-based data sources and event-based data sources. Again, both models are dynamic with respect to the latent variable itself.
Formally, the statistical models I compare in this article are both built on the assumption that the observed repression outcome variables for the country-year observations are each a function of the same underlying unidimensional latent variable, which represents the “true” or “latent” level of repression or respect for physical integrity rights. The goal of these models is to estimate θ it , which is the latent level of respect for physical integrity rights of country i in year t. For each model there are J indicators j = 1, . . ., J. Some of the j indicators are ordinal with varying number of levels and some of the j indicators are binary. As already noted, i = 1, . . ., N indexes cross-sectional units and t = 1, . . ., T indexes time periods. yitj is observed for each of the j = 1, . . ., J indicators displayed in Tables 2 and 3. Each indicator is either ordinal or binary and can take on Kj values. For the binary indicators, Kj = 2.
For each item, there is an “item discrimination” parameter β j and a set of Kj − 1 “item difficulty cut points” (α jk ) Kj k = 1. These parameters are analogous to a slope and intercept term in a logistic regression or the slope and cut points in an ordered logistic regression.
For the dynamic standard model, I specify the parameterization of the difficulty cut points for some of the items to vary over time such that (α tjk ) Kj k = 1. Note the t subscript here. This parameterization includes the standards-based variables from Cingranelli and Richards (Reference Cingranelli and Richards1999, Reference Cingranelli and Richards2012a , Reference Cingranelli and Richards b ), Gibney, Cornett and Wood (Reference Gibney, Cornett and Wood2012), Hathaway (Reference Hathaway2002), and Conrad, Haglund and Moore (Reference Conrad, Haglund and Moore2013). The other items retain the constant item difficulty cut-point parameterization: (α jk ) Kj k = 1, which include the binary event-based variables drawn from Harff and Gurr (Reference Harff and Gurr1988), Harff (Reference Harff2003), Rummel (Reference Rummel1994b , Reference Rummel1995), Eck and Hultman (Reference Eck and Hultman2007), Taylor and Jodice (Reference Taylor and Jodice1983).Footnote 23 Note the lack of a t subscript here. There is no t subscript on this parameter for any of the items in the constant standard model.
I assume error terms ϵ itj are independently drawn from a logistic distribution, where F(·) denotes the logistic cumulative distribution function. The probability distribution for a given response to item j in the constant standard model is therefore given by
 \begin{eqnarray}
P[y_{itj} = 1] = F(\alpha_{j1} - \theta_{it}\beta _j),
\end{eqnarray}
 \begin{eqnarray}
P[y_{itj} = k] = F(\alpha_{jk} - \theta _{it}\beta _j) - F(\alpha_{jk-1} - \theta _{it}\beta _j),
\end{eqnarray}
 \begin{eqnarray}
P[y_{itj} = K] = 1- F(\alpha_{jK-1} - \theta _{it}\beta _j).
\end{eqnarray}
For each item with constant difficulty cut points, yitj = k if α jk−1<θ it β j + ϵ itj <α jk , and by specifying α j0 = −∞ and α jKj = ∞ the probability equations (1)–(3) reduce toFootnote 24
 \begin{eqnarray}
P[y_{itj} = k] = F(\alpha_{jk} - \theta _{it}\beta _j) - F(\alpha_{jk-1} - \theta _{it}\beta _j)
\end{eqnarray}
Therefore, assuming local independence of responses across units, the constant standard's likelihood function for β, α, and θ, given the data, is
 $\mathcal {L}(\beta, \alpha, \theta | y)$
and is expressed as
 \begin{eqnarray}
\mathcal {L}&=&\prod _{i=1}^N\prod _{t=1}^T\prod _{j=1}^J\left[ F(\alpha_{jy_{itj}} - \theta _{it}\beta _j)\right.\nonumber\\
&&\left. -\, F(\alpha_{jy_{itj}-1} - \theta _{it}\beta _j)\right].
\end{eqnarray}
The first set of equations (1)– (3) and the reduced form (4) refer to the probability of observing a particular hypothetical level k. The likelihood equation (5) refers to the probability of the observed level in the data yitj . These equations are the same for the dynamic standard model except for the addition of the t subscript on some of the α parameters. As a notational convenience let vj = 1 when the j indicator is one of the standards-based variables and then vj = 0 when it is one of the event-based variables. The probability distribution for the dynamic standard model is therefore
 \begin{eqnarray}
&&P[y_{itj} = k] = \left[ F(\alpha_{tjk} - \theta _{it}\beta _j) - F(\alpha_{tjk-1} - \theta _{it}\beta _j) \right]^{(v_j)}\nonumber\\
&&\quad * \left[ F(\alpha_{jk} - \theta _{it}\beta _j) - F(\alpha_{jk-1} - \theta _{it}\beta _j) \right]^{(1-v_j)}
\end{eqnarray}
and the dynamic standard's likelihood function
 $\mathcal {L}(\beta, \alpha, \theta | y)$
is expressed as
 \begin{eqnarray}
&&\mathcal {L}= \prod _{i=1}^N\prod _{t=1}^T\prod _{j=1}^J \left[ F(\alpha_{tjy_{it\ j}} - \theta _{it}\beta _j) - F(\alpha_{tjy_{itj}-1} - \theta _{it}\beta _j)\right]^{(v_j)}\nonumber\\
&&\quad * \left[ F(\alpha_{jy_{it\ j}} - \theta _{it}\beta _j) - F(\alpha_{jy_{it\ j}-1} - \theta _{it}\beta _j)\right]^{(1-v_j)}.
\end{eqnarray}
Note that when vj = 0, the probability distribution (6) and the likelihood function (7) for the dynamic standard model are equivalent to equation (4) and (5) for the constant standard model. The model is different when vj = 1, which is when the standard of accountability changes over time.
If θ it was fully observed, then the likelihood functions above would be equivalent to independent ordinal logistic regression models. However, since this is not the case, all of the parameters of interest, the latent variable θ it , the item difficulty cut points α tjk or α jk , and the item discrimination parameters β j , must be estimated simultaneously so that the model is identified. This issue necessitates the use of Bayesian simulation.
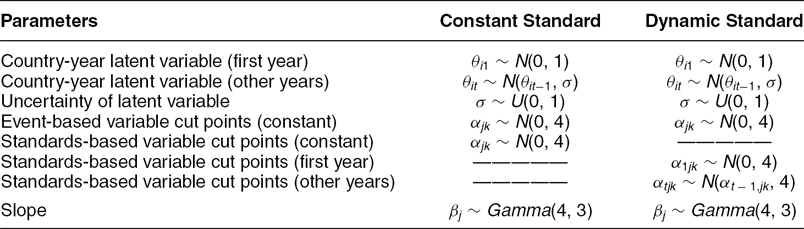
To estimate the models, I set the same priors on the latent variable estimate θ it for both of the models compared in this article such that θ it ~N(θ it−1, σ) for all i and t except when t = 1, and then is θ i1~N(0, 1). This parameterization captures an old idea in the human rights literature: repression “radiates an after-life” which decreases the need for future repressive actions by the state for a certain period of time.Footnote 25 Both of the latent variable models formalize this idea and model comparison statistics help to validate it (Schnakenberg and Fariss Reference Schnakenberg and Fariss2014).
In both models, I specify σ ~ U(0, 1) to reflect prior knowledge that the between-country variation in human rights respect will be higher on average than the average within-country variance.Footnote 26 I specify the item-discrimination parameters β j ~ Gamma(4, 3) to reflect the prior belief that all variables contribute significantly and in the same direction to the latent variable. These parameters estimate the strength of the relationship between values of the latent variable and the probability of being coded at a given level for one of the repression variables.Footnote 27
For the dynamic standard model, I relax the assumption about the item difficulty cut points made in other latent variable models and allow the α parameters to vary over time such that the priors of α tjk ~N(α t − 1,jk , 4), subject to the ordering constraint that α tj1 < α tj2 < . . . < α tjK−1 for all j. When t = 1, then α1jk ~N(0, 4). By allowing the item difficulty cut points for the standards-based variables to vary over time, I am able to assess how the probability of being coded at a specific level on the original ordered repression variables changes from year to year. The priors for the α parameters for the event-based data in the dynamic standard model are α jk ~N(0, 4), again subject to the same ordering constraint that α j1 < α j2 < . . . < α jK−1 for all j. This is the same setup for all of the α parameters in the constant standard model. Table 4 summarizes the prior distributions for the model parameters and the differences between their implementation in the dynamic standard model and the constant standard model.Footnote 28
Summary of Prior Distributions for Latent Variable and Model Level Parameter Estimates

Note: Both of these models are dynamic in the treatment of the latent variable θ.
These models, like all item-response theory models, rest on an assumption of local independence. This assumption implies that any two item responses are independent conditional on the latent variable. This means that two item responses are only related because of the fact that they are each an observable outcome of the same latent variable. There are three relevant local independence assumptions: (1) local independence of different indicators within the same country-year, (2) local independence of indicators across countries within years, and (3) local independence of indicators across years within countries. The third assumption is relaxed by incorporating temporal information into prior beliefs about the latent repression variable in both models and the changing standard of accountability in the dynamic standard model, which is captured by the item-difficulty cut points.
Some readers may question the first assumption, which states that different repressive tactics are not causally related to one another within the same country-year but are instead only related to each other through the underlying latent variable. This assumption is made implicitly in other projects that aggregate information about repression into one scale (Cingranelli and Richards Reference Cingranelli and Richards2012a , Reference Cingranelli and Richards b ; Gibney, Cornett and Wood Reference Gibney, Cornett and Wood2012; Landman and Larizza Reference Landman and Larizza2009). Jackman (Reference Jackman, Box-Steffensmeier, Brady and Collier2008) and van Schuur (Reference van Schuur2003) provide further details about this assumption. More importantly however, different repressive tactics can be related to one another in theoretically important but noncausal ways. Fariss and Schnakenberg (Reference Fariss and Schnakenberg2013), following many analysts before them,Footnote 29 assume that repression is a useful tool for a leader because it produces the benefit of mitigating potential threats to the regime. However, the emphasis of this theory is that many repressive behaviors may be complementarity policy options. A “complement” is defined if the presence of one repressive policy tool reduces the probability that the use of another policy tool is made public, decreases the threat the first policy tool was used to address, or reduces the possibility of retribution faced by a leader caught using the original policy tool.Footnote 30 This theoretical distinction emphasizes the choices of the policy maker in selecting repressive tools. It is the leader selecting to both torture and imprison political opponents because of a threat, which is the underlying cause of repression generally and the two repressive behaviors specifically. This is an important theoretical and empirical issue that human rights scholars are currently grappling with (e.g., Conrad and Demeritt Reference Conrad and Demeritt2011; Fariss and Schnakenberg Reference Fariss and Schnakenberg2013).
Recent human rights scholarship has begun to analyze both the interrelationships between the different state repressive behaviors captured by the CIRI data (e.g., Conrad and Demeritt Reference Conrad and Demeritt2011; Fariss and Schnakenberg Reference Fariss and Schnakenberg2013). However, these scholars are quick to point out that no definitive answer has been reached about the complimentarily vs. substitutability of these state behaviors. Fariss and Schnakenberg (Reference Fariss and Schnakenberg2013) only analyze the systemwide level of co-occurance between different CIRI rights. Conrad and Demeritt (Reference Conrad and Demeritt2011) focus on the extrajudical killing and political imprisonment. These authors make this choice because “disappearances are ambiguous by their very nature” and “government torture can be used in conjunction with both state-sponsored killing and political imprisonment and strikes us as a complementary violation rather than one offering the possibility of substitution” (2011, 14). The evidence presented by Conrad and Demeritt (Reference Conrad and Demeritt2011) that state leaders choose to substitute one type of abuse for the other is consistent with the assumption of the models in that the relationship is not directly causal but instead dependent on the underlying latent trait, which is affected directly by the strategy of the political authorities.
The model developed in this article can be extended to help address this issue. Such an extension with its requisite theoretical justification is outside the scope of this article. However, I have estimated alternative versions of the dynamic standard model and the constant standard model which relax the assumption of local independence of different indicators within the same country-year. The latent variables estimates produced by these models follow the same pattern as the latent variable estimates presented below. Briefly in the appendices I describe this model and several alternatives, which might be useful extensions for future research (see Appendix P). Overall, these alterations do not change the main inference of the article, that the standard of accountability has become more stringent over time and that the average level of human rights has improved once this confounding factor is taken into account.
The models developed above assume that repression is caused by choices made by the regime that lead to some “true” level of repression in each country, each year. This is the latent variable of repression, which the models attempt to estimate based on observable outcomes. The observables are each a function of the latent variable, which are captured in the content of documents produced by human rights analysts working for Amnesty International and the U.S. State Department. This content is then coded into data by research analysts (i.e., Cingranelli and Richards Reference Cingranelli and Richards1999, Reference Cingranelli and Richards2012a , Reference Cingranelli and Richards b ; Conrad, Haglund and Moore Reference Conrad, Haglund and Moore2013; Gibney, Cornett and Wood Reference Gibney, Cornett and Wood2012; Hathaway Reference Hathaway2002). If the standard of accountability that the monitors use when assessing state behaviors changes over time, then data derived from these documents will be biased. Though the standard of accountability is not directly observable, I have parameterized it in the dynamic standard model, which can be interpreted as the baseline probability of observing a given level of repression for a specific standards-based variable (as modeled by time-varying item cut points). If, for example, the probability of reporting frequent levels of torture increases from year to year, then this is evidence of the changing standard of accountability as captured by these documents. In the next section, I compare the model estimates from this new model, the dynamic standard model, to those from the constant standard model, which allows me to demonstrate that the standard of accountability has increased over time for several of the human rights measures derived from the content of the human rights reports from Amnesty International and the U.S. State Department.
RESULTS: PHYSICAL INTEGRITY PRACTICES HAVE IMPROVED
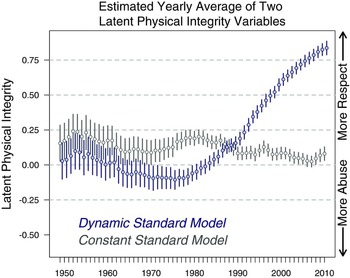
A comparison of latent variable estimates from the dynamic standard model with those from the constant standard model provide strong evidence for a new view of repression: physical integrity practices have improved over time. Unobserved changes to the standard of accountability explain why average levels of repression have appeared to remain unchanged as the constant standard model would suggest. Differences in the average level of the latent variable estimates are displayed in Figure 3. For the constant standard model to be more consistent with reality and for this same pattern to obtain, the monitoring agencies would need to produce the human rights reports consistently from year to year and the producers of the event-based data would need to use a less and less stringent definition of repression in the assessment of these events over time. Neither of these alternative behaviors are supported by the theory nor the model comparison tests, which I introduce below. First, I discuss how the standard of accountability manifests for different standards-based variables.
Yearly Mean and Credible Intervals for Latent Physical Integrity Estimates from Two Models
Notes: The dynamic standard model allows the k − 1 difficulty cut points, the baseline probability of being coded at a certain level on the original standards-based repression variables, to vary over time. The standards-based variables are those which use human rights reports from the U.S. State Department or Amnesty International as their primary information source. The model with a constant standard estimates one set of k − 1 cut points for every repression variable including the standards-based variables. The difference in the two sets of estimates suggests that an increasing standard of accountability explains why the average level of repression has remained unchanged over time when the changing standard is not taken into account. By allowing this standard to vary with time, a new picture emerges of improving physical integrity practices over time, which begins after initially deteriorating from the beginning of the period until the late 1970s. Appendix E contains selected country examples similar to this figure.

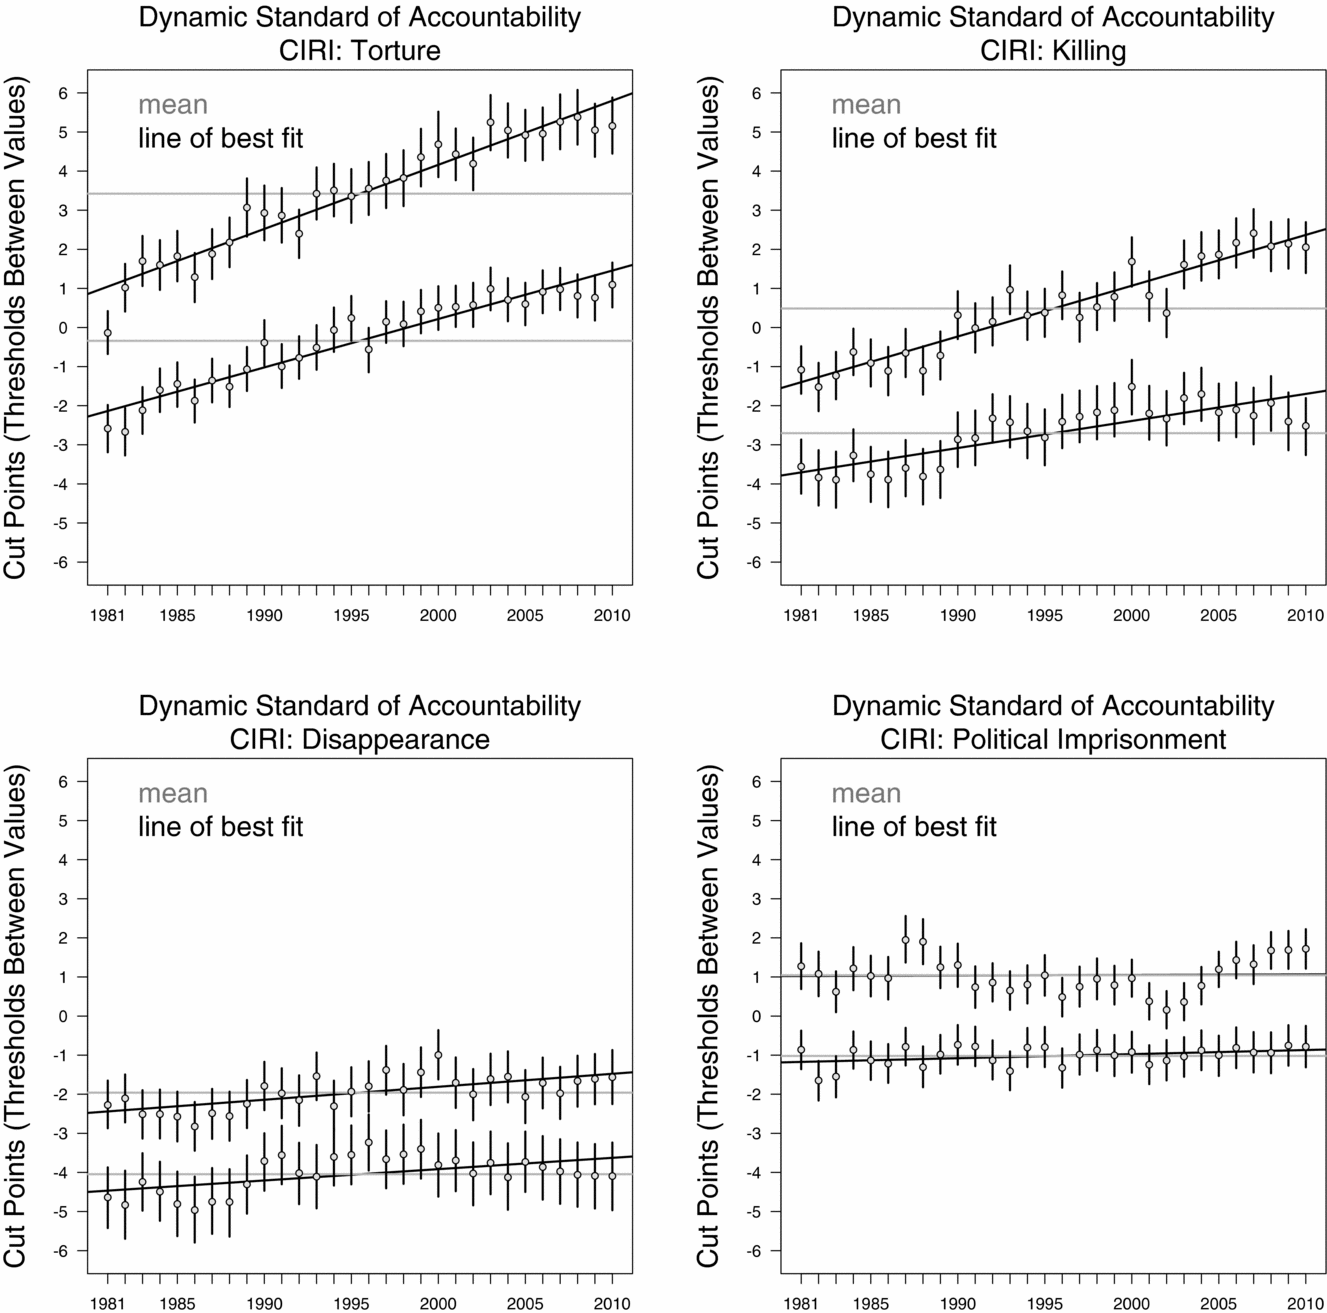
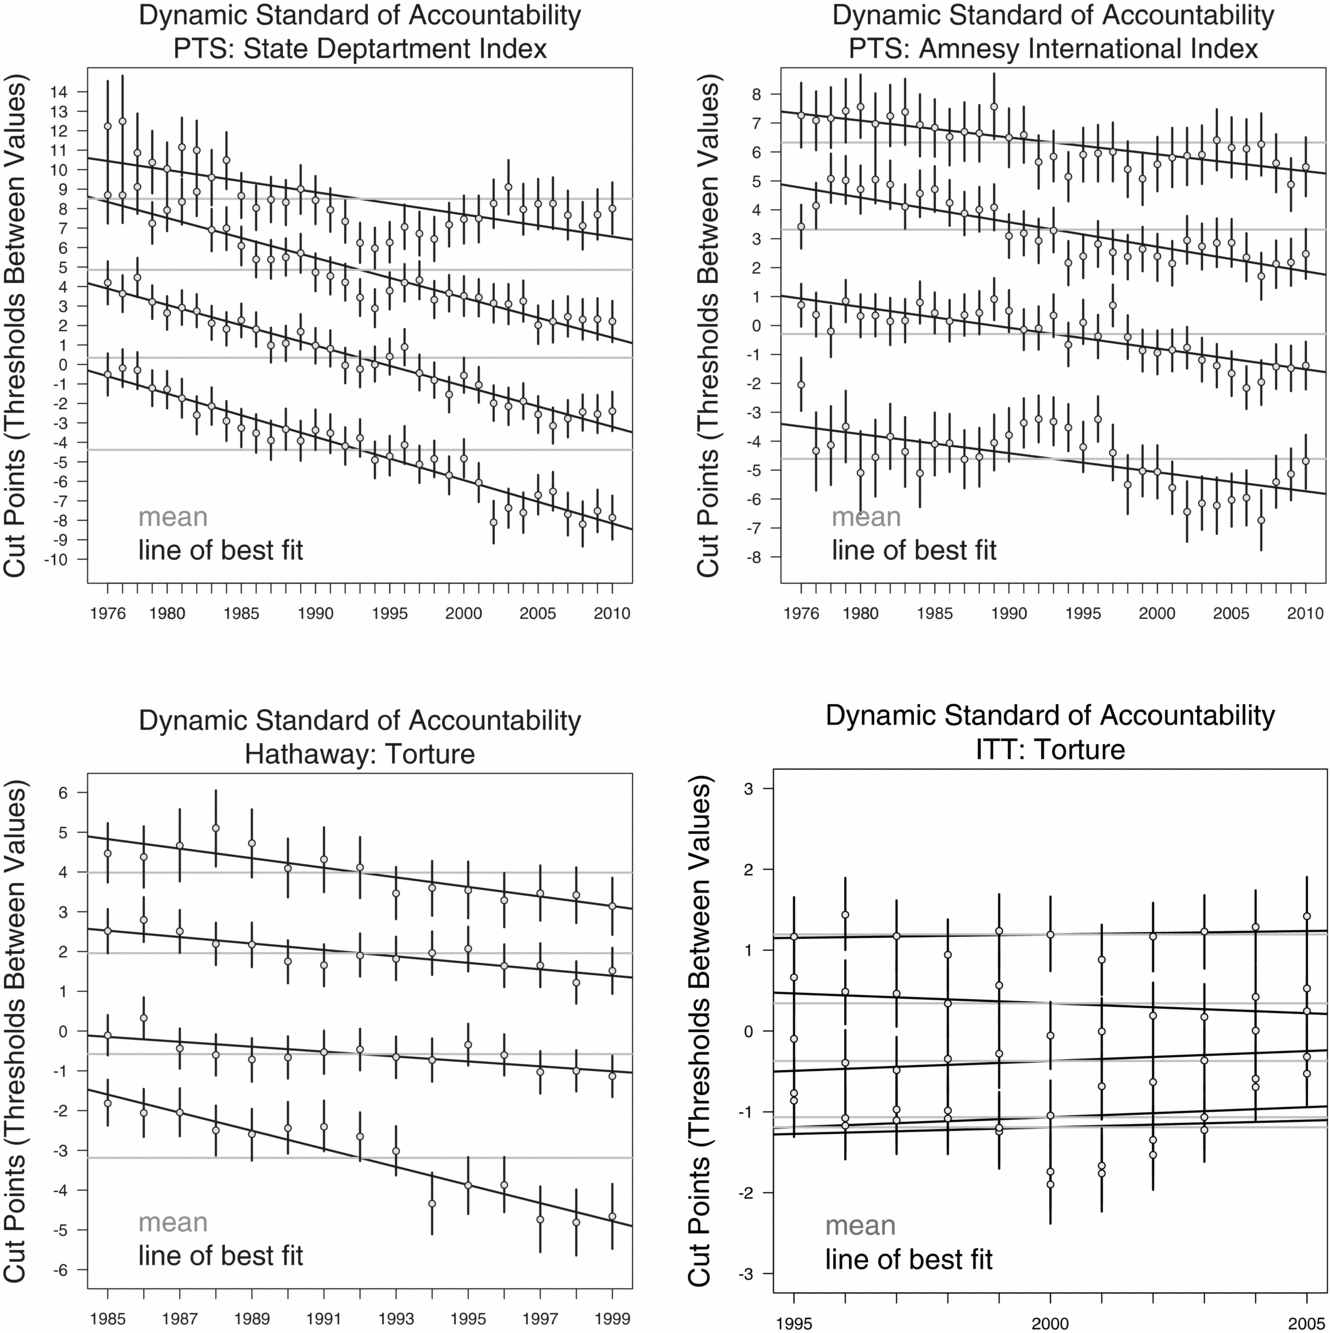
How does the changing standard of accountability influence the probability of being coded at a specific level of repression for the original standards-based variables over time? Figures 4 and 5 present panels that each display changes in the item difficulty cut points (thresholds between values for each repression variable) from the dynamic standard model for each of the eight variables derived from the standards-based reports.
Visualizing the Changing Standard of Accountability
Notes: An increase in the difficulty cut points translates directly into a statistically significant change in the probability of being classified as a 0, 1, or 2 on the original CIRI variables such that being classified as 0 (e.g., frequent abuse) becomes more likely and 2 (e.g., no abuse) becomes less likely as a function of time. There is no statistical relationship between the Political Prison variable and time. See Appendix G for the posterior estimates of these parameters and Appendix F for additional figures.

Visualizing the Changing Standard of Accountability
Notes: A decrease in the difficulty cut points translates directly into a statistically significant change in the probability of being classified as a 1, 2, 3, 4, or 5 on the original political terror scale variables and the hathaway torture variable such that being classified as 1 (e.g., little to no abuse) becomes less likely and 5 (e.g., widespread abuse) becomes more likely as a function of time. There is no statistical relationship between the ITT variable and time. See Appendix G for the posterior estimates of these parameters and Appendix F for additional figures.

The changing standard of accountability does not affect all of the standards-based variables equally. Countries are far more likely to be coded for frequent torture based on the CIRI coding rules today than countries with similar levels of repression just a few decades ago. As the standard of accountability becomes more stringent, monitoring agencies look harder for torture, look in more places for torture, and classify more acts as torture. All of the standards-based variables, with the exception of the CIRI imprisonment variable and the ITT torture variable, are affected by changes to the standard of accountability (see Appendices F and G for more details). However, as Clark (Reference Clark2001) discusses in her book, the original mission of Amnesty International was to document political imprisonment. The documentation of other human rights abuses came about as states responded to the advocacy efforts of Amnesty and other human rights NGOs. It is not surprising that the human rights reports consistently document political imprisonment over time. The lack of temporal change in the probability of coding levels of torture in the ITT data may reflect the relatively short period of coverage (1995–2005) or differences between Amnesty's Urgent Action Reports, upon which these data are based, and the annual report used by the other data sources. Additional analysis is necessary on this specific issue.
The lack of results for these two variables is actually quite encouraging for the plausibility of the dynamic standard model. In effect, these two variables, in addition to the five event-based indicators, acted as a baseline for the model so that both the overall level of repression and the changing standard of accountability could be estimated simultaneously. These results help to alleviate concern that the changing standard of accountability is an unwanted artifact rather than a theoretically specified feature of the model.
MODEL COMPARISONS
Deviance Information Criteria (DIC)
Next, I test to see if the dynamic standard model is a better approximation of reality relative to the alternative constant standard model. Readers should keep in mind that all existing models of repression—those based on information from the annual human rights reports—make the same assumption about a constant standard of accountability over time. Models of repression include all of the existing human rights scales that aggregate information about different rights abuses from the annual human rights reports (Cingranelli and Richards Reference Cingranelli and Richards1999, Reference Cingranelli and Richards2012a , Reference Cingranelli and Richards b ; Gibney, Cornett and Wood Reference Gibney, Cornett and Wood2012; Hathaway Reference Hathaway2002) in addition to the latent variable model recently developed by Schnakenberg and Fariss (Reference Schnakenberg and Fariss2014) and the factor analytic method used by Landman and Larizza (Reference Landman and Larizza2009). By comparing the estimates from the two latent variable models, I am able to test the hypothesis that an increase in the standard of accountability—the probability of observing and therefore coding a repressive outcome (as modeled by time-varying item cut points)—increases over time for the repression variables derived from the human rights reports.
For these tests, I first present a statistic called the Deviance Information Criterion or DIC for short. This statistic provides information analogous to a penalized likelihood ratio test or simply the comparison of adjusted-R 2 statistics from competing models. For the DIC statistic, relatively smaller values indicate that a model explains more of the variance in outcome variables compared to an alternative model. Recall that the outcome variables in both models are the original repression variables. The DIC statistic is a method useful for comparing the models in this article because it penalizes more complex models so that the more parsimonious one is favored, all else equal (Gelman et al. Reference Gelman, Carlin, Stern and Rubin2003). Thus a smaller DIC for this more complex model is strong evidence of its improvement over alternatives. Spiegelhalter, Best, Carlin and Van Der Linde (Reference Spiegelhalter, Best, Carlin and Van Der Linde2002) proposed that differences of greater than 5 or 10 provide substantial evidence in favor of the model with the lower DIC. The DIC statistics are 53,706 for the dynamic standard model and 55,027 for the constant standard model, which is a difference of several thousand in favor of the dynamic standard model. See Appendix I for more details.
Posterior Predictive Checks
Posterior predictive checks assess the quality of the model by direct comparison of model predictions from competing models. These tests compare predictions of the original repression variables generated by the two competing latent variable models. The results suggest that the dynamic standard model again outperforms its competitor.
At every iteration of the MCMC algorithm, the model parameters can be used to make a prediction of each of the observed repression variables included in the model. The better fitting model should on average generate predictions closer to the observed values of these variables when compared to similar predictions from a competing model (Gelman and Hill Reference Gelman and Hill2007).
Formally, for each draw from the posterior distribution, I predict each of the j items yit j
for every country-year observation for which yit j
is observed. Since there are thousands of draws from the posterior distribution, indexed by d, I am able to calculate the sum of squared differences of observed yit j
and the posterior predicted values
 $\hat{y}^{dynamic}_{it\ jd}$
from the dynamic standard model using the equation:
 $S^{dynamic}_{it\ j}= \sum _{d} (y_{it\ j} - \hat{y}^{dynamic}_{it\ jd})^{2}$
and likewise for the posterior predicted values
 $\hat{y}^{constant}_{it\ jd}$
from the constant standard model:
 $S^{constant}_{it\ j}= \sum _{d} (y_{it\ j} - \hat{y}^{constant}_{it\ jd})^{2}$
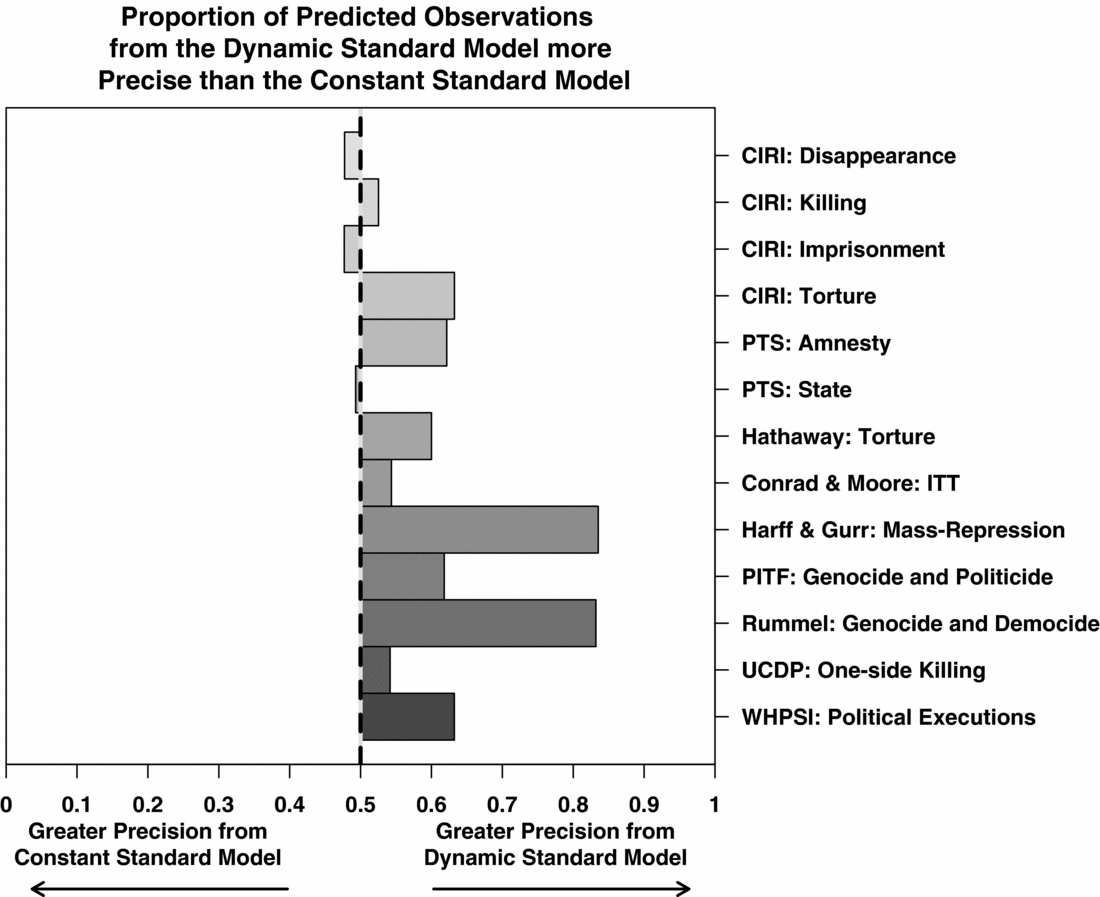
I have aggregated the sum of squared difference for each observation to compare values for the same observation from the competing models. These comparisons are captured in Figure 6 and a table in Appendix J. Figure 6 displays the proportion of observations such that: Sdynamic it j ≤ Sconstant it j , or in words, when the sum of squared difference from the dynamic standard model is ≤ to the constant standard model for each country-year observation for all of the repression variables. Proportions closer to 1 indicate that the dynamic standard model outperforms the constant standard model at predicting the original repression variables. Proportions closer to 0 indicate the opposite. Proportions at 0.50 indicate that both models are predicting the items with about the same amount of error relative to each other. The proportions increase as the number of observations with a smaller sum of squared deviation increases when comparing the dynamic standard model and the constant standard model. The dynamic standard model does a much better job of predicting the original repression variables, especially the event-based variables. The improvement occurs for the event-based variables because of the temporal bias that exists in the standards-based variables. The constant standard model does not account for this bias, which reduces its ability to accurately predict the values of the event-based data not affected by the changing standard of accountability.
Proportion of Predicted Observations
Notes: Proportions closer to 1 indicate that the dynamic standard model outperforms the constant standard model at predicting the original repression variables. Proportions closer to 0 indicate the opposite. Proportions at 0.50 indicate that both models are predicting the items with about the same amount of error relative to each other. The dynamic standard model does a much better job of predicting the original repression variables, especially the event-based variables.

THE CHANGING STANDARD OF ACCOUNTABILITY AND TREATY COMPLIANCE: THE CASE OF THE CONVENTION AGAINST TORTURE
In this section, I illustrate the substantive importance of the changing standard of accountability for international relations theory by showing that ratification of the UN Convention Against Torture and respect for physical integrity rights is positive. This result contradicts negative findings from existing research. As the standard of accountability has increased over time, empirical associations with human rights data derived from standards-based documents and other variables will be biased if changes in the human rights documents are not accounted for. This is especially true for variables that measure the existence of institutions that are correlated with time, such as whether or not the UN Convention Against Torture has been ratified.
In the international relations literature there are two opposing viewpoints on treaty effectiveness. Authors such as Morrow (Reference Morrow2007), Simmons (Reference Simmons2000), and Simmons and Hopkins (Reference Simmons and Hopkins2005) argue that treaty ratification constrains actors to modify their behaviors by creating costs for noncompliance. An alternative viewpoint is that countries only ratify a treaty if they would have complied even in the absence of the treaty. Thus, treaties have no effect on the behavior codified within the treaty, such as the level of cooperation (e.g., Downs, Rocke and Barsoom Reference Downs, Rocke and Barsoom1996; Von Stein Reference Von Stein2005), or ratification of certain human rights treaties (e.g., Hafner-Burton and Ron Reference Hafner-Burton and Ron2009; Hafner-Burton and Tsutsui Reference Hafner-Burton and Tsutsui2005, Reference Hafner-Burton and Tsutsui2007; Hathaway Reference Hathaway2002). The results presented here call into question this second viewpoint. The new latent variable model I have developed provides a way to improve the measurement of respect for human rights specifically and potentially the measurement of other forms of compliance in international relations more generally.
For this demonstration, I compare linear model coefficients using the latent variable from the constant standard model and the latent variable from the dynamic standard model. That is, I estimate two linear regression equations using the latent physical integrity variables from the two measurement models as dependent variables. I regress these variables on a binary variable that measures whether or not a country has ratified the Convention Against Torture in a given year. I also include several control variables.Footnote 31
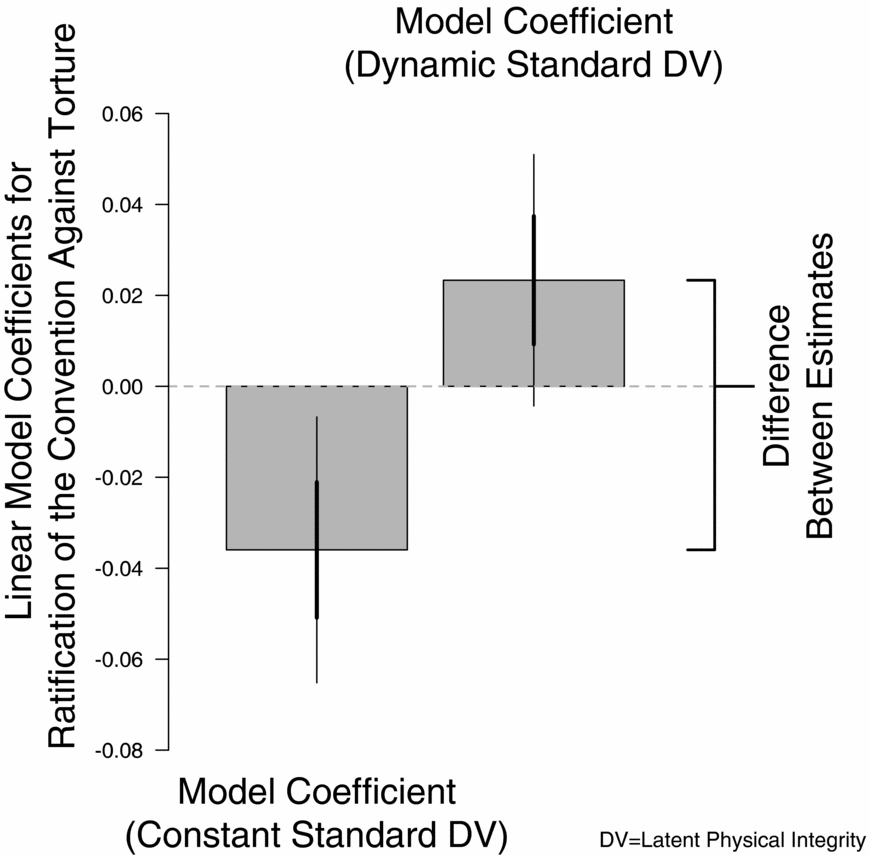
New inferences are obtained by simply replacing the dependent variable derived from the constant standard model with the one from the dynamic standard model. Figure 7 plots the coefficient for CAT ratification from the linear models, which each use one of the two latent physical integrity dependent variables. The linear regression using the dependent variable from the constant standard model generates a negative coefficient, which corroborates results from earlier work. Comparison with the regression coefficient from the model using the dependent variable from the dynamic standard model is striking. The coefficient has flipped signs and is statistically significant when compared with 0 (p < 0.098) and the alternative coefficient (p < 0.004). These results suggest that human rights protectors are more likely to ratify the treaty, that the treaty may in fact have some causal effect on human rights protection, or possibly both. Overall, these findings suggest that the treaty is not merely cover for human rights abusers.
Estimated Coefficient for CAT (the UN Convention Against Torture) Ratification From the Linear Model using the Dependent Latent Physical Integrity Variables From the Constant Standard Model and the Dynamic Standard Model, Respectively.
Notes: The thick lines represent 1 ± the standard error of the coefficient. The thin lines represent 2 ± the standard error of the coefficient. The difference between the coefficients is statistically significant (p < 0.004).

Note that these models are not designed for causal inference and, though a variety of selection issues are known to exist when using this specification,Footnote 32 the results from this type of model have spawned a large literature because of the counterintuitive, negative correlation found between ratification and respect for human rights (e.g., Hafner-Burton and Tsutsui Reference Hafner-Burton and Tsutsui2005, Reference Hafner-Burton and Tsutsui2007; Hathaway Reference Hathaway2002; Hollyer and Rosendorff Reference Hollyer and Rosendorff2011; Vreeland Reference Vreeland2008). Though this finding has been criticized (Clark and Sikkink Reference Clark and Sikkink2013; Goodman and Jinks Reference Goodman and Jinks2003), it is generally taken for granted in the literature (Hafner-Burton and Ron Reference Hafner-Burton and Ron2009). Importantly, this new result calls into question a key assumption about state behavior made in several recent articles (e.g., Hollyer and Rosendorff Reference Hollyer and Rosendorff2011; Vreeland Reference Vreeland2008) and a book (Hafner-Burton Reference Hafner-Burton2013) on human rights treaty compliance. The conclusions and policy recommendations from this work should be re-evaluated.
Overall, much additional testing is needed to probe the differences between existing empirical relationships and the new relationships generated using the latent physical integrity estimates derived from the dynamic standard model. A recent manuscript uses cross-validation and random forest methods to determine the predictive power of the covariates identified as important in the literature on repression using the existing CIRI and PTS physical integrity scales and the new estimates presented in this article (Hill and Jones Reference Hill and Jones2014). The cross-validation and random forest methods corroborate the result that ratification of the Convention Against Torture is positively associated with the new latent variable generated from the dynamic standard model presented in this article. The authors also find that measures of civil war (e.g., Davenport Reference Davenport2007a ; Poe and Tate Reference Poe and Tate1994), “youth bulges” (Nordås and Davenport Reference Nordås and Davenport2013), domestic legal institutions (Keith, Tate and Poe Reference Keith, Tate and Poe2009), and state reliance on natural resource rents (Demeritt and Young Reference Demeritt and Young2013), are good predictors of levels of repression. I also examine the relationship between the new latent variable estimates and other human rights treaties in another article (Fariss Reference Fariss2014). The new model introduced in this article might also be useful for analyzing other issue areas of treaty compliance in international relations, which I leave for future research.
SUGGESTIONS FOR FUTURE RESEARCH
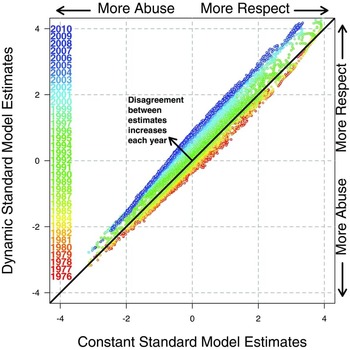
If changes in the standard of accountability are not addressed in applied research, then biased inferences are the likely result. Bias occurs because of the increasing number of years for which standards-based variables exist. Figure 8 captures the increasing disagreement between the latent variables estimates generated from the dynamic standard model and those from the constant standard model (1976–2010). The disagreement occurs because the dynamic standard model incorporates the changing standard of accountability, whereas the constant standard model, which is biased, does not.
Relationship Between the Latent Variable Estimates Generated From the Dynamic Standard Model on the y Axis and the Estimates Generated From the Constant Standard Model on the x Axis (1976–2010)
Notes: The 45-degree line represents perfect agreement between the two estimates. Disagreement between the two sets of estimates increases as a function of time.

The first option for analysts is to simply use the new latent repression estimates from the dynamic standard model. As I demonstrated in Section 7, a linear model can easily accommodate the latent repression estimates as the dependent variable. Schnakenberg and Fariss (Reference Schnakenberg and Fariss2014) describe a method for incorporating the uncertainty associated with the latent variable estimates in this model or any other model that uses the lagged latent variable estimates as an independent variable (see Appendix L for more details).
Analysts interested in any of the standards-based variables as a dependent variable should consider using a hierarchical model with the lagged estimate of repression generated from the dynamic standard model in addition to specifying time-varying cut points. This specification will help to avoid generating biased inferences. Through Bayesian simulations, programs such as JAGS, Stan, or WinBUGS can handle this more difficult to estimate model when using the standards-based variables. The alternative to this approach still involves specifying a time variable (a count of the number of years in the study beginning with the first year) interacted with the lagged repression estimates generated in this article. In the appendix (Appendices L and M), I describe the specification for models using the original standards-based variables. I also present a procedure for modeling the original binary event data. These analyses also generate additional predictive validity statistics that corroborate the results from the DIC statistics and posterior predictive checks presented above.
CONCLUSION
By allowing the standard of accountability to vary with time, a new picture emerges of improving physical integrity practices over time. Recall the research question I posed at the beginning of this article: Have levels of political repression changed? To answer this question, I argued that the use of repressive policy tools appears unchanged over time because of the unaccounted-for standard of accountability that monitoring agencies use to hold states responsible for abuse. I theorized that the standard of accountability, which I defined as a set of expectations or norms that state behaviors are measured against, changed over time because of the combination of three tactics that make up the strategies of monitoring agencies. The standard of accountability changes over time because of the incentives of reporting agencies to (1) gather more accurate information about credible allegations of repression, (2) broaden the coverage of information gathering campaigns with the help of other NGOs, and (3) continually press governments to reform through naming and shaming campaigns, even after real reforms are implemented to reduce more egregious rights violations by those governments. The theory allowed me to parameterize a measurement model of repression that incorporates the changing standard of accountability by allowing the baseline probability of observing a given level of repression (as modeled by time-varying item cut points) for a specific repression variable to vary over time.
The results provide strong evidence that the changing standard of accountability affects the content of the human rights country reports produced annually by Amnesty International and the U.S. State Department. The answer to the question posed above is that respect for physical integrity rights has improved after all. Put another way, the level of repression has decreased in the system over time, but this change was masked in the text of the human rights documents by a confounding factor—the standard or accountability—for which researchers had not previously accounted. By accounting for this additional factor, a new picture of global repression emerges in which conditions actually improve over the period of study (1949–2010), since hitting a low point in the mid-1970s. This result has implications for the research agenda of many human rights scholars and should not be left unaddressed in future research. In Section 7, I demonstrated that the empirical relationship between the new physical integrity variable and ratification of the UN Convention Against Torture is positive, which contradicts results from earlier research. Any variable that changes over time and leads to a difference in the level of protection for human rights, like ratification of the Convention Against Torture, is working against temporal bias in the existing human rights scales. Thus, the new estimates I have generated as part of this project can be used to reassess other empirical relationships in the quantitative human rights literature. In addition to using the new latent variable estimates, it is also possible to reassess relationships with the existing scales. Briefly in Section 8 and in more detail in the appendices, I discussed several methods for addressing the issue of temporal bias in empirical research that uses existing standards-based data and event-based data as dependent variables. The new latent variable model I have developed provides a way to improve the measurement of respect for human rights specifically and potentially the measurement of other forms of treaty compliance or other behaviors in international relations more generally.
To close, I wish to emphasize that the theory and model developed in this article are not meant as a critique of any of the standards-based variables themselves. As should be clear, the theory and the model derived from it are focused solely on the changing standard of accountability, which influences the strategies used by monitoring agencies to generate primary source documents. It is these monitoring agencies and the documents they produce which are under investigation. In fact, this article is itself a testament to the quality of the standards-based data because each of the variables included in the analysis reliably and accurately operationalizes content from these reports.Footnote 33
However, as Clark and Sikkink (Reference Clark and Sikkink2013) discuss, the coding scheme itself may not accurately capture all of the variation in human rights levels that exist in reality. However, I believe that the coding of the reports is reliable. By reliable, I mean that the CIRI, PTS, and Hathaway variables consistently represent the content of the human rights reports published annually by the U.S. State Department and Amnesty International, conditional on the scheme itself. The argument made by Clark and Sikkink is about the validity of the CIRI and PTS variables relative to the theoretical construct of interest, which is respect for human rights. If the PTS or CIRI teams were only interested in accurately measuring the content of the reports then there would be little reason for Clark and Sikkink to question the validity of the resulting variables. The validity comes into questions when researchers make the conceptual leap from variables which are based on coded reports to the assumption that the values of those variables represent the “true” level of human rights abuse. This is an important theoretical distinction which is often overlooked when the PTS, CIRI, and Hathaway variables are presented as measurements of abuse instead of reported abuse.
What this theoretical distinction means in practice however, is that the coded values from the human rights reports come to mean something different when the reports change systematically. This is especially the case for over time changes, which the dynamic standard model addresses. My analysis, though not about content analysis per se, is focused on the comparison of coded human rights documents that have systematically changed over time. However, as the tools of automated content analysis become more popular and accepted in political science, it will be all the more important to determine if the documents selected for analysis are comparable. That is, have the documents systematically changed thus biasing the resulting codings? If so, what are the solutions to such issues? In this article, I have offered an applied solution for this problem in the context of hand-coded human rights documents, which in principle could be adapted to other corpuses of expert-coded or machine-coded text. One promising area of research in which the dynamic standard model could prove of direct use is in the measurement of democracy. Though much has been written about the measurement of democracy (e.g., Gleditsch and Ward Reference Gleditsch and Ward1997; Przeworski, Alvarez, Cheibub and Limongi Reference Przeworski, Alvarez, Cheibub and Limongi2000), there are few systemic assessments of how the conceptualization and therefore the values of the Polity scale or alternative latent democracy variables (e.g., Pemstein, Meserve and Melton Reference Pemstein, Meserve and Melton2010; Treier and Jackman Reference Treier and Jackman2008) change over time.



Comments
No Comments have been published for this article.