Implications
It is important to quantify the contributions made to genetic diversity in order to implement management strategies in conservation programmes, which select those subpopulations that increase or maintain it. Developing a reliable method to account for these contributions would be of great interest to breeders. Changes in the structure of subpopulations within a non-endangered breed population could produce a decrease of genetic diversity and the appearance of the depression effects of inbreeding.
The present methodology has been applied to the Spanish Purebred horse to illustrate the example of a balanced representation of colour. The results showed that a progressive increase in minority coats would be profitable for the genetic diversity of this breed.
Introduction
It is important to quantify the contributions made to diversity in order to implement management strategies in programmes for the conservation of genetic variability. This task can be approached mainly from two types of material, pedigree and molecular information. A number of methods have been developed to take advantage of molecular information, including phylogenetic-like approaches, such as that of Weitzman (Reference Weitzman1992), Thaon d’Arnoldi et al. (Reference Thaon d’Arnoldi, Foulley and Ollivier1998) or those focusing on the maximization of gene diversity (Eding and Meuwissen, Reference Eding and Meuwissen2001; Ollivier and Foulley, Reference Ollivier and Foulley2005 and Reference Ollivier and Foulley2008) or the average number of alleles per locus (Petit et al., Reference Petit, El Mousadik and Pons1998; Foulley and Ollivier, Reference Foulley and Ollivier2006). The coancestry-based method can be easily adapted to genealogical information (Caballero and Toro, Reference Caballero and Toro2002). This method is based on the comparison of between- and within-subpopulation mean coancestries. It is important to note that genealogical mean coancestries are influenced by subpopulation size. Self-coancestries have a major influence on mean coancestry values when subpopulation sizes are small. When the subpopulation sizes are not proportional to the existing metapopulation size, the results may be biased.
In horses, coat colours have been studied as a marker of population structure (Druml et al., Reference Druml, Baumung and Sölkner2009). Different breeding objectives associated to coat colour preferences may give some degree of population subdivision (Stachurska and Brodacki, Reference Stachurska and Brodacki2000; Stachurska et al., Reference Stachurska, Brodacki and Klimorowska2005; Glazewska and Gralak, Reference Glazewska and Gralak2006).
One example of how to study the genetic importance of subpopulations can be found in the coat colours of the Spanish Purebred horse (SPB). From 1970 onwards, the chestnut coat was the only colour not allowed in the SPB studbook, whereas grey and bay coats were the most popular. However, some diluted chestnut coats (Bowling, Reference Bowling2000; Mariat et al., Reference Mariat, Taourit and Guerin2003) like isabella and cremello were permitted, although not encouraged. From the late 1990s onwards, however, breeders’ preferences changed and the SPB became a multi-coloured breed, with an increasing number of individuals with previously less frequent coats, particularly black. The SPB population has been characterized as a genetically homogeneous population because of the small number of founder individuals influencing its pedigree (Valera et al., Reference Valera, Molina, Gutiérrez, Gómez and Goyache2005). If individuals with minority coats such as roan, white or the diluted ones (buckskin, palomino or isabella) are a result of particular founder contributions, the increase in frequency of these coats in the population may balance the founder contributions at the breed level and, therefore, maintain the genetic stock.
The aim of this work was to assess the genetic contribution of each subpopulation using pedigree information, applying a modification of the methodology proposed by Caballero and Toro (Reference Caballero and Toro2002), allowing for adjustments for size the within-subpopulation mean coancestries. It was carried out by measuring the existing genetic composition of different SPB subpopulations defined according to coat colour. A hypothetical scenario in which coat frequencies are balanced at the population level was also discussed.
Material and methods
Data
The data registered in the stud-book of the Spanish Purebred Horse from its foundation in 1970 up until 2006 were analysed. The data included 166 264 (80 355 male and 85 909 female) registered horses.
Individuals born in the past 11 years, 1996 to 2006, were selected as a reference population near the last generation interval in this breed (Valera et al., Reference Valera, Molina, Gutiérrez, Gómez and Goyache2005). This reference population included 66% of the overall population (109 760 animals, 53 771 males and 55 989 females).
Individuals in the reference population were grouped in eight subpopulations according to coat colour: grey, with 64 836 (59.07%) in the reference population; bay, with 33 633 (30.64%) individuals; black, with 9414 (8.58%); chestnut, with 1243 (1.13%); buckskin, with 433 (0.39%); roan, with 107 (0.10%); white, with 37 (0.03%) and Isabella, with 57 (0.05%) individuals.
Note that this data set must not be understood as a structured population in the strict sense – however, it can be useful to illustrate the methodology, we are consciously turning a blind eye to the known fact that coat colours are defined by a few genes of major effect (Lamoreux et al., Reference Lamoreux, Wakamatsu and Ito2001; Gutiérrez-Gil et al., Reference Gutiérrez-Gil, Wiener and Williams2007). In practice, breeders tend to mate individuals within those of the same coat colour group, which implies a stronger relation than just a random one. What makes this population particularly interesting and useful is the wide variety in the sizes of the groups of individuals, which makes applying the methodology here particularly suitable. It should be noted that the methodology used is ultimately based on the differences found ‘between’ and ‘within’ subpopulation coancestry coefficients. It is, therefore, applicable whenever these differences exist. Nevertheless, we have used the terminology for subpopulations throughout the text, as the methodology is even more useful in real subdivision scenarios. Thus, in the whole pedigree, 92% of the animals registered in the SPB stud-book had either grey (107 145 animals, 64%) or bay (46 321 animals, 28%) coat colours. The remaining 8% had minority coat colours, with roughly 6% black (10 481 animals) coated and nearly 1% chestnut (1593 animals). Coat colours such as buckskin (468), roan (130), white (65) or isabella (61) accounted for the remaining 1% of the horses. To ensure the existence of some degree of subdivision caused by colours and that, as a consequence, the results were not of stochastic nature, an analysis was carried out, randomly assigning coats to individuals and keeping the sizes of subpopulations. This analysis revealed that coancestry within subgroups decreased by 7.6%.
Pedigree analyses
Given that coancestry depends on the pedigree depth, the number of equivalence to discrete generations (t) for each individual in a pedigree was computed as the sum of ( )n, where n is the number of generations separating the individual from each known ancestor (Boichard et al., Reference Boichard, Maignel and Verrier1997).
The genetic variability was characterized at the subpopulation level by computing the total effective number of founders (f e) and ancestors (f a; Boichard et al., Reference Boichard, Maignel and Verrier1997). Parameter f e is the number of founders that, contributing in a balanced way, would explain the wide genetic diversity of the subpopulation. Parameter f a refers to those individuals, whose contribution to the reference subpopulation is higher than that of their ascendants, thus making allowances for bottlenecks in the pedigree.
The number of founder genome equivalents (f g), defined as the number of founders that would be expected to produce the same genetic diversity as in the population under study if the founders were equally represented and no loss of alleles occurred (Ballou and Lacy, Reference Ballou and Lacy1995), was also computed for each subpopulation as the inverse of twice the average coancestry of the individuals included in the reference subpopulation. Parameter f g allows us to identify whether coat colour subpopulations have similar origins or not, thus complementing the information provided by the analysis of founders and ancestors.
The genetic contributions of subpopulations were assessed following Caballero and Toro (Reference Caballero and Toro2002). The average coancestry (Malécot, Reference Malécot1948) ( ) over an entire metapopulation of NT individuals, consisting of n subpopulations, subpopulation i with Ni breeding individuals, is:
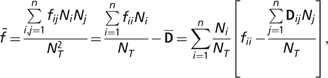
where fij is the average pairwise coancestry between individuals of subpopulations i and j, including all Ni × Nj pairs; fii is the average pairwise coancestry within subpopulation i and Dij is Nei’s minimum genetic distance (Nei, Reference Nei1989) between subpopulations i and j computed as Dij = [(fii + fjj)/2]−fij. From the formula above, it can be noted that  is dependent on the within-subpopulation coancestry (first term in brackets) and the average distance among subpopulations (second term in brackets). A proportional contribution of each subpopulation to the global coancestry was obtained following Caballero and Toro (Reference Caballero and Toro2002) as the average coancestry of the subpopulation minus its average distance from all the others.
Adjusting coancestry for subpopulation size
The within-subpopulation coancestry is affected by the subpopulation size as self-coancestries will carry more weight when the population is small. This is because the average self-coancestry of a subpopulation i is  where Fi is the average inbreeding of the subpopulation. Thus, in the extreme case of a group of non-inbred and non-related individuals, the off-diagonal will be null and only Nj self-coancestries with value
 will be included in the mean, which is finally equal to
 Obviously, as the subpopulation size decreases, the within-subpopulation coancestry increases. Note that, if the relative representation of individuals in the file does not match the actual population, the conclusions can be misleading.
Assuming that both the mean inbreeding value of individuals and the mean pairwise coancestry between different individuals in a subpopulation are constant, the within-subpopulation coancestry can be adjusted to extrapolate the desired size of M as:

where si is the mean self-coancestry in the subpopulation, and  and
 the respective within-subpopulation coancestry means for the original sample size and the desired sample size of M.
Contribution analyses
The genetic contribution of each subpopulation to the total diversity was assessed as the loss or gain of genetic diversity in the whole population after removal of this subpopulation from the data set (Caballero and Toro, Reference Caballero and Toro2002). After quantifying the genetic contributions of each subpopulation with their original sizes, the analyses were recomputed after standardizing subpopulation sizes to: (a) 100 animals (simulating an endangered breed; FAO, 1998); and (b) 13 710 individuals, which is the mean subpopulation size in our data set. This will allow us to infer the importance of the subpopulations defined using coat colour in hypothetical scenarios in which coat colour frequencies are balanced.
All the analyses were performed using the program ENDOG (current version v4.8) (Gutiérrez and Goyache, Reference Gutiérrez and Goyache2005).
Results
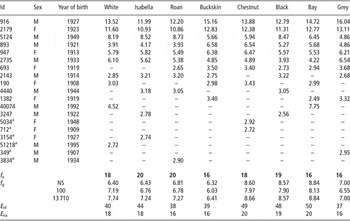
Table 1 shows the contributions of the main ancestors to the reference subpopulations.
List of the 10 ancestors (in decreasing order) contributing the most (in percentage) to each Spanish Purebred horse subpopulation defined by coat colour. Genealogical parameters for each subpopulation are also given

f a = Effective number of ancestors; f g = Founder genome equivalent obtained with and without size standardization of the reference subpopulation; E nf = Effective number of founders for each subpopulation; E na = Effective number of ancestors for each subpopulation.
NS = Non-standardized.
aAncestors that contribute to only one subpopulation.
The six most important ancestors are common to all the subpopulations and explain approximately 50% of each subpopulation. There are also six ancestors that only contribute, minimally, to one subpopulation, with a maximum of 2.95%, in which the grey coat can be seen. Most of the contribution (approximately 25%) is made by only two ancestors, which are grey and bay, respectively. The white subpopulation has contributions from two ancestors that do not contribute to the other subpopulations, whereas buckskin, black and roan share all their ancestors with the other subpopulations.
In addition to the main ancestors, the entire subpopulations shared a similar effective number of ancestors. Chestnut and bay subpopulations showed the greatest value (20), whereas buckskin, roan and grey subpopulations showed the smallest (16). The concentration of the origin of genes was also assessed by calculating the founder genome equivalents (Ballou and Lacy, Reference Ballou and Lacy1995; Table 1) before and after subpopulation size adjustment. The results were similar among subpopulations, with the bay coat colour having the highest number of founders both in standardized and non-standardized populations (higher than eight). The buckskin subpopulation had the lowest f g values (always lower than 6.5). Correlation between the f g values obtained after subpopulation size adjustment was 1.0 and correlation between the f g values obtained after adjustment and the original ones was 0.86. No pattern was found between the size of the subpopulation and the founder genome equivalents, and the standardization did not substantially modify the conclusions extracted from this parameter.
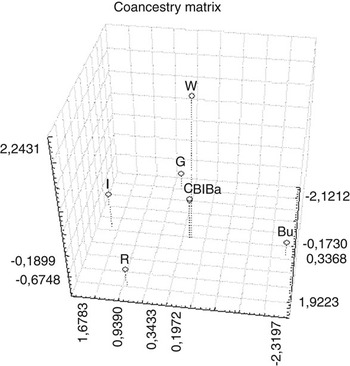
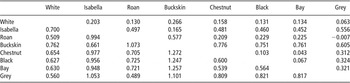
Between-SPB subpopulations coancestries are illustrated in Figure 1. Unlike the between-subpopulations coancestry matrix (which is not affected by the self-coancestry values), the distances matrices changed with size standardization to 100 or 13 710 individuals. The coancestry matrix showed a close genetic relationship between the bay and chestnut subpopulations, on the one hand, and to a lesser extent, between the roan and white subpopulations, on the other. Before adjustment, the Nei’s minimum distance showed a lack of differentiation among subpopulations (particularly among the black, chestnut and bay subpopulations) except for isabella and white individuals, whereas after adjustment, white, roan and grey individuals appeared less differentiated.
Three-dimensional scaling plot showing differences summarizing the information provided by coancestry matrix. W = White; I = Isabella; R = Roan; Bu = Buckskin; C = Chestnut; Bl = Black; Ba = Bay; G = Grey.

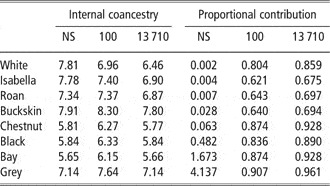
The results in Table 4 showed that, before standardization, the proportional contribution of each subpopulation to the global metapopulation was low in all cases, and was directly related to the size of the subpopulation. The grey subpopulation contributes the most (4.137%) to the overall coancestry when the population size is not standardized. However, these values decreased dramatically when the population size was standardized, either to a smaller size or to the mean. The relative importance of minority coats such as buckskin, isabella or roan increased with standardization. The correlation between internal coancestries and proportional contributions after standardization was 1.0. However, the correlations between unadjusted and adjusted values were 0.859 and 0.566, for internal coancestries and proportional contributions, respectively, showing that size standardization has a greater influence on subpopulation differentiations than coancestries.
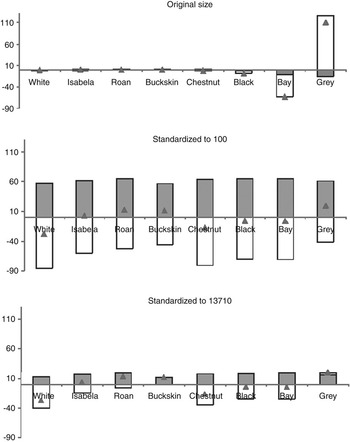
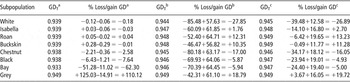
The contributions of the defined subpopulations to the overall genetic diversity before and after adjustment for population size are illustrated in Figure 2. Negative values indicate that a loss of diversity will occur when the subpopulation is removed and, thus, it would be preferred for conservation purposes. When the original subpopulation sizes were considered, only bay and grey subpopulations made noticeable contributions to diversity. However, after standardization: (a) the contributions of both the grey and bay subpopulations were clarified, although both the direction and importance continued to be basically the same; (b) the white and chestnut subpopulations increased their importance so as to maintain the overall genetic diversity in SPB; and (c) the isabella and roan subpopulations did not play an important role in maintaining the overall diversity. The global genetic diversity increased when subpopulation sizes were standardized either to 100 or to the reference subpopulation mean. The results of quantification of the genetic contributions to the whole population showed that some minority coats, such as buckskin and isabella, which if excluded, made the genetic diversity decrease in the whole SPB population, changed their sign from negative to positive after standardization. However, the white coat increased in importance with standardized sizes as the genetic diversity changed from very low loss (0.18%) to losses of 27.85% for 100 individuals and 26.89% for 13 710 animals.
Bar graph indicating contributions to internal diversity (in white), between-subpopulation differentiation (in grey) and total contribution (in triangle).

Discussion
Quantifying the genetic importance of populations or subpopulations within a metapopulation is an important research topic that has been dealt with at length in the past. This task can be approached mainly from two types of material: pedigree and molecular information. One of the most commonly used methodologies, that of Caballero and Toro (Reference Caballero and Toro2002), can be used from both types of information by means of the manipulation of the coancestry matrix, regardless of the source of its molecular or genealogical coancestry. When using this methodology, the comparison of between- and within-coancestry coefficients is the key information used to establish conclusions. The greater the differences in these coancestries, the greater the distances between the subpopulations and thus, the greater the subdivision. However, within the subpopulation, mean coancestry is heavily influenced by the size of the subpopulation, particularly if the different subpopulations are highly unbalanced, and this can lead to biased conclusions if such an unbalance is not a reflection of the real situation.
We have illustrated here how derived conclusions can be extremely different when considering different subpopulation sizes under the same mean pairwise coancestry and individual inbreeding coefficients. To do this, we have first discussed the genetic structure of the SPB breed regarding coat colours and then, studied the effect of balancing their representation on the SPB breed, as this representation can be defined simply by the evolution of market, tastes and fashion. Obviously, the separation produced as a consequence of the coat colour differentiation is slight and no great losses of genetic variability will be expected as a consequence of removing one of the colour groups. However, the imbalance in the subpopulation sizes has been useful to illustrate the methodology.
Although coat colour is a selection criteria that has been demonstrated not to influence horse performance (Stachurska et al., Reference Stachurska, Pieta, Lojek and Szulowska2007), it is well known that market preferences exert a great influence on animal breeding (Arnason and Van Vleck, Reference Arnason and Van Vleck2000; Druml et al., Reference Druml, Baumung and Sölkner2009). Buyers’ preferences have been studied in other horse breeds such as Hanoverian, where rare coats are seen as favourites, because of the sparse offer on the market (Icken et al., Reference Icken, Bennewitz and Kalm2007).
Nowadays, in spite of the substantially different census, it is difficult to distinguish the different coat colour subpopulations from their genetic composition; when looking at their main influencing ancestors, they often share a common origin (Table 1). In addition, the conserved genetic stock is extremely similar, as shown by the effective number of founders (37 to 50), ancestors (16 to 20) and founder genome equivalents (6.3 to 8.8, Table 1). Valera et al. (Reference Valera, Molina, Gutiérrez, Gómez and Goyache2005) found two major ancestors with a contribution of 15.8% and 12.6% in the SPB population, which agrees with the results about ancestors shown in Table 1. The Lipizzan horse, closely related to the SPB, had only one ancestor contributing most of the genetic variability of the breed, with 10.74% (Zechner et al., Reference Zechner, Sölkner, Bodo, Druml, Baumung, Achmann, Marti, Habe and Brem2002). To summarize this information, no relationship seems to exist between the size of the subpopulation and the parameters measuring their genetic variability. Thus, chestnut, bay and black subpopulations, of intermediate size, showed the highest genetic diversity, whereas buckskin, roan, of smaller size, and grey subpopulations, the biggest, showed the lowest genetic diversity, although all of them seem to share the same genetic origin. Regarding a possible different genetic origin for these coats, in order to establish a new colour in this breed, it is essential to cross a SPB horse with an outside breed with the new coat colour (and, therefore, the new gene), but recessive alleles related to some coats could be already present at a low frequency in the population. As commonly reported in other horse breeds with long or short pedigrees, a small number of individuals may have a great influence on the breed (Zechner et al., Reference Zechner, Sölkner, Bodo, Druml, Baumung, Achmann, Marti, Habe and Brem2002; Glazewska and Jezierski, Reference Glazewska and Jezierski2004). In our study, this fact could have been highlighted by coat colours such as white, chestnut or isabella, and also with the majority grey colour. These coats showed ancestors that contributed to only one of these subpopulations, but with a maximum contribution of only 2.95% for the last coat. The coat colours of these marginal ancestors were among the most frequent in the SPB population and they were also different from those, which define their subpopulation, which makes them unlikely to be responsible for their introduction. Therefore, in our study, it is not clear that uncommon colour genes necessarily came from foreign breeds – on the contrary, it seems that the alleles concerned were already there. SPB coat colour variety (Abad, Reference Abad2006; Agüera, Reference Agüera2008) was dramatically reduced because of the absorption of the population by the mainly grey Carthusian strain (Valera et al., Reference Valera, Molina, Gutiérrez, Gómez and Goyache2005). The close relation among coat groups suggests that recently some breeders have been trying to produce previously unpopular colours again. This will probably lead, in some genes, to a kind of endogamy justifying the present approach by the island model (Wright, Reference Wright1931).
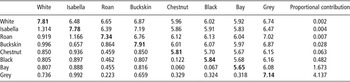
Nei’s minimum genetic distances and coancestry values are the standard instruments used to investigate population sub-division and to divide genetic variation into between- and within-population components (Eding and Bennewitz, Reference Eding and Bennewitz2007); they may also be used as indicators for the relative importance of a given cluster within a population, as subdivision is one of the major factors leading to greater increases in inbreeding than those expected according to population size (Fernández et al., Reference Fernández, Toro and Caballero2008).Our results showed that there is no well differentiated subpopulation based on coat colour in this breed. This reinforces the idea that the nature of these subpopulations, as coat colours are closely related according to their genetic basis, would justify the small genetic distances shown between them. With regard to Nei’s minimum distances, the smaller the related subpopulations are, the bigger this value, and the higher their coancestry values (Table 2).
Average coancestry among subpopulations (%, diagonal and above), Nei’s minimum distance between subpopulations (%, below diagonal), and proportional contribution of each subpopulation to the global coancestry (last column) in the reference subpopulation

One way to measure the influence of one subpopulation over the others in a given population is to ascertain the genetic contribution to diversity if one or several of these subpopulations (coat colours, in this study) are removed from the whole population (Caballero and Toro, Reference Caballero and Toro2002). Given that, this methodology is based in the differences found in ‘between’ and ‘within’ subpopulation coancestry coefficients, and the magnitude of the loss or gain in genetic variability of each group will depend on these differences. The coat-based subpopulations analysed here have many genetic connections, and therefore the results show that no great changes are found when one of them is removed. In spite of the fact that all the subpopulations seem to be very similar, the analyses carried out without standardization revealed that the main coat in the SPB (grey) was not necessary for the conservation of the population as its proportional contribution to global coancestry was 2000× greater than that for the white coat (Table 2), and removing it would increase the global diversity by 1%, whereas all the others except roan would lead to a reduction in the global genetic diversity (Table 5, column 3). Oldenbroek (Reference Oldenbroek2007) stated that the genetic diversity within a farm animal species is the resource by which required changes in the phenotypic characteristics of a population are made and, obviously, the more numerous ones contribute less to global diversity.
In order to highlight the genetic structure of the SPB population by means of coat colour subpopulations with size standardizations, parameters such as coancestries, Nei’s minimum distances and F-statistics were also calculated after size standardization (Table 3).
Nei’s minimum distance between subpopulations (%) after standardization to common size of 100 individuals (below diagonal) and 13 710 individuals (above diagonal)

The results showed that the differences in coat colour contributions increased the relative importance of minority coats such as buckskin, isabella or roan when the subpopulations were standardized to a small size (100 animals), or to the mean size (13 710 animals).
The conclusions we can draw from the proportional contribution to the coancestry are still more dramatic, balancing the results and changing the order of importance of the colours (Table 4): the grey coat is still the least important when the effect of size has been removed. The most important differences between subpopulations seem to be largely because of the differences in population sizes, since unbalanced population sizes seem to provide the major source of changes in the quantification of diversity from pedigrees. The adjustment for population sizes means that both the number of highly related SPB individuals eliminated from the data set and the number of lesser related individuals remaining is lower, thus lessening the impact on the overall diversity of the analysed population. In other words, the grey coat is the easiest to remove, but mainly because of its enormous relative size.
Average coancestry within subpopulations and proportional contribution to the global coancestry of all reference subpopulations with their original size (NS) and after standardization to 100 and 13 710 individuals

NS=non-standardized.
Taking into account the analyses after standardization as well, Table 5 shows that the white coat should definitely not be eliminated from the population, as this would generate the greatest losses in genetic diversity when the subpopulation size was standardized, from −0.18% before standardization, either to 100 individuals (−27.85) or to the mean (−26.89).
Contribution to genetic diversity (loss(−)/gain(+)) in % and ×100) in the reference SPB population when each subpopulation (coat) was removed, with their original size and standardized for 100 and 13 710 individuals

SPB = Spanish Purebred horse.
GDT = Total genetic diversity.
aWithout standardization.
bSubpopulations standardized to 100 individuals.
cSubpopulations standardized to 13 710 individuals.
Coats such as buckskin, isabella or roan would produce a gain in diversity if they were removed when standardized, which is not always the case before standardization (Figure 2).
Total genetic diversity (GDT) is defined as a set of differences between species, breeds within species, and individuals within breeds expressed as a consequence of differences in their DNA (Eding and Bennewitz, Reference Eding and Bennewitz2007). It shows the global diversity when each of the subpopulations are removed, because the sustainable management of genetic resources is concerned with managing the diversity that is present today (Woolliams and Toro, Reference Woolliams and Toro2007). The results showed that this parameter increased by 12.5% when the subpopulations were size standardized. These results show that a progressive increase in minority coats would be profitable for the genetic diversity of this breed.
As expected, the number of founder genome equivalents (f g) decreased (Table 1) because of the size standardization when the new size was lower than the original, as a consequence of the greater weight of self-coancestries in the mean within-subpopulation coancestry. This was the case of the majority coats (grey, black, bay and chestnut). In contrast, this parameter tended to increase in minority coats (roan, buckskin, isabella). In addition, as the weight of self-coancestries is the same in standardized analyses, this parameter allows us to compare the genetic diversity of subpopulations based on the remaining original genetic stock. Therefore, the grey subpopulation showed the second lowest values after buckskin, whereas bay, black and chestnut were those with the highest values.
We have shown that the conclusions obtained from mean subpopulation coancestries are highly dependent on the unbalanced subpopulation size, as a consequence of the weight of self-coancestries. If this information reflects the real situation, the conclusions would be fair, that is, a group of individuals would be genetically important either because they are not closely related or because they are scarce, or both. If this is not the case, we have shown how the mean coancestries can be fitted to a desired size. This methodology can also be useful when predicting the genetic importance of the subpopulations if their relative size evolves, as we have done here to illustrate the example of a balanced representation of colour coats in the SPB population. Furthermore, this methodology could be helpful in the management of other animal species using conservation programmes with subdivided populations, as it could quantify the contribution of these subpopulations to genetic diversity in the whole population, using pedigree information. Zoo animals, for example, present common captive-breeding programmes for conservation that seek to minimize the harmful genetic changes potentially arising from loss of genetic diversity, inbreeding depression and the accumulation of new, mildly deleterious mutations (Ford, Reference Ford2002). However, using different management techniques and allowing for mating between animals located in different zoos could lead to the subdivision of the population (Wang and Caballero, Reference Wang and Caballero1999). Quantifying the contributions to genetic diversity of these subpopulations could be carried out by management strategies in the conservation programmes of these species.
Acknowledgements
The authors wish to thank the National Association of Spanish Purebred Horse Breeders (ANCCE) for providing the genealogical database of this breed for this study.