I. INTRODUCTION
Copper alloys and Cu-based products are improving our life in various fields. Reference Gong, Kim, Ren, Zeng and Zhu1–Reference Chen, Shen, Luo, Wang, Li and Zhang4 Due to their high strength and high electrical conductivity, copper alloys have been applied as materials for lead frame, conductors, and railway contacting wires, et al. Reference Li, Pan, Zhao, Xiao and Wang5–Reference Kim and Lee8 The main binary system of copper alloys with high strength and high conductivity are Cu–Fe, Reference Kim, Han, Euh and Lim9 Cu–Ag, Reference Lee and Hong10 Cu–Nb, Reference Sun11 Cu–Cr Reference Zhang, Volinsky, Tran and Chai12–Reference Zhou, Gao, Li, Zhang and Wang15 alloys and so on, in which the Cu–Cr system alloy is widely applied and served as a typical age-strengthening alloy. Reference Mu, Guo and Tang16,Reference Pang, Xia, Wang and Li17 The high strength and high conductivity of Cu–Cr alloy are attributed to the precipitation strengthening that the solute Cr atoms are precipitated from the Cu matrix during aging treatment. Reference Chbihi, Sauvage and Blavette18 An addition of Zr element in the Cu–Cr alloy can further enhance the comprehensive properties, especially for the softening resistance at medium temperature. Liu et al. Reference Liu, Zhang, Ge, Wang and Cui19 reported a Cu–Cr–Zr alloy with a tensile strength of 530 MPa and an electrical conductivity of 78% IACS (International Annealed Copper Standard). Su et al. Reference Su, Dong, Liu, Li and Kang20 prepared a Cu–Cr–Zr alloy with a good combination of strength and conductivity (165 HV, 79.2% IACS) after thermomechanical treatments. Nonvacuum melting is a conventional important casting method to produce big-scale ingots; however, it is difficult to add zirconium element into the copper alloy because the zirconium element will be oxidized fleetly and react with lining materials in the melting process, which results in undesired inhomogeneous ingots. Reference Mu, Tang, Guo, Tang and Peng21 So it is necessary to explore other alloying elements to enhance the properties of the Cu–Cr alloy. Ag has the similar electronic structure and crystal structure with those of Cu, indicating a small loss of electrical conductivity, while the addition of Ag into the Cu matrix has a significant solid solution strengthening effect Reference Islamgaliev, Sitdikov, Nesterov and Pankaratov22 and precipitation strengthening effect. Reference Sakai and Scheneider-Muntau23 In this work, a Cu–0.13Cr–0.074Ag alloy has been designed, the microstructure evolution and physical properties were investigated, and strengthening mechanisms will be discussed.
II. EXPERIMENTAL PROCEDURE
A Cu–Cr–Ag alloy was melted using a medium frequency induction furnace. Pre-specified quantities of Cu blocks and Cu-10% wt. Cr master alloy were first melted, and then requiring quantities of silver strips were added to molten bath. After stirring and stilling for 10 min, the melt was gravity cast in an iron mold with a size of 30 × 60 × 200 mm. The chemical composition of the as-cast alloy was Cu–0.13Cr–0.074 Ag (wt%) tested by ICP-AES (Inductively Coupled Plasma-Atomic Emission Spectrometer, Baird Corp., Bedford, Massachusetts). After surface defects were removed, the ingot was solution treated (ST) at 870 °C for 1 h, and subsequently cold rolled (CR) with 60% reduction in thickness at room temperature, and the followed strips were aged at temperatures of 440, 480, and 520 °C for different time. Finally, the aged strips were cold deformed by 50% and 70%, respectively.
The micro-hardness of samples was measured using an HV-5 typical hard meter with a 500 g load and a 15 s holding time. Each sample was tested seven times and the average values of the measurement data were taken. Electrical conductivity tests were carried out in a digital QJ36S DC resistance tester with a double-arm electrical bridge device, the dimension of the samples was 60 mm (length) × 3 mm (width) × 2 mm (thickness). Flat-shoulder tensile test specimens were cut from the aging treated trips, which have a gage length of 50 mm, a thickness of 2 mm, and a width of 12 mm. Tensile tests were measured on an MTS 8810 tester machine with a constant strain rate of 2 mm/min at room temperature. The scanning transmission electron microscopy (STEM) images and the Z-contrast images [high angle annular dark field (HADDF) images] were captured using a Titan G2 60-300 transmission electron microscope (TEM; FEI Company, Hillsboro, Oregon). The distribution of the alloying element was analyzed by three-dimensional atom probe (3DAP) on the LEAP 4000 HP electron spectrometer (CAMECA Co., Gennevilliers, France), applying a laser power of 0.5 nJ, a laser pulse repetition rate of 200 kHz, a DC voltage in a range from 5 to 10 kV and a specimen temperature of 40 K. TEM samples were cut into discs of 3 mm diameter and polished to a thickness of 0.07 mm prior, then performed in a dual-jet electropolishing technique using the solution of 25% nitric acid and 75% methanol at about −30 °C. 3DAP samples were prepared from a ø3 mm disc after TEM observation by micro-sampling method using focused ion beam (FIB) milling, a probed volume of 32 × 32 × 94 nm was analyzed on a super saturation solution sample treated with cold rolling by 60%, and aging at 480 °C for 2 h. Fracture observations were carried out on a Sirion 200 scanning electron microscope (SEM; FEI Company).
III. RESULTS
A. Properties measurement
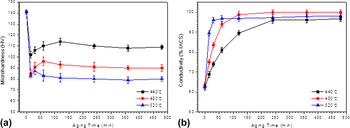
The Cu–0.13Cr–0.074Ag alloy had been solution treated at 870 °C for 1 h, cold rolled by 60%, then aged at 440 °C, 480 °C, and 520 °C for different time respectively, and variations of the micro-hardness and electrical conductivity of the studied alloy are shown in Fig. 1. Figure 1(a) showed the variation of the micro-hardness of the sample treated with different processes. For the cold-rolled sample, the hardness was 140 HV, and the value decreased at the early stage of aging process, which was attributed to the small increment of the precipitation hardening and the large decrement of annealing softening during aging. With the increase of aging time, precipitation hardening played a dominant role, the hardness of the alloy increased gradually and approached a peak value, the peak values of hardness of the alloy were 114 HV as aged at 440 °C for 120 min, 96 HV as aged at 480 °C for 60 min, and 87 HV as aged at 520 °C for 30 min, the corresponding electrical conductivities were 89.4% IACS, 93.9% IACS, and 95.8% IACS, respectively, as shown in Fig. 1(b).
Variation of micro-hardness and conductivity of the sample treated with the different aging process. (a) Microhardness; (b) conductivity.

After solution treatment at 870 °C for 1 h, cold rolling by 60%, aging at 480 °C for 2 h then cold rolling by 50%, 70%, respectively, the mechanical properties and electrical conductivity were listed in Table I. The results showed that the alloy had a high micro-hardness and conductivity after the second cold rolling by 70%. The micro-hardness was 140 HV and conductivity was 94.5% IACS, and the tensile strength approached 473 MPa.
Mechanical properties and electrical conductivity of the designed alloy with the second cold rolling.

B. TEM observation
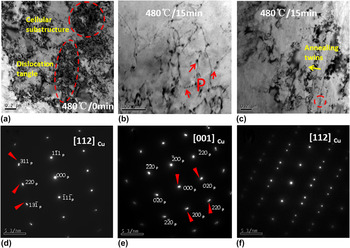
Figure 2 presents the bright-field (BF) TEM images and the corresponding selected area diffraction patterns (SADPs) of the studied alloy having been solution treated, cold rolled by 60% then aged at 480 °C for different time. The typical BF image of the alloy treated with cold-rolling was shown in Fig. 2(a), the dislocation tangle and cellular substructure occurred. The BF image in Fig. 2(b) showed that the dislocation density decreased, many fine precipitates with a size of 3–5 nm formed, and the zero-line contrast can also be seen in particles, which were coherent with the Cu matrix. The SADPs were shown in Figs. 2(d) and 2(e), which revealed the Cr-precipitates, had a bcc crystal structure and a cube-on-cube orientation relationship with Cu matrix. Another view of the BF image of the alloy is shown in Fig. 2(c), and the corresponding SADP is shown in Fig. 2(f), the annealing twins that accounted for the decrease in the hardness of the alloy in the early aging process were found.
TEM images and SADPs of the Cu–0.13Cr–0.074Ag alloy as solution treated, cold rolling by 60% and then aged at 480 °C for different time. (a) BF micrograph after cold rolling; (b) and (c) BF micrographs of the alloy cold-rolled by 60% then aged at 480 °C for 15 min; (d) SADP of (b), beam direction along [112]Cu; (e) SADP of (b), beam direction along [001]Cu; (f) SADP of (c).

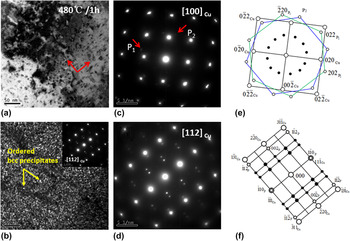
Figure 3 shows the typical TEM images and their corresponding SADPs of the alloy having been solution treated, cold rolled by 60% and then aged at 480 °C for 1 h. With the increase of aging time, the number of precipitates increased, as showed in Fig. 3(a), the precipitates with mutual perpendicular directions formed, which agreed well with the SADP with zone axis of [100]Cu [Fig. 3(c)] in which two sets of vertical reflection spots (marked by P1 and P2) can be seen. The index of the Fig. 3(c) was clearly shown in Fig. 3(e), illustrating that nano-scale precipitates were the Cr phase with an ordered bcc (B2-type or CsCl-type) structure, Reference Batra, Day, Kulkarni and Banerjee24 and the orientation relationship between the precipitates and Cu matrix was: (022)P//(022)Cu, [111]P//[100]Cu, a supper-lattice reflection spots between the spots from precipitates can be also detected in Fig. 3(b). The dark field image from the supper lattice spots of the SADP with zone axis of [112]Cu is shown in Fig. 3(d). The super lattice spots were reflected from the ordered precipitates. Figure 3(f) showed the index of spots in Fig. 3(d). Orientation relationship of the ordered B2 phase and the matrix was (110)P//(111)Cu, (001)P//(110)Cu, [110]P//[112]Cu [N–W orientation relationship (OR)]. Reference Cheng, Shen and Yu25
TEM BF and SADPs of Cu–0.13Cr–0.074Ag alloy as solution treated, cold rolled by 60% and then aged at 480 °C for 1 h. (a) bright field image; (c) SADPs of (a), beam direction along [100]Cu; (e) index of the diffraction pattern showed in (c); (b) dark field image; (d) SADPs of (a), beam direction along [112]Cu; (f) index of the index of diffraction pattern showed in (d). Spots indexed in (e) and (f) show positions of the Cu matrix (○) and Cr-rich phase (○) and the super lattice diffraction spots (●).

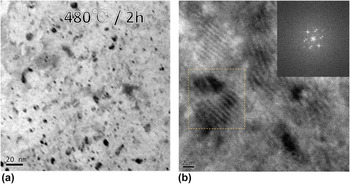
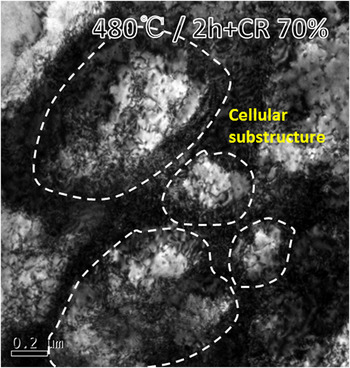
Figure 4 shows the TEM and HRTEM images of the alloy having been solution treated, cold rolled by 60% and then aged at 480 °C for 2 h. Compared with the precipitates of the alloy having been aged at 480 °C for 1 h, the size of that after aging at 480 °C for 2 h increased slightly [Fig. 4(a)]. The combination of fast Fourier transform (FFT) image was depicted in Fig. 4(b). The results indicated the orientation relationship between precipitates and matrix still had an N–W orientation relationship. Figure 5 shows the TEM image of Cu–Cr–Ag alloy having been treated as solution treated, cold rolled by 60% and aged at 480 °C for 2 h then cold rolled by 70%. Many dislocations and cellular substructure were captured in the TEM image (Fig. 5).
TEM HRTEM images of Cu–0.13Cr–0.074Ag alloy as solution treated, cold rolled by 60% and then aged at 480 °C for 2 h. (a) TEM; (b) HRTEM.

TEM BF image of the Cu–Cr–Ag alloy treated as solution treated, cold rolled by 60% and aged at 480 °C for 2 h then cold rolled by 70%.

C. HAADF observation
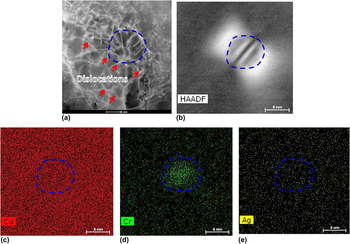
Figure 6 shows the STEM images of the alloy having solution treated, cold rolled by 60% and then aged at 480 °C for 30 min. The typical STEM image of the sample is shown in Fig. 6(a). A clear observation of the STEM showed that the dislocation tangled with precipitation was similar with that in Fig. 2(b). Typical lobe–lobe contrast had also been observed in Fig. 6(b) under High- angle annular dark field (HADDF) observation. The energy dispersive spectrum (EDS) in Fig. 6(d) appeared that the lobe–lobe contrast phase in Fig. 6(a) was Cr, and the Ag element distributed in the copper matrix evenly.
The STEM image of alloy as solution treated, cold rolled by 60% and then aged at 480 °C for 30 min. (a) and (b) the HADDF image of alloy; (c), (d) and (e) the EDS analysis of Cu, Cr, and Ag elements respectively.

D. 3DAP measurement
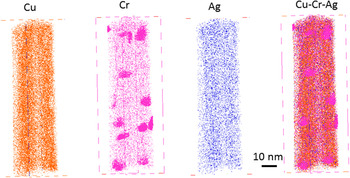
Elemental maps of the atoms in the Cu–Cr–Ag alloy treated with cold rolling by 60%, and aging at 480 °C for 2 h are shown in Fig. 7. A high number density of near-spherical Cr-rich precipitates was clearly observed, and the distribution of Ag-atoms was distributed chemical homogeneously.
2D projection of 3D distributions of atom map of the Cu–Cr–Ag alloy with the treatment of solution, cold rolling by 60% and aging at 480 °C for 2 h. Probed volume is 32 × 32 × 94 nm. Scale bar is 10 nm.

E. Fracture surface
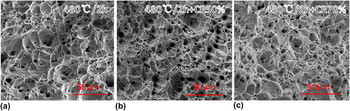
The morphology of the fracture surface showed in Fig. 8 was captured by a SEM. As the alloy was aged at 480 °C for 2 h, the deep dimple appeared and was shown in Fig. 8(a). Figures 8(b) and 8(c) presented the fracture surface of the alloy having been aged at 480 °C for 2 h then cold rolling by 50% and 70%, respectively. As the alloy was treated with aging and cold rolling by 50%, the shallow dimple and quasicleavage fracture occurred [Fig. 8(b)]. With the increase of cold rolling deformation, the fraction of quasicleavage morphology increased accordingly [Fig. 8(c)].
Fracture surface of the alloy treated with different process. (a) Aged at 480 °C for 2 h. (b) Aged at 480 °C for 2 h and cold rolling by 50%. (c) Aged at 480 °C for 2 h and cold rolling by 70%.

IV. DISCUSSION
The main strengthening mechanisms of Cu–Cr–Ag alloy treated with aging and cold work were solid solution strengthening, grain refinement strengthening, precipitation hardening, and strain hardening.
A. Strengthening Mechanisms
1. Solid solution strengthening
For Cu–Cr–Ag alloy, the solid solution strengthening was attributed to Ag element. The Ag dissolved in the copper matrix can cause lattice distortions, which impeded dislocation motion, and increased the yield stress of the material. The increase of the strengthening can be expressed as follow in Eq. (1) Reference Freudenberger, Lyubimova and Gaganov26 :
 $$\Delta {\sigma _{{\rm{ss}}}} = G{\left( {\left| \delta \right| + {1 \over {20}}\left| \eta \right|} \right)^{{3 \mathord{\left/ {\vphantom {3 2}} \right. \kern-\nulldelimiterspace} 2}}}\sqrt {{{{x_{\rm{a}}}} \over 3}} \quad ,$$
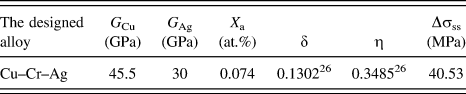
where δ is a factor of lattice change and η is a factor describing the change of the shear modulus due to alloying, x a is the Ag fraction within the solid solution. The used and obtained values that are related to solid solution hardening of the Cu–Cr–Ag alloy are summarized in Table II, strength increase was 40.53 MPa from solid solution strengthening. Sine Cr precipitated from the copper matrix in the aging process, its contribution to solid solution hardening would be neglected.
Solid solution strengthening of the Cu–Cr–Ag alloy.

2. Precipitation hardening
Precipitation strengthening played an important role in the high strength of the Cu–Cr–Ag alloy, Reference Jia, Zheng, Liu, Ren, Tian, Zhou and Lou27 which can be expressed by the following Orowan–Ashby equation in Eq. (2) Reference Lei, Li, Zhu, Qiu and Liang28 :
 $${\tau _{\rm{p}}} = 0.81{{Gb} \over {2\pi {{\left( {1 - \nu } \right)}^{1/2}}}}{{\ln \left( {{{{d_{\rm{p}}}} \mathord{\left/ {\vphantom {{{d_{\rm{p}}}} b}} \right. \kern-\nulldelimiterspace} b}} \right)} \over {\left( {\lambda - {d_{\rm{p}}}} \right)}}\quad ,$$
where b is the Burgers vector (b for Cu is 0.2556 nm), G is the shear modulus of the matrix (G is 45.5 GPa), ν is the Poisson’s ratio of 0.34 for Cu, d p is the average radius of the particle, and λ is the spacing between particles in the glide plane, which is relevant with the radius d p and the volume fraction f v of the second-phase particles, and expressed as the Eq. (3) Reference Mabuchi and Higashi29 :
 $$\lambda = {1 \over 2}{d_{\rm{p}}}\sqrt {{{3\pi } \over {2{f_{\rm{v}}}}}} \quad .$$
The increment of yield strength caused by Orowan mechanism can be expressed as Reference Lei, Li, Zhu, Qiu and Liang28 :
 $$\Delta {\sigma _{{\rm{Orowan}}}} = M{\tau _{\rm{p}}}\quad .$$
For copper alloy, Taylor factor M is 3.1. After treated with aging at 480 °C for 2 h, the average radius of the particle is 11 nm, here all the Cr atoms were considered to have been formed Cr precipitates in the aged sample, thus the volume fraction f v of the second-phase particles was calculated out to be 0.12%, the values of the measurement and calculation of the precipitation hardening has been listed in Table III, strength increase was 69.21 MPa from precipitation hardening.
Precipitation hardening of the Cu–Cr–Ag alloy.

3. Grain boundary strengthening
When the alloy was treated with cold working, the total number of dislocations and cellular substructure substantially increased. As shown in the Fig. 5, when Cu–Cr–Ag alloy samples were treated with cold rolling by 60%, aging at 480 °C for 2 h, then cold rolling by 70%, the sub-grain structure with an average diameter of 0.5 um appeared and distributed evenly. The grain boundary strengthening took place. An increase of yield stress owing to grain boundary strengthening can be estimated using Hall–Petch equation, as shown in Eq. (5) Reference Hansen30 :
 $$\Delta {\sigma _{{\rm{H - P}}}} = k{d^{ - {1 \over 2}}}\quad ,$$
where k is a constant (k is 0.18 MPa
 $\sqrt {\rm{m}}$
for copper alloys), d is the diameter of sub-grain structure, the values of the calculation of grain boundary strengthening has been listed in Table IV, strength increase was 254.56 MPa from grain boundary strengthening.
The values of the calculation of the grain refinement strengthening.

4. Strain hardening
To further improve the strength of the age treatment sample, cold rolling deformation was performed on the studied alloy, Table I showed that the mechanical properties of the studied alloy after different thermal-mechanical treatment. For example, as the sample had been treated by solution treatment + 60% CR + 480 °C/2 h, the yield strength was 284 MPa, further cold rolling deformed by 50% and 70%, the yield strength would increase to be 373 MPa and 446 MPa, respectively. The incremental strength increase came from two aspects: one was the grain boundary strengthening, and the other was strain hardening. In this work, as the sample was solution treated, cold rolled by 60%, aged at 480 °C for 2 h, and cold rolled by 70%, the dislocation density was increased by these two cold rolling deformation processes, see Figs. 5 and 6. Between these two deformation processes, aging treated was performed. Here, we simply evaluated the strength increment with a Taylor relation Reference Wang, Zhu and Starink31 :
 $$\Delta {\sigma _{{\rm{dislocations}}}} = \alpha \cdot G \cdot b \cdot \sqrt \rho \quad ,$$
where, α was a constant, about 0.3, G was the shear modulus (45.5 GPa), b was the Burgers vector (0.2556 nm), and ρ was the dislocation density. Table V presents the values of the calculation of the strain hardening, strength increase was 98.68 MPa from strain hardening.
The values of the calculation of the strain hardening.

In all, the total yield strength of the Cu–Cr–Ag alloy can be calculated by an equation written as Eq. (7):
 $$\sigma = {\sigma _0} + \Delta {\sigma _{{\rm{ss}}}} + \Delta {\sigma _{{\rm{Orowan}}}} + \Delta {\sigma _{{\rm{H}}-{\rm{P}}}} + \Delta {\sigma _{{\rm{dislocations}}}}\quad ,$$
where σ0 is the yield strength of pure alloy (45.5 MPa for the Cu alloy), σ of 508.48 MPa is the calculating value of the yield stress of the designed alloy as treated with the second cold rolling by 70% after aging. The calculated yield strength is close to the experimental value (446 MPa) with an error of 14%, which should be attributed to that the dislocations were evaluated three mechanisms, such as Orowan strengthening, grain boundary strengthening, and strain hardening, resulting that the calculation value was a little higher than the experimental value.
B. Electrical conductivity
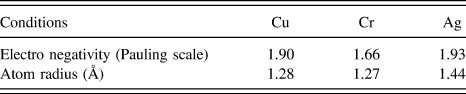
The electrical conductivity of the copper alloy was mainly depended on the purity of the copper matrix. Reference Xia, Zhang and Kang32 When alloy elements were added into the copper matrix, the solute atoms could cause lattice distortion of the Cu-crystal lattice, the increase of scattering of electron, accordingly, the electrical resistance increased. Table VI showed the electro negativity, atom radius of Cu, Cr, and Ag. Since Ag had the similar electronic structure and crystal structure with Cu, when a small amount of Ag was solid-dissolved in copper, the conductivity slightly decreased. Furthermore, when the Cu–Cr–Ag alloy was treated with aging, Cr particles precipitated from the copper matrix (Figs. 2 and 3), the electron scattering of Cu alloy decreased with the increase of precipitation of Cr from the matrix, which benefited to the enhancement of electrical conductivity of the designed alloy. Reference Liu, Shao, Liu, Yang and Lu33 The higher aging temperature was, the faster rate of precipitation it had. Accordingly, the electrical conductivity value increased fast [Fig. 1(b)].
The electro negativity, atom radius of Cu, Cr and Ag elements.

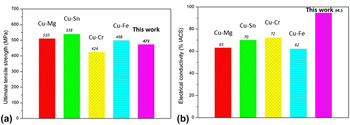
Figure 9 showed the comparison of mechanical properties and electrical conductivity of Cu–Mg, Cu–Sn, Cu–Fe, Cu–Cr, and designed Cu–Cr–Ag alloys. The Cu–Mg, Cu–Sn, Cu–Fe, Cu–Cr alloy had similar tensile strength with designed Cu–Cr–Ag, but their electrical conductivities were below 75% IACS, Reference Wang, Zhang, Guo and Song34–Reference Shangina, Maksimenkova, Bochvar and Serebryany38 while that of the designed Cu–Cr–Ag alloy was 94.5% IACS. It revealed that the designed Cu–Cr–Ag alloy had the excellent combination of mechanical and electrical properties.
Comparisons of tensile strength and electrical conductivities of other elastic coppers and the designed alloy. (a) Tensile strength; (b) electrical conductivity.

V. CONCLUSIONS
-
(1) The designed Cu–0.13Cr–0.074Ag has an excellent combination of strength and electrical conductivity. As the alloy was treated with 870 °C/1 h ST + 60% CR + 480 °C/2 h AG + 70% CR, the micro-hardness, electrical conductivity, yield strength, and tensile strength reached 140 HV, 94.5% IACS, 446 MPa, and 473 MPa, respectively.
-
(2) The Cr precipitates had an fcc structure with a cube-on-cube orientation relationship with the Cu matrix in the initial aging process, while an ordered bcc structure and N–W orientation relationship with the matrix occurred as the alloy aged at 480 °C for 2 h.
-
(3) The 3DAP results showed the element of Ag distributed evenly in the Cu matrix, which could improve the processing hardening rate and resistance of elevating temperature soften effectively, and the element of Cr existed in the form of the elemental precipitates.
ACKNOWLEDGMENTS
The work is financially supported by the National Key Technology K&D Program (2014BAC03B08) and the National Key Research and Development Program of China (2016YFB0301300).