1 Introduction
Flows driven by thermal natural convection are ubiquitous in nature and in many engineering applications. In one of its many forms, a flow is sustained by simply applying a temperature difference at two opposing walls. For example when the walls are horizontal and the bottom wall is heated, gravity acts parallel to the heat flux and the set-up is known as the classical Rayleigh–Bénard convection (RBC) (Ahlers, Grossmann & Lohse Reference Ahlers, Grossmann and Lohse2009; Lohse & Xia Reference Lohse and Xia2010; Chillà & Schumacher Reference Chillà and Schumacher2012). Alternatively, if heating and cooling are applied simultaneously at the bottom wall, the set-up is referred as horizontal convection (HC) (Hughes & Griffiths Reference Hughes and Griffiths2008; Shishkina, Grossmann & Lohse Reference Shishkina, Grossmann and Lohse2016). If the walls are instead vertical with one wall heated and the other cooled, gravity acts orthogonal to the heat flux and this set-up is referred to as vertical natural convection (VC) (Ng et al.
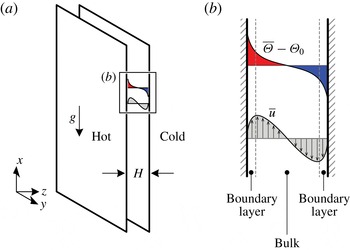
Reference Ng, Ooi, Lohse and Chung2015; Shishkina Reference Shishkina2016). An example of this set-up is shown in figure 1. We note that in this configuration, the mean vertical pressure gradient is zero for VC. The transition between the extremes, RBC and VC, is continuous and Shishkina & Horn (Reference Shishkina and Horn2016) analysed thermal convection with some tilt angle
 $\unicode[STIX]{x1D6FC}$
with
 $0^{\circ }\leqslant \unicode[STIX]{x1D6FC}\leqslant 90^{\circ }$
between the direction of gravity and the mean temperature gradient. Although
 $\unicode[STIX]{x1D6FC}$
can be an input parameter, we consider only the cases for constant
 $\unicode[STIX]{x1D6FC}$
(for VC,
 $\unicode[STIX]{x1D6FC}=0^{\circ }$
). The two parameters that define all these set-ups are the Rayleigh number,
 $Ra$
, which is the dimensionless temperature difference, and Prandtl number,
 $Pr$
, which defines the fluid based on the ratio of kinematic viscosity to thermal diffusivity of the fluid. At the walls, viscous and thermal boundary layers (BL) form and are known to modulate the heat flux in the system, which is defined by the Nusselt number,
 $Nu$
.
(a) Set-up of vertical natural convection for the present study. (b) Illustration of the mean temperature profile (top) and mean streamwise velocity profile (bottom). Both mean profiles are statistically antisymmetric about the channel centreline. Also illustrated are the boundary layers and bulk region. Note that in general, thermal and kinetic boundary layers have different thicknesses.

With increasing
 $Ra$
, the boundary layers in thermal convection become increasingly thinner and the flow is understood to undergo a transition from a ‘classical’ regime, where the boundary layers follow a laminar-like Prandtl–Blasius–Pohlhausen (PBP) scaling, to an ‘ultimate’ regime, where the boundary layers are turbulent in the sense of Prandtl and von Kármán (Grossmann & Lohse Reference Grossmann and Lohse2011, Reference Grossmann and Lohse2012). We are particularly interested to investigate the changes to the boundary-layer structure towards the ultimate regime and the accompanying
 $Ra$
dependence of the Nusselt number and the Reynolds number
 $Re$
. Our investigation is motivated by the fact that experimental studies in RBC have found a transition from the classical to the ultimate regime at a transitional Rayleigh number value of approximately
 $5\times 10^{14}$
(He et al.
Reference He, Funfschilling, Nobach, Bodenschatz and Ahlers2012). Accompanying the transition to the ultimate regime, the overall mean temperature profile exhibits an increasingly pronounced logarithmic dependence (Ahlers et al.
Reference Ahlers, Bodenschatz, Funfschilling, Grossmann, He, Lohse, Stevens and Verzicco2012; Ahlers, Bodenschatz & He Reference Ahlers, Bodenschatz and He2014). In a two-dimensional numerical study at lower
 $Ra$
, the local mean temperature profile was also found to exhibit similar logarithmic variations where thermal plumes are emitted (van der Poel et al.
Reference van der Poel, Ostilla-Mónico, Verzicco, Grossmann and Lohse2015). The presence of a local logarithmic-type mean temperature profile in RBC suggests that we can employ a criterion to distinguish flow regions in VC to compute local statistics, similar to the approach adopted by van der Poel et al. (Reference van der Poel, Ostilla-Mónico, Verzicco, Grossmann and Lohse2015). In addition, the big and unique advantage of VC is that a well-defined mean flow exists which allows for a longer time sampling of our data. In Ng et al. (Reference Ng, Ooi, Lohse and Chung2015), we have also shown that aspects of the Grossmann–Lohse theory (Grossmann & Lohse Reference Grossmann and Lohse2000, Reference Grossmann and Lohse2001, Reference Grossmann and Lohse2002, Reference Grossmann and Lohse2004) (hereafter GL theory), which provided physical arguments for the scaling relations in horizontal thermal convection, i.e. RBC, can also be extended to VC. Therefore, the present study makes contact with current efforts to understand the changes to the boundary-layer structure in the transition from the classical to the ultimate regime of thermal convection.
The paper is organised as follows: in § 2, we first give the underlying dynamical equations which are numerically solved. From a visual assessment of the near-wall velocity and temperature fields (§ 3), we identify two regions that are increasingly distinguishable at higher
 $Ra$
, namely a streaky higher-shear flow region and a non-streaky lower-shear flow region. Motivated by the visual changes in the near-wall flow features, we define a flux-based Richardson number,
 $|Ri_{f}|$
(§ 4), which is inspired by the classical definition (see for example in chap. 5 of Turner Reference Turner1979). A criterion is selected based on
 $|Ri_{f}|$
in order to separate the dynamics of the streaky and non-streaky regions. Conveniently, the streaky higher-shear flow regions are well correlated with low-
 $|Ri_{f}|$
regions, and vice versa. When we quantify the wall-area fraction occupied by the streaky higher-shear regions (§ 5), we find that the wall-area fraction increases with increasing
 $Ra$
. We then employ a conditional averaging procedure to compute the local mean statistics of the two regions (§ 6) as well as the local scaling of
 $Nu$
and
 $Re$
(§ 7). Finally, we compare the near-wall structures in VC with the near-wall streaks in pressure-driven channel flow, the latter of which are unique and robust features of the buffer region in wall-bounded turbulence. The comparison is aided by the analysis of the one-dimensional premultiplied spectra of streamwise velocity (§ 8). The paper ends with a summary and conclusions (§ 9).
2 Dynamical equations and boundary conditions
In this study, we analyse the dataset for VC for Rayleigh numbers ranging from
 $10^{5}$
to
 $10^{9}$
at constant Prandtl number value of 0.709. The numerical set-up for VC is the same as that employed by Ng et al. (Reference Ng, Ooi, Lohse and Chung2015), see figure 1, i.e. we consider a buoyancy-driven flow between two vertical walls with the left wall heated and the right wall cooled. The temperatures at the wall are kept uniform and are denoted
 $T_{h}$
and
 $T_{c}$
, respectively. Thus, the temperature difference of the walls
 $\unicode[STIX]{x1D6E5}=T_{h}-T_{c}$
establishes a heat flux which acts horizontally across a wall separation distance
 $H$
. The governing continuity, momentum and energy equations for the velocity field
 $\boldsymbol{u}(\boldsymbol{x},t)$
and the temperature field
 $\unicode[STIX]{x1D6E9}(\boldsymbol{x},t)$
are respectively given by,
 $$\begin{eqnarray}\displaystyle & \displaystyle \unicode[STIX]{x1D735}\boldsymbol{\cdot }\boldsymbol{u}=0, & \displaystyle\end{eqnarray}$$
 $$\begin{eqnarray}\displaystyle & \displaystyle \frac{\unicode[STIX]{x2202}\boldsymbol{u}}{\unicode[STIX]{x2202}t}+\boldsymbol{u}\boldsymbol{\cdot }\unicode[STIX]{x1D735}\boldsymbol{u}=-\frac{1}{\unicode[STIX]{x1D70C}_{0}}\unicode[STIX]{x1D735}p+\hat{\boldsymbol{e}}_{x}g\unicode[STIX]{x1D6FD}(\unicode[STIX]{x1D6E9}-\unicode[STIX]{x1D6E9}_{0})+\unicode[STIX]{x1D708}\unicode[STIX]{x1D6FB}^{2}\boldsymbol{u}, & \displaystyle\end{eqnarray}$$
 $$\begin{eqnarray}\displaystyle & \displaystyle \frac{\unicode[STIX]{x2202}\unicode[STIX]{x1D6E9}}{\unicode[STIX]{x2202}t}+\boldsymbol{u}\boldsymbol{\cdot }\unicode[STIX]{x1D735}\unicode[STIX]{x1D6E9}=\unicode[STIX]{x1D705}\unicode[STIX]{x1D6FB}^{2}\unicode[STIX]{x1D6E9}, & \displaystyle\end{eqnarray}$$
 $\hat{\boldsymbol{e}}_{x}$
is the unit vector in the
 $x$
direction. The pressure field is denoted by
 $p(\boldsymbol{x},t)$
. We define
 $\unicode[STIX]{x1D6E9}_{0}=(T_{h}+T_{c})/2$
as the reference temperature and
 $g$
as the gravitational acceleration. We also specify
 $\unicode[STIX]{x1D6FD}$
as the coefficient of thermal expansion,
 $\unicode[STIX]{x1D708}$
as the kinematic viscosity and
 $\unicode[STIX]{x1D705}$
as the thermal diffusivity, all assumed to be independent of temperature. The Rayleigh and Prandtl numbers are then respectively defined as
 $$\begin{eqnarray}\displaystyle Ra\equiv \frac{g\unicode[STIX]{x1D6FD}\unicode[STIX]{x0394}H^{3}}{\unicode[STIX]{x1D708}\unicode[STIX]{x1D705}},\quad Pr\equiv \frac{\unicode[STIX]{x1D708}}{\unicode[STIX]{x1D705}}. & & \displaystyle\end{eqnarray}$$
The coordinate system
 $x$
,
 $y$
and
 $z$
refers to the streamwise (opposing gravity), spanwise and wall-normal directions. The no-slip and no-penetration boundary conditions are imposed on the velocity at the walls. Periodic boundary conditions are imposed on
 $\boldsymbol{u}$
,
 $p$
and
 $\unicode[STIX]{x1D6E9}$
in the
 $x$
- and
 $y$
-directions. In addition, we denote time- and
 $xy$
-plane-averaged quantities with an overbar and the corresponding fluctuating part with a prime, e.g. the mean streamwise velocity component is defined by
 $\overline{u}=u-u^{\prime }$
and the mean temperature is defined by
 $\overline{\unicode[STIX]{x1D6E9}}=\unicode[STIX]{x1D6E9}-\unicode[STIX]{x1D6E9}^{\prime }$
.
Equations (2.1a
)–(2.1c
) are numerically solved in the domain size
 $L_{x}\times L_{y}\times L_{z}=8H\times 4H\times H$
. The present simulations employ smaller periodic domain sizes (two thirds in each periodic direction) than other direct numerical simulation (DNS) studies (e.g. Versteegh & Nieuwstadt Reference Versteegh and Nieuwstadt1999; Pallares et al.
Reference Pallares, Vernet, Ferre and Grau2010) but are chosen in order to resolve the near-wall region at high
 $Ra$
. Comparison with previous DNS studies showed good agreement for the mean and second-order statistics and other simulation parameters have been previously reported in Ng et al. (Reference Ng, Ooi, Lohse and Chung2015). All of the analyses in this study are based on statistics that are averaged from both halves of the channel, taking the statistical antisymmetry (about the centreline) of the mean profiles into account.
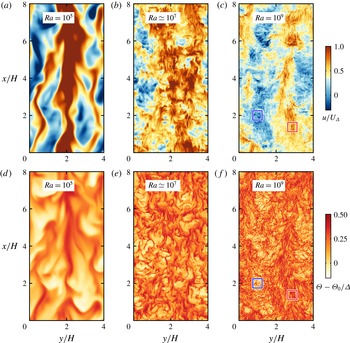
(a–c) Wall-parallel planes of streamwise velocity, and (d–f) temperature for
 $Ra\simeq 10^{5}$
,
 $10^{7}$
and
 $10^{9}$
. The planes are extracted close to the hotter wall at
 $z^{+}\approx 15$
. Gravity is acting downwards. The non-streaky lower-shear regions are indicated by the blue boxes whereas the streaky higher-shear regions are indicated by the red boxes (see magnified views in figure 3). Here,
 $U_{\unicode[STIX]{x1D6E5}}\equiv \sqrt{g\unicode[STIX]{x1D6FD}\unicode[STIX]{x0394}H}$
the free-fall velocity.

3 Flow visualisations
Figure 2 shows the wall-parallel planes of velocity and temperature for
 $Ra\simeq 10^{5}$
,
 $10^{7}$
and
 $10^{9}$
. The planes were extracted from the three-dimensional volumes for velocity and temperature near the hotter wall at the wall-normal location equivalent to
 $z^{+}\equiv z/\unicode[STIX]{x1D6FF}_{\unicode[STIX]{x1D708}}\approx 15$
, where
 $\unicode[STIX]{x1D6FF}_{\unicode[STIX]{x1D708}}\equiv \unicode[STIX]{x1D708}/u_{\unicode[STIX]{x1D70F}}$
is the viscous length scale and
 $u_{\unicode[STIX]{x1D70F}}\equiv \sqrt{\unicode[STIX]{x1D708}\,\text{d}\overline{u}/\text{d}z|_{w}}$
is the friction velocity scale. Note that we use the
 $^{+}$
symbol to denote normalisation in viscous wall units. In figure 2(a–c), the velocity fields are coloured from blue to red to denote low- and high-speed regions (or equivalently, lower- and higher-shear regions), respectively, whereas in figure 2(d–f) the temperature fields are coloured from white to red to denote the temperature variations from cooler regions with a temperature around
 $\unicode[STIX]{x1D6E9}_{0}$
to hotter regions with a temperature around
 $T_{h}$
. Not surprisingly, from figure 2, the structures in the velocity and temperature fields are observed to become increasingly finer at higher
 $Ra$
. The finer structures are particularly prominent at
 $Ra=10^{9}$
(figure 2
c,f). Coincident with the higher-shear regions, the finer structures appear streaky and are markedly different to the structures in the lower-shear regions as well as the structures in the visualisations at lower-
 $Ra$
. To focus on the differences, magnified views of the higher- and lower-shear regions are plotted for
 $Ra=10^{9}$
in figure 3.
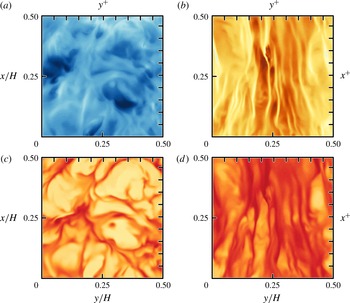
Magnified wall-parallel planes of streamwise velocity (a,b) and temperature (c,d), respectively reproduced from the blue and red boxes from figure 2(c,f) for
 $Ra=10^{9}$
. In (a,c) we observe non-streaky lower-shear regions (from the blue boxes), whereas in (b,d) we observe streaky higher-shear regions (from the red boxes), both with characteristic spanwise spacings of 100–200 viscous units. For reference, the axes at the top and right edges denote spacings of 100 viscous units. The colour maps are the same as in figure 2.

On closer inspection of the magnified views (figure 3), the streaky structures appear reminiscent of the near-wall streaks, which are well-documented flow features in canonical turbulent boundary layers (Hutchins & Marusic Reference Hutchins and Marusic2007a
; Marusic et al.
Reference Marusic, McKeon, Monkewitz, Nagib, Smits and Sreenivasan2010; Smits, McKeon & Marusic Reference Smits, McKeon and Marusic2011). In the magnified view, the spanwise spacing of the streaky structures is approximately 100–200 viscous units, consistent with the spacing of the near-wall streaks found by Kline et al. (Reference Kline, Reynolds, Schraub and Runstadler1967). The similarity between the streaky structures in VC at higher
 $Ra$
and in canonical turbulent boundary layers suggests that locally, the boundary layers in VC are much more strongly animated by a large-scale ‘wind’, perhaps an indication of an incipient turbulent boundary layer. Additionally, this incipient behaviour appears to manifest as increasingly larger streaky regions, as observed in the plane visualisations in figure 2. Therefore, a reasonable starting point would be to seek a quantity that is able to distinguish between the two regions and that would also enable us to study the corresponding local scaling.
4 Identifying different flow regions
In order to quantitatively distinguish the two regions shown in the magnified views in figure 2, we define a flux-based Richardson number at the wall-normal location
 $z^{+}=15$
(i.e. just outside the viscous sublayer),
 $$\begin{eqnarray}Ri_{f}\equiv \frac{z(z^{+}=15)}{L}=\frac{15}{L^{+}},\end{eqnarray}$$
where
 $L\equiv -u_{\unicode[STIX]{x1D70F}}^{3}/(g\unicode[STIX]{x1D6FD}f_{w})$
is the Obukhov length and
 $f_{w}\equiv -\unicode[STIX]{x1D705}(\text{d}\overline{\unicode[STIX]{x1D6E9}}/\text{d}z)|_{w}$
is the wall heat flux and
 $u_{\unicode[STIX]{x1D70F}}$
is the friction velocity scale defined in § 3. The Obukhov length is defined such that when
 $f_{w}<0$
, then
 $L>0$
(§ 7.2 Monin & Yaglom Reference Monin and Yaglom2007). Since
 $f_{w}>0$
for VC, then
 $L<0$
and the sign of
 $Ri_{f}$
becomes negative for VC. Therefore, to assist interpretation, we will use
 $Ri_{f}$
mainly modulo-wise,
 $|Ri_{f}|$
.
We emphasise that our flux-based Richardson number definition in (4.1) is a local quantity (in the plane
 $z^{+}=15$
) to measure shear-dominated areas versus buoyancy-dominated areas and is merely an analogy that is inspired by the classical definition (see for example chap. 5 in Turner Reference Turner1979). Equation (4.1) is notionally similar to the Obukhov stability parameter, which is a dimensionless height typically adopted in the study of atmospheric surface layer turbulence (Businger et al.
Reference Businger, Wyngaard, Izumi and Bradley1971). Our definition is therefore far from perfect since the vertical heat flux in VC is a response to the horizontal heat flux imposed on the system, whereas in the classical definition, both the imposed and responding heat fluxes act in the same (vertical) direction. Nevertheless, we take advantage of (4.1) in our study simply as a convenient parameter which is able to quantify the dominance of buoyancy relative to shear. It is also for this reason that we prefer to use (4.1) to distinguish high-speed regions instead of other quantities, such as the shear Reynolds number (see for example Scheel & Schumacher Reference Scheel and Schumacher2016). By defining (4.1), we also make contact with recent efforts to distinguish ‘wind-sheared’ regions in flows that are analogous to VC, for example, in Taylor–Couette flows (Ostilla-Mónico et al.
Reference Ostilla-Mónico, van der Poel, Verzicco, Grossmann and Lohse2014) and RBC (van der Poel et al.
Reference van der Poel, Ostilla-Mónico, Verzicco, Grossmann and Lohse2015).
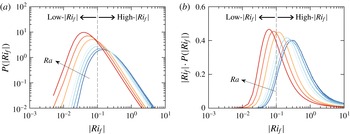
(a) Probability distribution functions of
 $|Ri_{f}|$
, and (b) the premultiplied form defined in (4.2). The curves are coloured blue to red to represent increasing
 $Ra$
. The low- and high-
 $|Ri_{f}|$
ranges are demarcated by
 $|Ri_{f}|=0.1$
(dashed line). The premultiplied probability distribution functions in (b) are increasingly weighted towards lower-
 $|Ri_{f}|$
with increasing
 $Ra$
.

We now turn to the probability distributions functions (PDFs) of
 $|Ri_{f}|$
(figure 4
a) to determine a suitable threshold value that can distinguish the high-speed and low heat flux regions. To visually aid the interpretation on a doubly logarithmic plot, we premultiply the PDFs with
 $|Ri_{f}|$
so that the area of a semi-logarithmic plot represents the probability, i.e.
 $$\begin{eqnarray}\int _{0}^{+\infty }P(|Ri_{f}|)\,\text{d}|Ri_{f}|=1=\int _{0}^{+\infty }|Ri_{f}|\cdot P(|Ri_{f}|)\,\text{d}(\log |Ri_{f}|).\end{eqnarray}$$
The integrand on the left-hand side of (4.2) is plotted in figure 4(a) and the integrand on the right-hand side of (4.2) is plotted in figure 4(b). Therefore, in the representation of figure 4(b), the area beneath the PDF curve represents equal probability of
 $|Ri_{f}|$
, which is not the case in figure 4(a). The curves are coloured from blue to red to represent increasing
 $Ra$
. We further define a low-
 $|Ri_{f}|$
as
 $0<|Ri_{f}|\leqslant 0.1$
and high-
 $|Ri_{f}|$
as
 $|Ri_{f}|>0.1$
. From figure 4(b), we observe that with increasing
 $Ra$
, there is an increase in the areas under the premultiplied curves which correspond to the low-
 $|Ri_{f}|$
. This increase in area suggests that the distributions of
 $|Ri_{f}|$
are increasingly weighted towards the lower-
 $|Ri_{f}|$
values with increasing
 $Ra$
. As a further example, the value of the mode of the Richardson number
 $|Ri_{f,m}|$
in figure 4(a) decreases as
 $|Ri_{f,m}|\approx 0.99Ra^{-0.16}$
from a least-squares fit to a single power law.
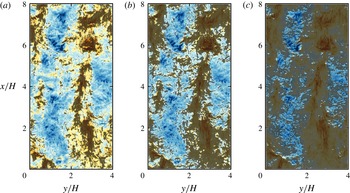
Same wall-parallel planes of streamwise velocity as in figure 2(a–c), but now overlaid with grey contours of
 $0<|Ri_{f}|\leqslant 0.1$
. The
 $Ra$
-values are (a)
 $10^{5}$
, (b)
 $2\times 10^{7}$
and (c)
 $10^{9}$
. With increasing
 $Ra$
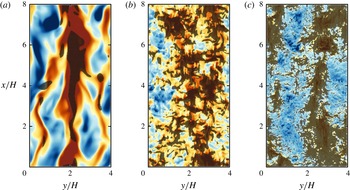
, the grey contours are increasingly correlated with the streaky higher-shear regions and occupy increasingly larger wall-area fractions. Gravity is acting downwards.

To explain the trend observed in the premultiplied PDFs, we refer to a visual example of low-
 $|Ri_{f}|$
regions which are shown as grey-filled patches in figure 5. The grey-filled patches are overlaid on the plane-parallel visualisations of streamwise velocity for three
 $Ra$
-values, which are reproduced from figure 2. At the highest
 $Ra$
(figure 5
c), we observe that the low-
 $|Ri_{f}|$
regions are well correlated with the streaky regions in figure 2(c). In figure 5, the degree of correlation also increases with increasing
 $Ra$
and is matched by an increasingly larger wall-area coverage of low-
 $|Ri_{f}|$
regions. The improved correlations and increasing wall-area coverage of the low-
 $|Ri_{f}|$
regions are consistent with the increasingly weighted trends of the premultiplied PDFs of lower-
 $|Ri_{f}|$
values with increasing
 $Ra$
, seen in figure 4(b). These well-matched behaviours of low-
 $|Ri_{f}|$
distributions and the streaky regions imply that it may be possible to quantify shear-dominated regions from a carefully selected low-
 $|Ri_{f}|$
value.
As a starting point, we choose the range
 $0<|Ri_{f}|\leqslant 0.1$
as the criteria for identifying shear-dominated regions in our study. If a lower or higher upper limit is selected, the corresponding wall areas of the local flow that meet the criteria are smaller and larger, respectively. (A brief discussion about the sensitivity of wall areas to the upper limit is given in the Appendix.) Not surprisingly, the choice of the upper limit has an influence on the local effective scaling. However, we will show in § 7 that for a sufficiently small
 $|Ri_{f}|$
threshold, the effective local scaling exponent of the Nusselt number is unequivocally higher than the global effective scaling exponent and therefore, does not alter the conclusions of this study.
Plot of
 $\unicode[STIX]{x1D70C}$
the area fraction of higher-shear low-
 $|Ri_{f}|$
regions (solid circles) versus
 $Ra$
;
 $\unicode[STIX]{x1D70C}$
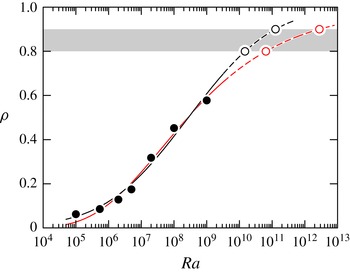
is defined in (5.1). The solid black curve is the empirical fit to
 $\unicode[STIX]{x1D70C}_{fit,1}$
, see (5.2), and the solid red curve is the empirical fit to
 $\unicode[STIX]{x1D70C}_{fit,2}$
, see (5.3). From an extrapolation to
 $\unicode[STIX]{x1D70C}=0.8$
and
 $0.9$
, we obtain
 $Ra\approx 1.5\times 10^{10}$
and
 ${\approx}1.2\times 10^{11}$
, respectively, for
 $\unicode[STIX]{x1D70C}_{fit,1}$
(black open circles) and
 $Ra\approx 6.5\times 10^{10}$
and
 ${\approx}2.8\times 10^{12}$
, respectively, for
 $\unicode[STIX]{x1D70C}_{fit,2}$
(red open circles).

5 Low-
 $|Ri_{f}|$
area fraction

Using the flux-Richardson number criteria defined in § 4, we quantify the wall areas occupied by the low-
 $|Ri_{f}|$
regions for our
 $Ra$
-range. These wall areas correspond to shear-dominated regions and we quantify the area fraction
 $\unicode[STIX]{x1D70C}(Ra)$
according to
 $$\begin{eqnarray}\unicode[STIX]{x1D70C}(Ra)\equiv \frac{\displaystyle \int _{0}^{L_{y}}\int _{0}^{L_{x}}I_{0<|Ri_{f}|\leqslant 0.1}\,\text{d}x\,\text{d}y}{\displaystyle \int _{0}^{L_{y}}\int _{0}^{L_{x}}\,\text{d}x\,\text{d}y},\end{eqnarray}$$
where
 $I$
is an indicator function, being 1 for wall areas where
 $0<|Ri_{f}|\leqslant 0.1$
(low-
 $|Ri_{f}|$
) and being 0 where
 $|Ri_{f}|>0.1$
(high-
 $|Ri_{f}|$
). Therefore, the numerator represents the streamwise–spanwise wall area influenced by low-
 $|Ri_{f}|$
flow and the denominator represents the total wall area of our set-up, which is
 $L_{x}\times L_{y}=32H^{2}$
. Equation (5.1) is similar to the definition used to quantify the spatial intermittency of strong shear regions in RBC (e.g. Scheel & Schumacher Reference Scheel and Schumacher2016). The results for the area fractions
 $\unicode[STIX]{x1D70C}(Ra)$
are shown in figure 6 as filled circles.
In figure 6, the area fractions for the low-
 $|Ri_{f}|$
regions range from
 $\unicode[STIX]{x1D70C}\approx 0.062$
for
 $Ra=10^{5}$
to
 $\unicode[STIX]{x1D70C}\approx 0.58$
for
 $Ra=10^{9}$
. Visually, the trend of the area fractions appears sigmoidal and therefore, using a fit to an error function, the trend for
 $\unicode[STIX]{x1D70C}(Ra)$
can be approximated by
 $$\begin{eqnarray}\unicode[STIX]{x1D70C}_{fit,1}=0.49\;\text{erf}[0.35\log _{10}(Ra)-2.95]+0.5.\end{eqnarray}$$
Alternatively, the trend for
 $\unicode[STIX]{x1D70C}(Ra)$
can also be approximated by a fit to the Gompertz function
 $$\begin{eqnarray}\unicode[STIX]{x1D70C}_{fit,2}=0.99\exp \{-2.21\exp [-0.48\log _{10}(Ra)+2.91]\},\end{eqnarray}$$
which is an asymmetric sigmoid function. In contrast to (5.2), (5.3) captures a lower inflection point in the trend of
 $\unicode[STIX]{x1D70C}$
, which occurs at
 $Ra=2\times 10^{7}$
in figure 6. However, (5.3) does not capture the trend of
 $\unicode[STIX]{x1D70C}$
for
 $Ra\lesssim 5.4\times 10^{5}$
compared to (5.2). We note that both curve fits are only statistical approximations and there are inherent risks involved when extrapolating results to higher
 $Ra$
. Therefore, in the interest of obtaining a conservative estimate, we include both
 $\unicode[STIX]{x1D70C}_{fit,1}$
and
 $\unicode[STIX]{x1D70C}_{fit,2}$
in our subsequent discussions.
From extrapolations of (5.2) and (5.3), approximately 80 %–90 % of the near-wall region are presumed to be dominated by streaks between
 $Ra\approx 1.5\times 10^{10}$
to
 $1.2\times 10^{11}$
, based on (5.2), or
 $Ra\approx 6.5\times 10^{10}$
to
 $2.8\times 10^{12}$
, based on (5.3). Overall, the trend of
 $\unicode[STIX]{x1D70C}(Ra)$
is increasing and indicates that higher-shear regions occupy increasingly larger wall areas at higher
 $Ra$
.
Our results are consistent with the notion that for the present
 $Ra$
range, the boundary layers in VC can be considered to be in a transitional state. As the flow approaches the fully turbulent, or ultimate regime, the relative size of the shear-dominated regions grow until the regions fully occupy the wall (van der Poel et al.
Reference van der Poel, Ostilla-Mónico, Verzicco, Grossmann and Lohse2015).
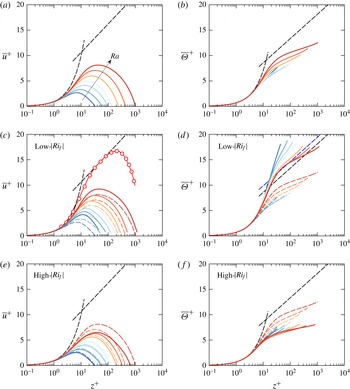
(a) Overall mean velocity profiles and (b) overall mean temperature profiles, coloured from blue to red to represent increasing
 $Ra$
. The overall mean profiles are repeated in (c) to (f) as dashed curves. (c,d) Conditional mean profiles in low-
 $|Ri_{f}|$
(
 $0<|Ri_{f}|\leqslant 0.1$
) regions. (e,f) Conditional mean profiles in high-
 $|Ri_{f}|$
(
 $|Ri_{f}|>0.1$
) regions. The black straight dashed lines correspond to the log laws of the walls for velocity and temperature, (6.1), with
 $\unicode[STIX]{x1D705}_{\unicode[STIX]{x1D708}}=0.41$
,
 $A=5.0$
,
 $Pr_{t}=0.85$
and
 $B=3.8$
. In (c), the red curve with open symbols corresponds to the mean streamwise velocity from the wall jet flow (reproduced from figure 13, Eriksson, Karlsson & Persson Reference Eriksson, Karlsson and Persson1998). In (d), the blue straight dashed line corresponds to (6.1b
) with
 $B=5.1$
.

6 Mean profiles and conditional mean profiles
The overall mean profiles for streamwise velocity and temperature are shown in figure 7(a,b), where the profiles are coloured from blue to red to indicate increasing
 $Ra$
. From both figures, we conclude that there are no log profiles in the mean statistics when scaled in wall units. We highlight the absence of the log profiles in the overall mean profiles by including in figure 7(a,b) the log laws of the wall, which are expected when the flow is fully turbulent in the sense of Prandtl and von Kármán. The log laws of the wall for streamwise velocity and temperature may be written as,
 $$\begin{eqnarray}\displaystyle \overline{u}^{+}=\frac{1}{\unicode[STIX]{x1D705}_{v}}\log (z^{+})+A\quad \text{and}\quad \overline{\unicode[STIX]{x1D6E9}}^{+}=\frac{Pr_{t}}{\unicode[STIX]{x1D705}_{v}}\log (z^{+})+B, & & \displaystyle\end{eqnarray}$$
(cf. Yaglom Reference Yaglom1979), where
 $\overline{u}^{+}\equiv \overline{u}/u_{\unicode[STIX]{x1D70F}}$
and
 $\overline{\unicode[STIX]{x1D6E9}}^{+}\equiv (\overline{\unicode[STIX]{x1D6E9}}-\unicode[STIX]{x1D6E9}_{h})/\unicode[STIX]{x1D703}_{\unicode[STIX]{x1D70F}}$
. Equations (6.1) are plotted as black dashed lines in figure 7. For the purposes of our study, we choose to adopt the same constants as Yaglom (Reference Yaglom1979), i.e. the von Kármán constant
 $\unicode[STIX]{x1D705}_{v}=0.41$
, the turbulent Prandtl number
 $Pr_{t}=0.85$
,
 $A=5.0$
and
 $B=3.8$
. We also employ the temperature scale
 $\unicode[STIX]{x1D703}_{\unicode[STIX]{x1D70F}}\equiv -f_{w}/u_{\unicode[STIX]{x1D70F}}$
. Near the wall, the mean profiles are linear and obey
 $\overline{u}^{+}=z^{+}$
and
 $\overline{\unicode[STIX]{x1D6E9}}^{+}=Pr\,z^{+}$
.
To assess the mean profiles in the streaky and high-shear regions only, we compute the conditional mean profiles within the low-
 $|Ri_{f}|$
regions according to the conditional averaging procedure
 $$\begin{eqnarray}\overline{(\cdot )}_{l}(z)=\frac{\displaystyle \int _{0}^{L_{y}}\int _{0}^{L_{x}}I_{0<|Ri_{f}|\leqslant 0.1}(\cdot )(\boldsymbol{x},t)\,\text{d}x\,\text{d}y}{\displaystyle \int _{0}^{L_{y}}\int _{0}^{L_{x}}I_{0<|Ri_{f}|\leqslant 0.1}\,\text{d}x\,\text{d}y},\end{eqnarray}$$
where the subscript
 $l$
distinguishes the quantities
 $(\cdot )$
in the low-
 $|Ri_{f}|$
regions and
 $I$
is the indicator function previously defined in (5.1). The conditional mean profiles for the high-
 $|Ri_{f}|$
regions, denoted by a subscript
 $h$
, follow the similar definition as (6.2) but with the indicator function criteria
 $I_{|Ri_{f}|>0.1}$
. Thus, the conditional mean and variance profiles are related to the area fraction
 $\unicode[STIX]{x1D70C}$
by
 $$\begin{eqnarray}\displaystyle & \displaystyle \overline{u}(z)=\unicode[STIX]{x1D70C}\overline{u}_{l}+(1-\unicode[STIX]{x1D70C})\overline{u}_{h}, & \displaystyle\end{eqnarray}$$
 $$\begin{eqnarray}\displaystyle & \displaystyle \overline{u^{\prime }u^{\prime }}(z)=\unicode[STIX]{x1D70C}\overline{(u^{\prime }u^{\prime })}_{l}+(1-\unicode[STIX]{x1D70C})\overline{(u^{\prime }u^{\prime })}_{h}-2\unicode[STIX]{x1D70C}(1-\unicode[STIX]{x1D70C})\overline{u}_{l}\overline{u}_{h}, & \displaystyle\end{eqnarray}$$
 $$\begin{eqnarray}\displaystyle \overline{(u^{\prime }u^{\prime })}_{l}\equiv \overline{u_{l}^{2}}-\unicode[STIX]{x1D70C}(\overline{u}_{l})^{2}\quad \text{and}\quad \overline{(u^{\prime }u^{\prime })}_{h}\equiv \overline{u_{h}^{2}}-(1-\unicode[STIX]{x1D70C})(\overline{u}_{h})^{2}. & & \displaystyle\end{eqnarray}$$
The low-
 $|Ri_{f}|$
mean velocity and temperature profiles are shown by the solid curves in figure 7(c,d), respectively, whereas the overall mean profiles are redrawn as dashed lines. The conditional mean profiles of the low-
 $|Ri_{f}|$
regions are clearly different from the overall mean profiles of VC. The conditional mean velocity profiles (figure 7
c) exhibit steeper slopes close to the wall and also larger maxima. These two observations imply that the local boundary layer in the low-
 $|Ri_{f}|$
region is more vigorously animated by a turbulent wind as compared to the overall boundary layer. However, the conditional mean profiles still do not exhibit the log profile according to (6.1a
). The absence of the log profile suggests that for the present
 $Ra$
range, we would not expect the
 $Re\sim Ra^{1/2}$
-ultimate regime scaling as predicted according to Grossmann & Lohse (Reference Grossmann and Lohse2011).
In contrast, the conditional mean temperature profiles (figure 7
d) exhibit some degree of collapse at higher
 $Ra$
between
 $30\lesssim z^{+}\lesssim 80$
which agrees with the log-linear slope of (6.1b
) with
 $B\,=\,5.1$
(see blue straight dashed line). This collapse is interesting because it suggests that locally, the thermal boundary layers are log dependent on the wall-normal distance as assumed by Grossmann & Lohse (Reference Grossmann and Lohse2011, Reference Grossmann and Lohse2012) for turbulent thermal convection.
With reference to figure 7, we emphasise that we perform a direct comparison with the log laws of the wall. For the mean velocity profiles, we envision that the profiles will eventually exhibit the log law once a wider separation of scales is achieved at very high
 $Ra$
. As an example of sufficient scale separation, we refer to the mean streamwise velocity profile of the wall jet flow (Wygnanski, Katz & Horev Reference Wygnanski, Katz and Horev1992; Eriksson et al.
Reference Eriksson, Karlsson and Persson1998). The mean velocity profiles of the wall jet flow are statistically similar to the mean streamwise velocity profile of VC, but have been shown to exhibit the log law of the wall. As a comparison, we include a candidate mean streamwise velocity profile from the wall jet flow of Eriksson et al. (Reference Eriksson, Karlsson and Persson1998) in figure 7(c), see red curve with open symbols. The wall jet profile exhibits a higher maxima compared to the VC profile at
 $Ra=10^{9}$
and agrees well with the log law of the wall. Therefore, from the perspective of classical dimensional arguments of the ‘inner’ and ‘outer layer’ (Pope Reference Pope2000, chap. 7), we infer that the outer layer of VC corresponds to the location near the maxima of the streamwise velocity, as opposed to the region close to the channel centre. The log profiles in VC are also expected since similar trends have also been measured for RBC and Taylor–Couette flows, but in different regions of the flow. In the ultimate regime of RBC, the temperature log profile was found in the bulk flow region (Ahlers et al.
Reference Ahlers, Bodenschatz, Funfschilling, Grossmann, He, Lohse, Stevens and Verzicco2012; Wei & Ahlers Reference Wei and Ahlers2014), whereas in the classical regime of RBC, the log profile was found in high-
 $|Ri_{f}|$
regions where thermal plumes are emitted (van der Poel et al.
Reference van der Poel, Ostilla-Mónico, Verzicco, Grossmann and Lohse2015). In Taylor–Couette flows, a log profile was found in the azimuthal velocity profile in plume emission regions, as well as in the (appropriately shifted) overall angular velocity profile (Ostilla-Mónico et al.
Reference Ostilla-Mónico, van der Poel, Verzicco, Grossmann and Lohse2014).
For comparison, we also include the conditional mean profiles of the high-
 $|Ri_{f}|$
regions in figure 7(e,f). The mean profiles are lower in magnitude than the overall profiles, which can be attributed to a weaker influence of the turbulent wind in the high-
 $|Ri_{f}|$
regions. In addition, the mean temperature profiles exhibit some degree of collapse but does not fit the log-linear trend of (6.1b
).
7 Scaling of local
$Nu$
and
$Re$


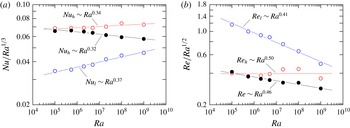
Compensated plots for (a)
 $Nu$
and (b)
 $Re$
. Black symbols denote the overall
 $Nu$
and
 $Re$
results, blue symbols denote the higher-shear, low-
 $|Ri_{f}|$
results and red symbols denote the lower-shear, high-
 $|Ri_{f}|$
results. All curve fits are from a least-squares fit to an effective power law.

We can further test the characteristics of the low-/high-
 $|Ri_{f}|$
regions in VC by computing the local Nusselt and Reynolds number trends in the corresponding regions. Within the low-
 $|Ri_{f}|$
regions, the local Nusselt number and Reynolds number are defined respectively as
 $$\begin{eqnarray}\displaystyle Nu_{l}\equiv \frac{f_{w,l}H}{\unicode[STIX]{x0394}\unicode[STIX]{x1D705}}\quad \text{and}\quad Re_{l}\equiv \frac{U_{rms,l}H}{\unicode[STIX]{x1D708}}, & & \displaystyle\end{eqnarray}$$
where
 $f_{w,l}\equiv -\unicode[STIX]{x1D705}(\text{d}\overline{\unicode[STIX]{x1D6E9}}_{l}/\text{d}z)|_{w}$
. To define the local Reynolds number, we define
 $U_{rms,l}$
as the local turbulent wind, where the subscript rms denotes the root-mean-square quantity, and adopt (6.4) to compute the local velocity fluctuations. Therefore, we define
 $U_{rms,l}\equiv [\overline{(u^{\prime }u^{\prime })}_{l}]^{1/2}$
evaluated at the wall-normal location
 $z=\unicode[STIX]{x1D6FF}_{max,l}$
, where
 $\unicode[STIX]{x1D6FF}_{max,l}$
is the wall-normal distance to the maximum of
 $\overline{u}_{l}$
. The local Nusselt and Reynolds numbers in the high-
 $|Ri_{f}|$
regions follow the definition in (7.1) with the corresponding high-
 $|Ri_{f}|$
quantities. The overall Nusselt and Reynolds numbers are defined using the overall
 $f_{w}$
and
 $U_{rms}$
. The results of the scaling of the Nusselt and Reynolds numbers are shown in figure 8.
In figure 8, we emphasise the scaling of the Nusselt and Reynolds numbers by plotting the trends in compensated forms, i.e.
 $Nu/Ra^{1/3}$
versus
 $Ra$
and
 $Re/Ra^{1/2}$
versus
 $Ra$
. The overall
 $Nu$
and
 $Re$
are denoted by solid black symbols,
 $Nu_{l}$
and
 $Re_{l}$
by open blue circles and
 $Nu_{h}$
and
 $Re_{h}$
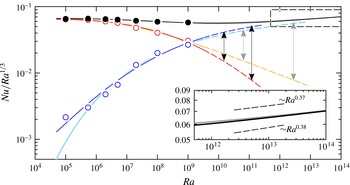
by open red circles. Starting with the scaling of the local Nusselt number (figure 8
a), we find that
 $Nu_{l}\sim Ra^{0.37}$
from a least-squares fit to an effective power law, which is steeper than the relation
 $Nu\sim Ra^{0.32}$
for the overall Nusselt number (Ng et al.
Reference Ng, Ooi, Lohse and Chung2015). Interestingly, the effective scaling exponent computed for the low-
 $|Ri_{f}|$
regions, which is
 $0.37$
, is close to the exponent reported by He et al. (Reference He, Funfschilling, Nobach, Bodenschatz and Ahlers2012) in their experiments for RBC at large
 $Ra$
, which is
 $0.38$
. This result appears consistent with the predictions of the Nusselt number scaling relation of a
 $1/2$
power-law scaling with logarithmic corrections in the ultimate regime (Grossmann & Lohse Reference Grossmann and Lohse2011). For VC, the logarithmic corrections for the effective scaling of
 $Nu_{l}$
are associated with the log-linear slope of the conditional mean temperature profile in the high-shear, low-
 $|Ri_{f}|$
regions (see figure 7
d). On the other hand, the scaling of
 $Nu_{h}$
follows
 $Nu_{h}\sim Ra^{0.34}$
which is steeper than the scaling for overall
 $Nu$
but is still less steep compared to the scaling of
 $Nu_{l}$
.
We note that the local scaling of the Nusselt number is sensitive to the upper limit of the
 $|Ri_{f}|$
criterion established in § 4. For a higher limit, the conditional mean statistics of the higher-shear regions are contaminated by the laminar-like lower-shear regions (see the Appendix) and as a result, the effective
 $Ra$
-scaling exponent of the local Nusselt number is closer to the global
 $0.31$
exponent. For example, the effective
 $Ra$
-scaling exponent for
 $Nu_{l}$
is approximately
 $0.33$
using
 $0<|Ri_{f}|\leqslant 0.5$
and is approximately
 $0.39$
using
 $0<|Ri_{f}|\leqslant 0.05$
. In the former, the scaling exponent of
 $0.33$
is closer to
 $0.31$
, whereas in the latter, the scaling exponent of
 $0.39$
is clearly steeper than
 $0.31$
and is consistent with the scaling exponent reported by He et al. (Reference He, Funfschilling, Nobach, Bodenschatz and Ahlers2012).
For the scaling of the Reynolds numbers (figure 8
b), we find that
 $Re_{l}\sim Ra^{0.41}$
,
 $Re_{h}\sim Ra^{0.50}$
and
 $Re\sim Ra^{0.46}$
. Based on the much lower effective scaling exponent for
 $Re_{l}$
, it is clear that the Reynolds number in the high-shear regions do not exhibit the
 $1/2$
power-law ultimate regime scaling as predicted in GL theory (Grossmann & Lohse Reference Grossmann and Lohse2011). However, this result is not surprising since the conditional mean velocity profiles for the low-
 $|Ri_{f}|$
regions (see figure 7
c) do not exhibit the log-linear profile of (6.1a
), which is assumed for fully turbulent thermal convection (Grossmann & Lohse Reference Grossmann and Lohse2011) and is a key assumption of the GL theory for the
 $Re$
-scaling in the ultimate regime.
Relative contributions of the local Nusselt numbers with increasing
 $Ra$
. The solid black symbols denote the overall
 $Nu$
, the blue symbols denote
 $\unicode[STIX]{x1D70C}Nu_{l}$
and the red symbols denote
 $(1-\unicode[STIX]{x1D70C})Nu_{h}$
. The blue and red curves represents
 $\unicode[STIX]{x1D70C}_{fit,1}Ra^{0.37}$
and
 $(1-\unicode[STIX]{x1D70C}_{fit,2})Ra^{0.34}$
, respectively, and the sum equals to the black curve. The cyan and orange curves represent
 $\unicode[STIX]{x1D70C}_{fit,2}Ra^{0.37}$
and
 $(1-\unicode[STIX]{x1D70C}_{fit,2})Ra^{0.34}$
, respectively, and the sum equals to the grey curve. The inset plot compares the extrapolated curves in the dashed box with the
 $Ra$
-scaling exponent of 0.37 and 0.38. The trends indicate that the contributions from
 $Nu_{l}$
dominate the contributions from
 $Nu_{h}$
with increasing
 $Ra$
.

Based on our results in figure 8(a) for the effective scaling exponents of
 $Nu_{l}$
and
 $Nu_{h}$
, we estimate the relative contributions of
 $Nu_{l}$
and
 $Nu_{h}$
by making use of the relation
 $$\begin{eqnarray}Nu=\unicode[STIX]{x1D70C}Nu_{l}+(1-\unicode[STIX]{x1D70C})Nu_{h},\end{eqnarray}$$
which can be derived using the conditional averaging procedure described by (6.2). We then model the two terms on the right-hand side of (7.2) using both curve fits (5.2) and (5.3), and the effective power-law curve fits for
 $Nu_{l}$
and
 $Nu_{h}$
from figure 8(a), thus,
 $$\begin{eqnarray}\displaystyle \unicode[STIX]{x1D70C}Nu_{l}\sim \unicode[STIX]{x1D70C}_{fit}Ra^{0.37}\quad \text{and}\quad (1-\unicode[STIX]{x1D70C})Nu_{h}\sim (1-\unicode[STIX]{x1D70C}_{fit})Ra^{0.34}. & & \displaystyle\end{eqnarray}$$
The two modelled terms on the right-hand side of (7.3) are plotted in figure 9, where the blue–red lines correspond to
 $\unicode[STIX]{x1D70C}_{fit,1}$
and the cyan–orange lines correspond to
 $\unicode[STIX]{x1D70C}_{fit,2}$
. The blue and red symbols in figure 9 correspond to the results from our DNS, i.e. the left-hand side of (7.3), respectively. The solid black symbols are the overall
 $Nu$
-values, which are exactly equal to the sum of the values denoted by the blue and red symbols.
From figure 9, we find that the contribution of
 $\unicode[STIX]{x1D70C}Nu_{l}$
increases with increasing
 $Ra$
, as expected. When we extrapolate the two modelled terms in (7.3), shown by the dashed lines in figure 9, the contribution from
 $Nu_{l}$
dominates the contribution from
 $Nu_{h}$
at higher
 $Ra$
. For instance, the ratio of
 $\unicode[STIX]{x1D70C}Nu_{l}$
to
 $(1-\unicode[STIX]{x1D70C})Nu_{h}$
for
 $\unicode[STIX]{x1D70C}_{fit,1}$
ranges from approximately 3 to 7 between
 $Ra\approx 1.5\times 10^{10}$
to
 $1.2\times 10^{11}$
(black arrows in figure 9) and, coincidently for
 $\unicode[STIX]{x1D70C}_{fit,2}$
, also ranges from approximately 3 to 7 between
 $Ra\approx 6.5\times 10^{10}$
to
 $2.8\times 10^{12}$
(grey arrows in figure 9). The two pairs of
 $Ra$
-values correspond to the estimated
 $80\,\%$
–
 $90\,\%$
of the near-wall area that are presumably covered by the streaky, higher-shear regions (cf. § 5). For the sake of obtaining estimates, we further extrapolate the sum of the modelled terms from (7.3) and the trends are shown as solid black and solid grey curves in figure 9. At
 $Ra\gtrsim 10^{13}$
, the slope of the two extrapolated trends become comparable to the
 $Ra$
-scaling exponent of between 0.37 and 0.38 (see inset of figure 9), which is expected since the relative contribution of
 $(1-\unicode[STIX]{x1D70C})Nu_{h}$
diminishes at very high-
 $Ra$
.
For standard RBC, Shang, Tong & Xia (Reference Shang, Tong and Xia2008) performed a similar decomposition of the heat transfer, namely in a plume-dominated part
 $Nu_{pl}\sim Ra^{0.24}$
and a bulk-dominated part
 $Nu\sim Ra^{0.49}$
, with the bulk part gaining dominance beyond
 $Ra_{c}\approx 10^{14}$
(see also Shang et al.
Reference Shang, Qiu, Tong and Xia2003; Grossmann & Lohse Reference Grossmann and Lohse2004). The much lower
 $Ra$
-values for when the ultimate regime scaling dominates in VC as compared to standard RB (where it is
 $Ra_{c}\approx 10^{14}$
) may be associated with the more efficient driving in the VC configuration since gravity is parallel to the walls in VC, whereas gravity is orthogonal to the walls in RBC. For the shear-driven Taylor–Couette flow, the driving is even more efficient and the transition to the ultimate regime occurs at the Taylor number
 $Ta_{c}\simeq 3\times 10^{8}$
for an inner-to-outer radius ratio of 0.71 (Grossmann, Lohse & Sun Reference Grossmann, Lohse and Sun2016).
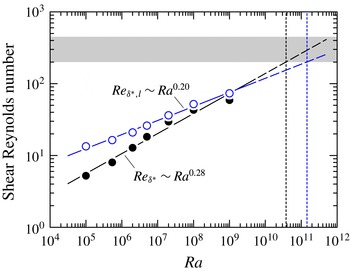
In figure 10, we compute the shear Reynolds number based on the displacement thickness
 $\unicode[STIX]{x1D6FF}^{\ast }$
according to the definition
 $Re_{\unicode[STIX]{x1D6FF}^{\ast }}\equiv U\unicode[STIX]{x1D6FF}^{\ast }/\unicode[STIX]{x1D708}$
for the low-
 $|Ri_{f}|$
and overall regions. For the low-
 $|Ri_{f}|$
regions, we define
 $U\equiv \text{max}(\overline{u}_{l})$
and
 $\unicode[STIX]{x1D6FF}^{\ast }\equiv \int _{0}^{\unicode[STIX]{x1D6FF}_{max,l}}(1-\overline{u}_{l}/\text{max}(\overline{u}_{l}))\,\text{d}z$
. For the overall shear Reynolds number, we define
 $U\equiv \text{max}(\overline{u})$
and
 $\unicode[STIX]{x1D6FF}^{\ast }\equiv \int _{0}^{\unicode[STIX]{x1D6FF}_{max}}(1-\overline{u}/\text{max}(\overline{u}))\,\text{d}z$
. At some critical value, the shear Reynolds number can provide an indication of the laminar-to-turbulent transition (for example,
 $(Re_{\unicode[STIX]{x1D6FF}^{\ast }})_{cr}\approx 420$
Landau & Lifshitz Reference Landau and Lifshitz1987). However, since the theoretical value for the critical shear Reynolds number is presently unknown for VC, we choose a range of
 $Re_{\unicode[STIX]{x1D6FF}^{\ast }}$
from 200 to 450 as an approximate indicator for the transition to turbulence in VC. This range is shown as the grey region in figure 10. The results from the low-
 $|Ri_{f}|$
regions are denoted by the open blue circles and the results from the overall regions are denoted by the solid black circles. The associated effective power-law fits are
 $Re_{\unicode[STIX]{x1D6FF}^{\ast },l}\approx 1.3Ra^{0.20}$
(blue line) and
 $Re_{\unicode[STIX]{x1D6FF}^{\ast }}\approx 0.23Ra^{0.28}$
(black line).
Plots of shear Reynolds number versus
 $Ra$
. The blue circles denote the low-
 $|Ri_{f}|$
shear Reynolds number (
 $Re_{\unicode[STIX]{x1D6FF}^{\ast },l}$
) whereas the solid black circles denote the overall shear Reynolds number (
 $Re_{\unicode[STIX]{x1D6FF}^{\ast }}$
). The grey region indicates the range of the shear Reynolds number between 200 and 450. At the shear Reynolds number value of 200, the
 $Ra$
-value is estimated to be
 $1.5\times 10^{11}$
for the low-
 $|Ri_{f}|$
shear Reynolds number and
 $3.8\times 10^{10}$
for the overall shear Reynolds number (demarcated by the dotted lines).

From figure 10, we find that
 $Re_{\unicode[STIX]{x1D6FF}^{\ast },l}$
is larger than
 $Re_{\unicode[STIX]{x1D6FF}^{\ast }}$
for the present
 $Ra$
-range of our DNS dataset. By extrapolating the power-law fits (dashed lines in figure 10), we find that at the shear Reynolds number value of 200, the
 $Ra$
-value is estimated to be
 ${\approx}3.8\times 10^{10}$
for the overall region and
 ${\approx}1.5\times 10^{11}$
for the low-
 $|Ri_{f}|$
region. Both
 $Ra$
-values appear consistent with the
 $Ra$
-values estimated when the values of the turbulent fraction
 $\unicode[STIX]{x1D70C}=0.8$
and
 $0.9$
(see figure 6). Conservatively, our results suggest that we could expect the ultimate regime in VC to occur at
 $Ra\gtrsim 10^{11}$
. Physically, the near-wall region is expected to be dominated by streaky, high-shear regions, however, further investigations at much higher
 $Ra$
are necessary in order to verify this hypothesis.
8 Conditional spectra
In this section, we investigate the similarities between the near-wall structures in VC and in a canonical wall-bounded flow set-up. In particular, we look for evidence of buffer-region features in the near-wall region of VC, which would suggest that the VC flow is transitioning to the ultimate regime with log variations in the mean profile. Our basis of comparison is the unique structural features in the buffer region of the flow at
 $z^{+}\approx 15$
, i.e. before the start of the log law of the wall. The features in this region are commonly referred to as near-wall streaks (Kline et al.
Reference Kline, Reynolds, Schraub and Runstadler1967; Hutchins & Marusic Reference Hutchins and Marusic2007a
; Marusic et al.
Reference Marusic, McKeon, Monkewitz, Nagib, Smits and Sreenivasan2010). In canonical wall-bounded flows, the near-wall streaks are robust features of the buffer region: they are found at every location in the wall-parallel plane
 $z^{+}\approx 15$
, contribute to the peak in streamwise velocity fluctuations and exhibit a characteristic spanwise spacing of
 $\unicode[STIX]{x1D706}_{y}^{+}\approx 100$
. Here,
 $\unicode[STIX]{x1D706}_{y}=2\unicode[STIX]{x03C0}k_{y}^{-1}$
the spanwise wavelength. In the following, we conduct a detailed comparison between VC and canonical channel flow with the aid of the one-dimensional spectrum.
We define the one-dimensional energy spectrum of streamwise velocity
 $u$
as
 $E_{uu}(k_{j})$
, where
 $(u^{\prime })^{2}=2\int _{0}^{\infty }E_{uu}(k_{j})\,\text{d}k_{j}$
,
 $k_{j}$
is the wavenumber in the
 $j$
th direction and
 $j=1,2$
. Thus,
 $k_{1}=k_{x}$
the streamwise wavenumber and
 $k_{2}=k_{y}$
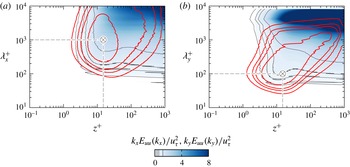
the spanwise wavenumber. As a reference, we first plot the overall spectra of
 $u$
for VC at
 $Ra=10^{9}$
in figure 11, shown as filled blue contours. Following Hutchins & Marusic (Reference Hutchins and Marusic2007a
), we plot the energy spectra at all wall-normal locations in premultiplied form, i.e.
 $k_{x}E_{uu}(k_{x})$
versus
 $\unicode[STIX]{x1D706}_{x}=2\unicode[STIX]{x03C0}k_{x}^{-1}$
the streamwise wavelength (figure 11
a) and
 $k_{y}E_{uu}(k_{y})$
versus
 $\unicode[STIX]{x1D706}_{y}=2\unicode[STIX]{x03C0}k_{y}^{-1}$
the spanwise wavelength (figure 11
b). In premultiplied form and on a logarithmic plot, the contours of the energy spectra visually represent the distribution of energy that resides at the corresponding wavelengths (similar to the representation of
 $|Ri_{f}|$
-distribution in figure 4
b). The plotted spectra are normalised by
 $u_{\unicode[STIX]{x1D70F}}^{2}$
.
One-dimensional premultiplied overall spectra of
 $u$
for
 $Ra=10^{9}$
shown as blue contours: (a) streamwise direction and (b) spanwise direction. The red contours are the spectra from DNS of channel flow at
 $Re_{\unicode[STIX]{x1D70F}}\approx 934$
(cf. del Álamo et al.
Reference del Álamo, Jiménez, Zandonade and Moser2004). For both VC and channel flow spectra, the contour levels are fixed at
 $0.2$
(outermost),
 $0.4$
,
 $0.6$
and
 $1.2$
(indicated by the thinner lines in the colour bar). The
 $\otimes$
symbols denote the inner sites of channel flow spectra, which are respectively at (
 $z_{p}^{+}$
,
 $\unicode[STIX]{x1D706}_{x,p}^{+}$
)
 ${\approx}$
(
 $15$
,
 $1000$
) and (
 $z_{p}^{+}$
,
 $\unicode[STIX]{x1D706}_{y,p}^{+}$
)
 ${\approx}$
(
 $15$
,
 $100$
).

In figure 11, the contours of the spectra for VC appear unclosed and this is because the peak of the spectra occurs at the peak of
 $u_{rms}$
, which is at the channel centre (see for example figure 3(a) in Ng et al.
Reference Ng, Ooi, Lohse and Chung2015). In addition, the unclosed spectra indicate that the longest energy containing wavelengths in VC exceed the streamwise and spanwise domain lengths of the present set-up at
 $Ra=10^{9}$
. Therefore, for higher
 $Ra$
, it would be necessary to conduct simulations in the periodic domain sizes that are larger than
 $L_{x}\times L_{y}=8H\times 4H$
in each direction if a higher degree of convergence is desired. Nevertheless, for the subsequent analysis into structure of the streaky regions, the choice of a larger periodic domain size would qualitatively give the same results.
To compare the distribution of spectra for VC, we include the spectra from DNS of channel flow at the friction Reynolds number
 $Re_{\unicode[STIX]{x1D70F}}\equiv u_{\unicode[STIX]{x1D70F}}\unicode[STIX]{x1D6FF}/\unicode[STIX]{x1D708}\approx 934$
(cf. del Álamo et al.
Reference del Álamo, Jiménez, Zandonade and Moser2004), where
 $\unicode[STIX]{x1D6FF}$
is the channel half-width, in figure 11. The channel flow spectra are shown as red contours. In contrast to VC, the spectra of channel flow exhibit peaks in the near-wall region at
 $(z_{p}^{+},\unicode[STIX]{x1D706}_{x,p}^{+})\approx (15,1000)$
and
 $(z_{p}^{+},\unicode[STIX]{x1D706}_{y,p}^{+})\approx (15,100)$
. These intense near-wall energies in channel flow correspond to the ‘inner’ sites and are well-known characteristics of the near-wall streaks (cf. Hutchins & Marusic Reference Hutchins and Marusic2007a
,Reference Hutchins and Marusic
b
). For reference, we mark the inner sites by the symbol
 $\otimes$
in figure 11. When we compare the spectra of VC and channel flow, we find little resemblance between the shape of the streamwise spectra of VC and channel flow. However, the shape of the spanwise spectra of VC and channel flow exhibit some similarities in the near-wall region: the contour of the channel flow spectra at
 $k_{y}E_{uu}(k_{y})/u_{\unicode[STIX]{x1D70F}}^{2}=1.2$
envelops the contour of the spectra for VC at
 $k_{y}E_{uu}(k_{y})/u_{\unicode[STIX]{x1D70F}}^{2}=0.2$
. This similarity between the spanwise spectra in the near-wall region suggests that it may be possible to distinguish near-wall regions that exhibit characteristics similar to canonical wall-bounded turbulence. Thus, our aim is to analyse the local spectra of
 $u$
in the low- and high-
 $|Ri_{f}|$
regions (cf. § 4) that exhibit the streaky and non-streaky regions, respectively.
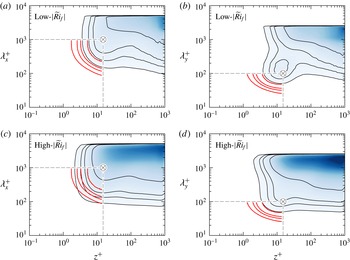
One-dimensional premultiplied conditional spectra of
 $u$
for
 $Ra=10^{9}$
shown as blue contours: (a,c) streamwise direction and (b,d) spanwise directions. (a,b) Low-
 $|\widetilde{Ri}_{f}|$
(
 $0<|\widetilde{Ri}_{f}|\leqslant 0.1$
) spectra for higher-shear regions. (c,d) High-
 $|\widetilde{Ri}_{f}|$
(
 $|\widetilde{Ri}_{f}|>0.1$
) spectra for lower-shear regions. The red contours are spectra from DNS of channel flow at
 $Re_{\unicode[STIX]{x1D70F}}\approx 934$
(cf. del Álamo et al.
Reference del Álamo, Jiménez, Zandonade and Moser2004), where only the contour levels in the near-wall region and shorter wavelengths are shown for clarity. The colour maps and contour levels are the same as figure 11. The
 $\otimes$
symbols denote the inner sites of channel flow spectra, which are respectively at
 $(z_{p}^{+},\unicode[STIX]{x1D706}_{x,p}^{+})\approx (15,1000)$
and
 $(z_{p}^{+},\unicode[STIX]{x1D706}_{y,p}^{+})\approx (15,100)$
.

In order to obtain the local spectra of
 $u$
, we first need to define the domain lengths of a local streamwise–spanwise patch. In doing so, we restrict our analysis of the local spectra of
 $u$
to a patch that is associated with either low- or high-
 $|Ri_{f}|$
. As a starting point, we choose the domain lengths of the local patch as
 $2H\times H$
in the streamwise and spanwise directions. A patch is defined as locally shear dominated if the plane-averaged value of
 $|Ri_{f}|$
in the local patch, which we denote by
 $|\widetilde{Ri}_{f}|$
, is between
 $0$
and
 $0.1$
, thus maintaining consistency with our criterion defined in § 4. From this definition, we obtain two conditionally averaged spectra for each direction: one for a (patch-averaged) higher-shear region, i.e. low-
 $|\widetilde{Ri}_{f}|$
, and another for a (patch-averaged) lower-shear region, i.e. high-
 $|\widetilde{Ri}_{f}|$
.
Next, since the local
 $u$
is not spatially periodic in the
 $x$
- and
 $y$
-directions, we introduce periodicity by applying a normalised Hann window
 $W(x_{i})=\sqrt{2/3}[1-\cos (2\unicode[STIX]{x03C0}n_{i}/N_{x_{i}})]$
(cf. Chung & McKeon Reference Chung and McKeon2010) in the
 $x$
- and
 $y$
-directions of the patch. This step is necessary in order to minimise spectral leakage when computing the spectra of a non-periodic local signal of
 $u$
. Here,
 $N_{x_{i}}$
is the number of grid points in the
 $x_{i}$
direction and
 $n_{i}=1,\ldots ,N_{x_{i}}$
. This procedure is repeated at all wall-normal locations of the patch. The computed local spectra are then normalised by the local patch-averaged friction velocity
 $\widetilde{u}_{\unicode[STIX]{x1D70F}}$
before averaging. Figure 12 shows the results for the conditionally averaged spectra at
 $Ra=10^{9}$
, normalised by
 $\widetilde{u}_{\unicode[STIX]{x1D70F}}^{2}$
. For clarity, we compare our results with the channel flow spectra for
 $z^{+}\leqslant 15$
,
 $\unicode[STIX]{x1D706}_{x}^{+}\leqslant 1000$
and
 $\unicode[STIX]{x1D706}_{y}^{+}\leqslant 100$
.
Interestingly, when we closely inspect the contours of the low-
 $|\widetilde{Ri}_{f}|$
spectra of VC (figure 12
a,b), we find that the shape of both streamwise and spanwise spectra have a relatively higher degree of resemblance with the spectra of channel flow compared to the contours in figure 11. The magnitude of the spectra of VC remains lower than the magnitude of the channel flow spectra. We also note the presence of a prominent near-wall peak in the spanwise conditional spectra of VC occurring at
 $z_{p,VC}^{+}\approx 15$
and
 $\unicode[STIX]{x1D706}_{y,p,VC}^{+}\approx 150$
(see figure 12
b), which is close to the inner site of the channel flow spectra. Additionally, the value of the peak spanwise wavelength in VC is consistent with the spanwise spacing of the streaks of approximately
 $100$
to
 $200$
viscous units observed in figure 3. These notable similarities between VC and turbulent channel flow imply that some form of the near-wall streaks is also locally present in VC, but the intensities of the streaks are dominated by the energy of considerably larger scales. From our dataset, we find that the near-wall similarities (both in spectra and flow visualisations) emerge at
 $Ra\gtrsim 2\times 10^{7}$
. This suggests that for the present
 $Ra$
-range, the VC flow is undergoing a transition to a regime where the boundary layers are increasingly influenced by stronger shear, which is consistent with our findings in the preceding sections.
For the conditionally averaged high-
 $|\widetilde{Ri}_{f}|$
spectra of VC (figure 12
c,d), the shape of the contours retain characteristics that are similar to the unconditioned spectra of VC in figure 11. Namely, the shape of the streamwise spectra of VC differs from the streamwise spectra of channel flow whereas the spanwise contours retain the resemblance in shape but without a near-wall peak.
9 Summary and conclusion
The boundary layers in VC with
 $Ra$
ranging between
 $10^{5}$
and
 $10^{9}$
and
 $Pr$
-value of
 $0.709$
are found to exhibit characteristics of a transition from a laminar-like scaling to a turbulent ultimate-regime-type behaviour.
Visually, the near-wall flow shows the emergence of two distinct regions with increasing
 $Ra$
(figure 2). The first region appears streaky and correlates with higher-shear regions, whereas the second region is not streaky and correlates with lower-shear regions. The two regions are well described by a flux Richardson number criterion where low-
 $|Ri_{f}|$
regions correspond to the streaky regions and high-
 $|Ri_{f}|$
regions correspond to the non-streaky regions (figure 5). With increasing
 $Ra$
, the streaky low-
 $|Ri_{f}|$
regions occupy increasingly larger fractions of the wall area (figure 6). This result suggests that the transition from the classical regime to the ultimate regime in VC manifests in the boundary layers as increasingly larger wall-area coverage of shear-dominated regions. Based on the trend of the increasing shear-dominated wall areas, we estimate that at
 $Ra\gtrsim 10^{11}$
the boundary layers of VC are expected to be dominated by the streaky higher-shear structures for the
 $Pr$
-value of this study.
On further analysis, we find that the local statistics in the streaky low-
 $|Ri_{f}|$
regions exhibit trends that agree with turbulent boundary layer behaviour. In particular, the conditionally averaged mean temperature profiles of the low-
 $|Ri_{f}|$
regions show good agreement with the log-linear slope of the log law of the wall for mean temperature (figure 7
d). No log-linear trends are found in the low-
 $|Ri_{f}|$
conditional mean velocity profiles, both high-
 $|Ri_{f}|$
conditional mean velocity and temperature profiles, and the overall unconditioned mean velocity and temperature profiles.
In the streaky low-
 $|Ri_{f}|$
regions, the local Nusselt and Reynolds number follow an effective power scaling of
 $Nu_{l}\sim Ra^{0.37}$
and
 $Re_{l}\sim Ra^{0.41}$
(figure 8). The effective scaling exponent of
 $0.37$
for
 $Nu_{l}$
appears consistent with the logarithmically corrected
 $1/2$
power-law scaling predictions of the Nusselt number scaling relation in the ultimate regime. Additionally, the contributions from the Nusselt number in low-
 $|Ri_{f}|$
regions increasingly dominate the contributions from the high-
 $|Ri_{f}|$
regions (figure 9), which suggests that at sufficiently high
 $Ra$
, the VC flow undergoes a transition to the ultimate regime presumably with
 $Nu\sim Ra^{0.37}$
. In contrast, the effective scaling exponent of
 $0.41$
for
 $Re_{l}$
is lower than the
 $1/2$
power-law scaling predictions for the Reynolds number scaling relation in the ultimate regime. The lower exponent in the
 $Re_{l}$
scaling may be attributed to the local wind not being sufficiently strong to animate the turbulent boundary layers in the sense of Prandtl and von Kármán, as shown by the absence of a logarithmic variation in the low-
 $|Ri_{f}|$
conditional mean velocity profiles (figure 7
c). Indeed, investigations at much higher
 $Ra$
are necessary in order to determine incipient logarithmic variations in the mean velocity and temperature profiles, and how the local effective power-law scalings for Nusselt and Reynolds number in higher-shear regions are affected.
Finally, a comparison of our VC data and turbulent channel flow data at matched friction Reynolds number
 $Re_{\unicode[STIX]{x1D70F}}$
reveals that the streaky regions in VC are reminiscent of the near-wall streaks in canonical wall-bounded flows. We find that a near-wall peak is present in the conditional low-
 $|Ri_{f}|$
spectra of VC in the spanwise direction (figure 12
b). The corresponding wall-normal location is
 $z_{p,VC}^{+}\approx 15$
with a spanwise spacing of approximately 150 viscous length scales. This near-wall peak in the spectra of VC not only resembles the inner site of the spectra of turbulent channel flow, but the spanwise spacing of 150 viscous length scales is also consistent with the well-known spanwise Kline spacings of 100 viscous length scales in turbulent wall-bounded flows (see figure 3
b,d).
Collectively, the results of the local logarithmic variation in the mean temperature profile, higher exponent scaling for the Nusselt number and characteristics of the near-wall streaks suggest that the boundary layer in VC is undergoing a transition from the classical regime to an ultimate regime for the present
 $Ra$
range. This transition is characterised by an increasing area coverage of shear-dominated patches in the near-wall region with increasing
 $Ra$
and are consistent with the recent findings for Rayleigh–Bénard convection and Taylor–Couette flows.
Acknowledgements
This work was supported by the resources from the National Computational Infrastructure (NCI) National Facility in Canberra Australia, which is supported by the Australian Government, and the Pawsey Supercomputing Centre, which is funded by the Australian Government and the Government of Western Australia. DL acknowledges support from FOM and the Max Planck Center for Complex Fluid Dynamics (University of Twente campus).
Appendix. Sensitivity of
$|Ri_{f}|$
threshold

Plots of three Richardson number thresholds, shown as grey contours, overlaid on wall-parallel planes of streamwise velocity for
 $Ra=10^{9}$
. The thresholds are (a)
 $0<|Ri_{f}|\leqslant 0.05$
, (b)
 $0<|Ri_{f}|\leqslant 0.1$
(reproduced from figure 5
c) and (c)
 $0<|Ri_{f}|\leqslant 0.5$
. The velocity colour map is the same as in figure 2.

To illustrate the sensitivity of the
 $|Ri_{f}|$
threshold proposed in § 4, we plot the wall-area coverage for three threshold
 $|Ri_{f}|$
-values for
 $Ra=10^{9}$
in figure 13. The shaded grey contours are the higher-shear regions of interest,
 $\unicode[STIX]{x1D70C}$
, and the values are
 $\unicode[STIX]{x1D70C}\approx 0.28$
,
 $0.58$
and
 $0.92$
for
 $0<|Ri_{f}|\leqslant 0.05$
,
 $0<|Ri_{f}|\leqslant 0.1$
(used in this study) and
 $0<|Ri_{f}|\leqslant 0.5$
. Note that the values of
 $\unicode[STIX]{x1D70C}$
can also be calculated by integrating the area under the premultiplied PDF in figure 4(b) for the corresponding
 $Ra$
-value. From figure 13(c), the grey contours encompass a larger area and include portions of the lower-shear regions, in blue; the local statistics in the higher-shear regions are therefore contaminated by laminar-like lower-shear regions. In contrast, the lower threshold values (figure 13
a,b) encompass smaller areas and only parts of the higher-shear regions, in red.