Introduction
Trade plays an increasingly large role in meeting global food needs (FAO, 2015). Most people currently live in countries that are net importers of food, and increased reliance on trade has enabled many countries to improve food availability despite insufficient domestic production (Porkka et al., Reference Porkka, Kummu, Siebert and Varis2013). Implicitly, the trade of agricultural goods reflects a ‘virtual’ trade in natural resources and productive capacity. Bergmann and Holmberg (Reference Bergmann and Holmberg2016) estimate that 29% of cropland and 32% of all cropland, pasture and forest is ‘globalized’ from the perspective of consumption, meaning that it supplies the food, feed and fiber needs of another country (or multi-country region).
Against this backdrop of global integration, it can be easy to underestimate the importance of domestic production. Yet according to the US Department of Agriculture (USDA), imports represented just 19% of the US food supply, on a volume basis, in 2013 (USDA-ERS, 2017), up from 8% of food volume in the 1980s (Jerardo, Reference Jerardo2003). Increased food trade is driven by several factors. First, consumers expect to have a wide assortment of food products available year round, even though production, particularly of fresh produce, is often seasonal. Avocados and blueberries, for example, come from Central and South America during the US off-production season. Secondly, competitive advantage differs across countries, such as with frozen pre-cut foods, which are typically imported from Asia and Central America, because processing costs, including labor and capital, are more inexpensive than in the USA. Thirdly, climate requirements constrain production to particular agroecological systems, such as coffee and cacao that require tropical climates. Fourthly, and finally, consumers prefer particular products based on branding and reputation, for example, European cheese products and Mediterranean olive oils.
Although food imports are increasing, the vast majority of food in the USA still comes from domestic sources. Ironically, the flow of food products from production locations to consumption locations within the USA is not as well documented in the literature. Food production and distribution was primarily a local or regional industry before 1950, except for a few packaged foods distributed nationally through emerging regional and national grocery store chains (McLaughlin and Gómez, Reference McLaughlin, Gómez and Neff2014). Since then, rapid innovations in food production, preservation and processing, substantial investments in public and private infrastructure, and the realization of benefits associated with specialization and economies of scale have all contributed to an integrated national market for most food products (Nicholson et al., Reference Nicholson, Gómez and Gao2011; McLaughlin and Gómez, Reference McLaughlin, Gómez and Neff2014). This explains some of the aggregation observed in agriculture, such as the concentration of fresh vegetable production in the Southwest region, and the concentration of corn and soybean production in the Midwest. Network analysis of data from the US Commodity Flow Survey indicates that food moves freely between states, and the largest volumes of food flow through states with major ports and states connected to trade of cereal grains (Lin et al., Reference Lin, Quin and Konar2014). Further study of food flows suggests it may be possible to reduce the distance food travels by 50% through network optimization (Robinson et al., Reference Robinson, Shirazi, Liu and Dilkina2016). However, the Commodity Flow Survey aggregates food into just five groups, giving a very general understanding of the movement of food.
Interest in local and regional food systems has prompted the development of methods to study the potential for increased reliance on local and regional foods. Net balance approaches have been used to study potential regional self-reliance (RSR) (see, e.g., Dorward et al., Reference Dorward, Smukler and Mullinix2016; Griffin et al., Reference Griffin, Conrad, Peters, Ridberg and Tyler2015) and a variety of approaches have been taken to assess ‘foodsheds’, often incorporating the use of spatial data and geographic information systems (Horst and Goalach, Reference Horst and Gaolach2014). These food system approaches provide useful insight into the capacity to provide food within a given geographic area, ranging from a single city to a multi-state region, but they lack information on the actual geographic movement of food (Freedgood et al., Reference Freedgood, Pierce-Quiñonez and Meter2011; Horst and Goalach, Reference Horst and Gaolach2014).
Recognizing the inherent difficulty in studying food systems, the Enhancing Food Security in the Northeast (EFSNE) project deliberately took a mixed-methods approach, including analysis of publicly available secondary data, development of computational models and collection of primary data on a market basket of foods. We examined production, distribution and consumption of food in a variety of ways (see, respectively, Clancy et al., Reference Clancy, Bonanno, Canning, Cleary, Conrad, Fleisher, Gómez, Griffin, Lee, Kane and Palmer2017; Griffin et al., Reference Griffin, Peters, Fleisher, Conard, Conrad, Tichenor, McCarthy, Piltch, Resop and Saberi2018; Palmer et al., Reference Palmer, Bonanno, Clancy, Cho, Cleary and Leein this issue), sometimes considering the entire food supply and other times focusing on individual supply chains or foods. The EFSNE project originated from the notion that regional food systems might be capable of improving food security and increasing food system sustainability, delivering some of the benefits of local food systems at a larger scale (Clancy and Ruhf, Reference Clancy and Ruhf2010). Yet, in the process of studying the Northeast (defined as the 12-state region including Connecticut, Delaware, Maine, Maryland, Massachusetts, New Hampshire, New Jersey, New York, Pennsylvania, Rhode Island, Vermont and West Virginia plus the District of Columbia) food systems, we realized that individual approaches tend to leave one with a patchy understanding of how the different scales of the food system fit together into a cohesive whole.
We propose that a holistic perspective can be achieved by considering the role of regional production in a global food system. We identified six distinct roles that a product plays within the region or that the region plays in the larger food system: (a) the region is a national production center, (b) the region is a seasonally important supplier, (c) regional production and distribution is the primary scale for supplying a food, (d) the product occupies an agro-ecological niche, (e) a product is a co-product of another industry in the region, and (f) the product is marketed explicitly for its geographic provenance as a local or regional product. These roles need not be mutually exclusive, as different roles may be filled by different supply chains of the same product. Apples, for example, might be distributed nationally at the peak of the harvest season (Role B) and regionally throughout the year (Role C) while simultaneously being marketed for their local or regional provenance (Role F). The purpose of this paper is to illustrate each of these roles using examples from EFSNE project research.
Methods
Overall approach
The six roles of regional production were identified and defined through observation over the course of the EFSNE project and draw primarily from three veins of research: a net balance study of RSR, supply chain case studies of eight market basket foods (apples, cabbage, canned peaches, fluid milk, frozen broccoli, ground beef, potatoes and white and whole grain bread) and supply chain optimization models of four of these food products (apples, cabbage, fluid milk and potatoes). In addition, insights from the net-balance studies are augmented with the analysis of produce shipments and livestock inventory data. These data and the methodologies used in the examples are described below.
The logical basis for the typology revealed itself through observation and reflection and is best described in a narrative. Accordingly, each of the six roles is illustrated, in the Results and Discussion section, using one or more examples of commodities studied in the EFSNE project.
Regional self-reliance
RSR measures the potential for a region to supply the food needs of its resident population (Griffin et al., Reference Griffin, Conrad, Peters, Ridberg and Tyler2015) or its resident livestock (Conrad et al., Reference Conrad, Tichenor, Peters and Griffin2016). The RSR of the Northeast USA was studied using a net balance approach in which regional production is compared to regional consumption. Production and consumption were estimated for 89 plant- and animal-based food commodities that are both grown in the region, according to USDA statistics on agricultural production, and that are tracked in the US food supply data. For each food, a self-sufficiency percentage (S) was calculated to estimate the potential RSR for that commodity for the time period 2001–2010 (Equation 1).
 $$S_{ij} = {\rm} \left( {\displaystyle{{P_{ij}} \over {C_{ij}}}} \right){\rm} \times {\rm} 100$$
As described in Griffin et al. (Reference Griffin, Conrad, Peters, Ridberg and Tyler2015, p. 353), S equals the ratio of production (P) of commodity ‘i’ in year ‘j’ to consumption (C) of that same commodity in the same year multiplied by 100. Crop production estimates were either obtained directly from annual survey data from the USDA National Agricultural Statistics Service or state departments of agriculture. Where production data were unavailable, crop production was derived based on the crop area reported in the US Census of Agriculture and yield estimates from extension bulletins, variety trials or proxy estimates from nearby states. Livestock production estimates were obtained from survey data for milk and eggs, slaughter summaries for meat and poultry, and fisheries landings for seafood.
Consumption was calculated based on per capita food availability as reported in the US food supply data and intercensal estimates of state populations. Food supply data (also called food availability or food disappearance data) estimate the quantity of a given food commodity that enters the food supply as fresh produce or a primary processed product. Where necessary, standard USDA conversion factors were used to convert primary products, such as milled grains or dressed meats, into their farm gate equivalent. Our estimates of consumption implicitly include portions of edible food that will eventually be lost or wasted in food processing and via distribution through the retail, foodservice and consumer stages of the food supply. Complete details on the steps followed and all data sources used to calculate P and C are described in Griffin et al. (Reference Griffin, Conrad, Peters, Ridberg and Tyler2015).
The self-sufficiency/reliance percentages should be interpreted simply as the relative magnitude of production compared to consumption. They do not necessarily indicate the actual proportion of a food commodity that is sourced from regional production.
Case studies
The purpose of the market basket case studies was to describe regional and non-regional food supply chains that serve supermarkets in low-income neighborhoods in the Northeast. Eleven separate case studies were prepared as part of the research project, one for each participating store (available at https://dyson.cornell.edu/outreach/extension-bulletins/). Additionally, Park et al. (Reference Park, Gómez and Clancy2018) conducted a nuanced cross-comparison of these 11 case studies. For the purpose of this manuscript, only the cross-comparison (Park et al., Reference Park, Gómez and Clancy2018) is cited, but the interested reader can access each individual case study in the link provided above.
Assessing existing supply chains is of interest to many researchers and practitioners in the field of food systems. Contrary to production and consumption, information on product flows (from production sites to demand locations through multiple distribution channels) is often not publicly available. Therefore, our cases relied on detailed information collected via interviews with supply chain members (growers, packer-shipper, processors, transporters, wholesalers, retailers, etc.) and supplemented with publicly available data where appropriate [e.g., wholesale prices at terminal markets from USDA's Agricultural Marketing Service (AMS)]. We developed a toolkit of survey protocols, tailored to each type of supply chain business, which can be adapted to conduct future food supply chain studies in different contexts.
Our cases considered 11 supermarkets in the Northeastern USA, located in both urban and rural environments (Park et al., Reference Park, Gómez and Clancy2018). From each supermarket, we examined the supply chains of two products selected from the EFSNE market basket. Each product was studied at least twice, in that each product was represented in at least two different stores. Then, for each product, we followed the supply chains from the store to the grower(s) and identified the types of companies that participated in these chains. We collected information on an array of factors, including marketing margins, prices, quantities, distance traveled by food product, fuel use, extent of value-added activities occurring within the Northeast and elsewhere, volumes, flows, quality of relationships among supply chain participants, form of contracts and mode of transportation.
For this paper, we focus on four of the eight products considered in the case studies: apples, cabbage, fluid milk and canned peaches. This subset includes both fresh and processed foods, each of which has historically been produced in the Northeast region. We assess how these supply chains are configured and how they operate to shed light on key characteristics of product flows, in regional and non-regional food supply chains. The case studies for fresh products (apples and cabbage) take into account production seasonality.
Supply chain models
To further examine the role of regional food production, we developed and evaluated empirical models of the US supply chain for four products: fluid milk (Nicholson et al., Reference Nicholson, Gómez, Gao and Hill2015), apples (Alkhannan et al., Reference Alkhannan, Lee, Gómez and Gao2017), cabbage (Yeh et al., Reference Yeh, Nishi and Gómez2017) and potatoes (unpublished). Our analyses employ spatially-disaggregated trans-shipment models of these sectors to determine the cost-minimizing solution of these four supply chains and their associated products (e.g., fluid milk is closely related to other products such as yogurt, cream and whey protein, among others) including assembly, processing, interplant transportation and final product distribution.
Cost minimization represents the strategy and behavior of businesses in these industries given that most of these products are non-branded commodities. Because production and demand for these four products are seasonal, the models consider inter-temporal considerations and are specified for low and high production and demand seasons, employing a monthly (in the case of dairy) or quarterly time scale.
In the case of fresh products such as apples, cabbage and potatoes, the models are intertemporal to capture the changes in flows across seasons. For example, for fresh apples, the model takes into account imports from the Southern hemisphere in the spring and summer; and the fact that different varieties are produced in different regions (e.g., Red Delicious in Washington and Empire apples in the Northeast), generating inter-regional product flows to meet consumer demand for variety year round (Alkhannan et al., Reference Alkhannan, Lee, Gómez and Gao2017). For cabbage, although the majority of supply is domestic, harvest windows vary across regions depending on latitude, generating different product flows across regions (Yeh et al., Reference Yeh, Nishi and Gómez2017).
The trans-shipment models are calibrated (i.e., specified with parameters that reflect current product flows) using publicly available, spatially-disaggregated secondary data on food production, food consumption and the costs of transportation, production and processing. These data come from a variety of sources, including the US Census of Agriculture, the US Census Bureau and several commodity-specific publications from the Foreign Agricultural Service (FAS) and the Economics Research Service (ERS) of the USDA. Details on the data sources are provided in technical supplements of Nicholson et al. (Reference Nicholson, Gómez, Gao and Hill2015) and Alkhannan et al. (Reference Alkhannan, Lee, Gómez and Gao2017), and in Yeh et al. (Reference Yeh, Nishi and Gómez2017).
The supply and demand data include location of production, product composition and total quantities of final products consumed and their composition. For most storable products, consumption calculations use the concept of ‘commercial disappearance’, which compares sources (production, imports and reductions in stocks) and known uses (exports and additions to product stocks) to determine US aggregate consumption. This aggregate consumption is allocated to specific locations based on population size, with adjustments for regional differences in per capita consumption. Consumption also differs by region and is based on data from the AMS of the USDA, which reports prices and uses of agricultural commodities in the USA.
The locations of and the distances between production areas, processing facilities and demand centers for each product are adapted from various sources for multiple years, including specific industry reports, the National Agricultural Statistical Service (NASS), the AMS of the USDA, among others. Costs of production, storage and transportation are specified for apples, cabbage and potatoes, from existing crop enterprise budgets produced by Land Grant institutions. In the case of milk and dairy products, costs are specified with different functions for raw milk shipments to processing plants, processing raw milk into products, shipments of products between plants, and for distribution to final demand following Pratt et al. (Reference Pratt, Bishop, Erba, Novakovic and Stephenson1997).
These models are structured as trans-shipment problems which determine the flow of products that minimize supply chain costs. The models’ structure includes variables for production, product assembly from farms to processing or storage facilities, intermediate processes, amounts of final and intermediate products produced at processing locations, shipments of intermediate products from one processing location and plant type to another, and distribution of domestic and imported products to final demand. The models are solved as a linear programming problem formulated in GAMS (General Algebraic Modeling System) using the CPLEX algorithm.
Shipments data
In addition to these three methods, the seasonality of fresh produce supplied from the Northeast was examined using data from the USDA Agricultural Marketing Service (2010) on fresh fruit and vegetable shipments. A ‘shipment’ is a movement of a fresh fruit or vegetable item from a major domestic point of production or, in the case of imports, from a major point of entry into the USA. The destination of these shipments is not recorded, though produce destined for export is designated as such. Companion data on the volume of produce received by terminal markets in major metropolitan areas, known as ‘arrivals’ data, were discontinued in 1999 (USDA Agricultural Marketing Service, 1999).
Annual summary statistics on shipments of fresh produce were used to determine the monthly volumes of produce shipped from points in the Northeast region for 13 individual fruit and vegetable crops: apples, beans, blueberries, cabbage, cranberries, cucumbers, onions, nectarines, peaches, potatoes (fresh), potatoes (chipper), sweet corn and watermelon. Monthly shipments from points of origin in the Northeast were divided by total monthly shipments destined for US markets (domestic production plus imports minus exports) to derive the share of monthly shipments sent from Northeast producers.
Results and discussion
Regional self-reliance as a starting point
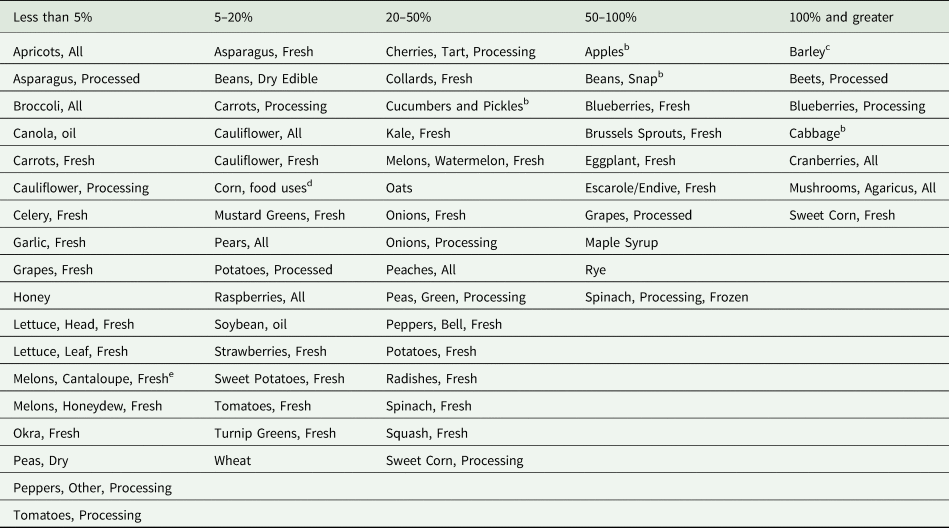
The net balance of production and consumption varies widely across the many food commodities produced in the Northeast (Table 1). A handful of products have RSR ratios >100%, and many products have RSR values <5%. However, the bulk of the products fall in the middle, with RSR values ranging from 5 to just under 100%. These numbers give no indication of the eventual location to which these products will be sent and in which they will be consumed. Nonetheless, the RSR values provide a sense of scale, showing the magnitude of production relative to consumption. Considering that many of the commodities shown in Table 1 are highly perishable and their production highly seasonal, it is possible that the region may be an important supplier, even if a commodity has an RSR value much <100%. Likewise, a relatively high RSR value (>50%) does not necessarily mean that the region is highly self-reliant if that product is shipped far beyond the region during a narrow harvest window. Further interpretation of these values requires bringing more data to the table.
List of plant-based foods produced in Northeast USA and grouped by regional self-reliancea

a Regional self-reliance is the ratio of total regional production to total regional consumption (Griffin et al., Reference Griffin, Conrad, Peters, Ridberg and Tyler2015). Expressed here as a percentage.
b Both fresh and processed forms.
c Assumes barley grown in the region is used for grain products (e.g., pearl barley) only.
d Includes use for grain, oil, starch and sweeteners. Excludes feed.
e Includes muskmelon.
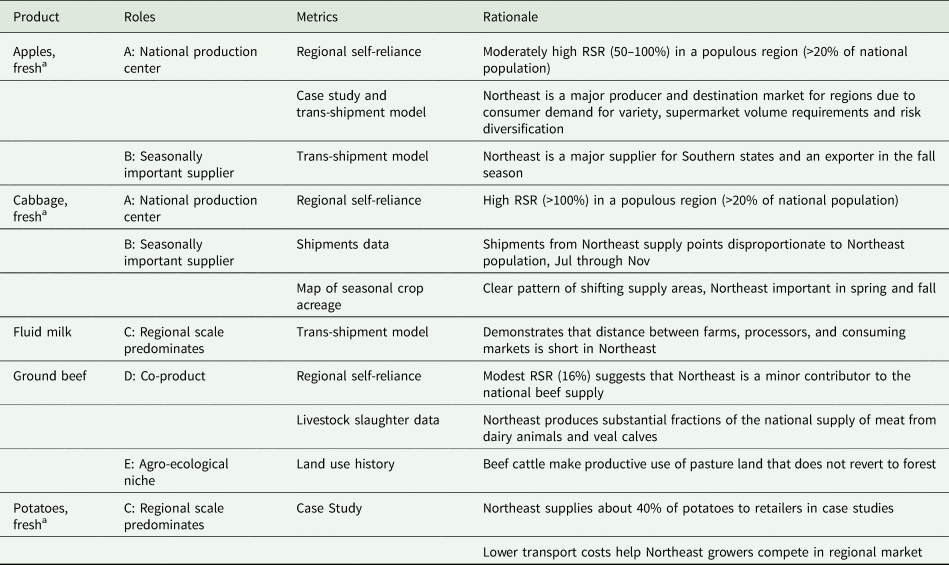
Thanks to the interdisciplinary nature of the EFSNE project, and the combination of analytical approaches used in the research, rich data were available for five market basket foods (apples, cabbage, fluid milk, ground beef and potatoes). Combining the RSR estimates with insight from the case studies, the trans-shipment models, and additional secondary data, one can identify which role, or roles, each product falls into. Table 2 illustrates the roles played by each of the five foods and the supply chains that grow, process and distribute them to retail stores. Each metric provides a key piece of information that can be used as the basis for reasoning which role, or set of roles, a given food product serves. The subsequent sections identify and define these roles in turn, starting with the market basket foods then elaborating, where possible, on where other Northeast foods may fit in the typology.
Roles of specific products in the EFSNE market basket

aIncludes product sold from storage.
Note that the case studies (Park et al., Reference Park, Gómez and Clancy2018) reveal that regional supply chains did not exist for two of the eight market basket foods, canned peaches and frozen broccoli, although for slightly different reasons. The canned peaches industry is concentrated in California where the cost of peaches for canning is about half that of what it would be in the Northeast (Brunke and Chan, Reference Brunke and Chan2015). The frozen broccoli industry that supplies the USA is centered in various Latin American countries (Johnson, Reference Johnson2016). Chopping of broccoli is done by hand, making it labor-intensive, and these countries have low labor costs. These factors constrain possible regional production in the Northeast. Thus, we confine our initial examples of the typology to the five products in Table 2.
National production centers (Role A) and seasonally-important suppliers (Role B)
One possible explanation behind very high RSR values is that the region is a national production center (Role A). In other words, the region produces a disproportionate share of the total national supply of a commodity. Within the market basket foods, fresh market apples (RSR = 81%) and cabbage (RSR = 105%) seem to fall in this category. Given that the Northeast accounts for approximately one-fifth of the nation's population, these RSR values mean that the region's production of fresh apples and fresh cabbage provide the equivalent of one-sixth and one-fifth of the nation's supply of these commodities. Considering that the Northeast accounts for only 6% of land in farms (Griffin et al., Reference Griffin, Conrad, Peters, Ridberg and Tyler2015), these contributions are disproportionate to the region's agricultural area.
Case study and trans-shipment model data for fresh apples corroborate the view that the Northeast is a national production center (Role A). A distinct feature of the fresh apple supply chains in the Northeast is that the region is both a major apple producer and an important destination market for other apple-producing regions in the USA and elsewhere. Despite the fact that the Northeast produces an ample supply of apples, not all fresh apples consumed are produced by the region's farms due to seasonality of production, consumer demand for variety, risk diversification among production areas and supermarket volume requirements (Alkhannan et al., Reference Alkhannan, Lee, Gómez and Gao2017; Park et al., Reference Park, Gómez and Clancy2018).
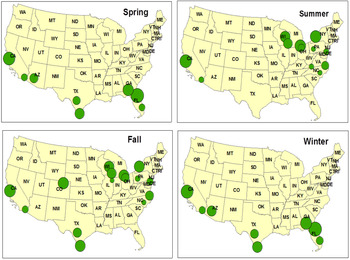
In the case of cabbage, the Northeast could be considered both a national production center and a seasonally-important supplier (Role B). To illustrate, consider the data from the case studies and the trans-shipment model. From the cases, we observed that even though the Northeast is one of the largest cabbage growers, and cabbage can store for several months, cabbage supplies came from various parts of the country, moving from one region to another depending on the season (Fig. 1). In the fall, the Northeast ships large amounts of cabbage nationally, making the Northeast a net ‘exporter’ of cabbage to other US regions. In winter and spring, however, the Northeast imports cabbage for the fresh market. In general, cabbage growers do not keep the product in storage to supply local markets during months following harvest. Two factors explain this behavior. Transporting cabbage, assuming large volumes (which the Northeast indeed produces), is relatively less expensive than storing the product, unless the travel distance is sufficiently long. Moreover, most cabbage that is stored is used for processing purposes, given that the quality of fresh cabbage decreases with storage time.
Aggregated US cabbage supply locations in each season. Circles are proportional to the cropland area available for cabbage production in each location.

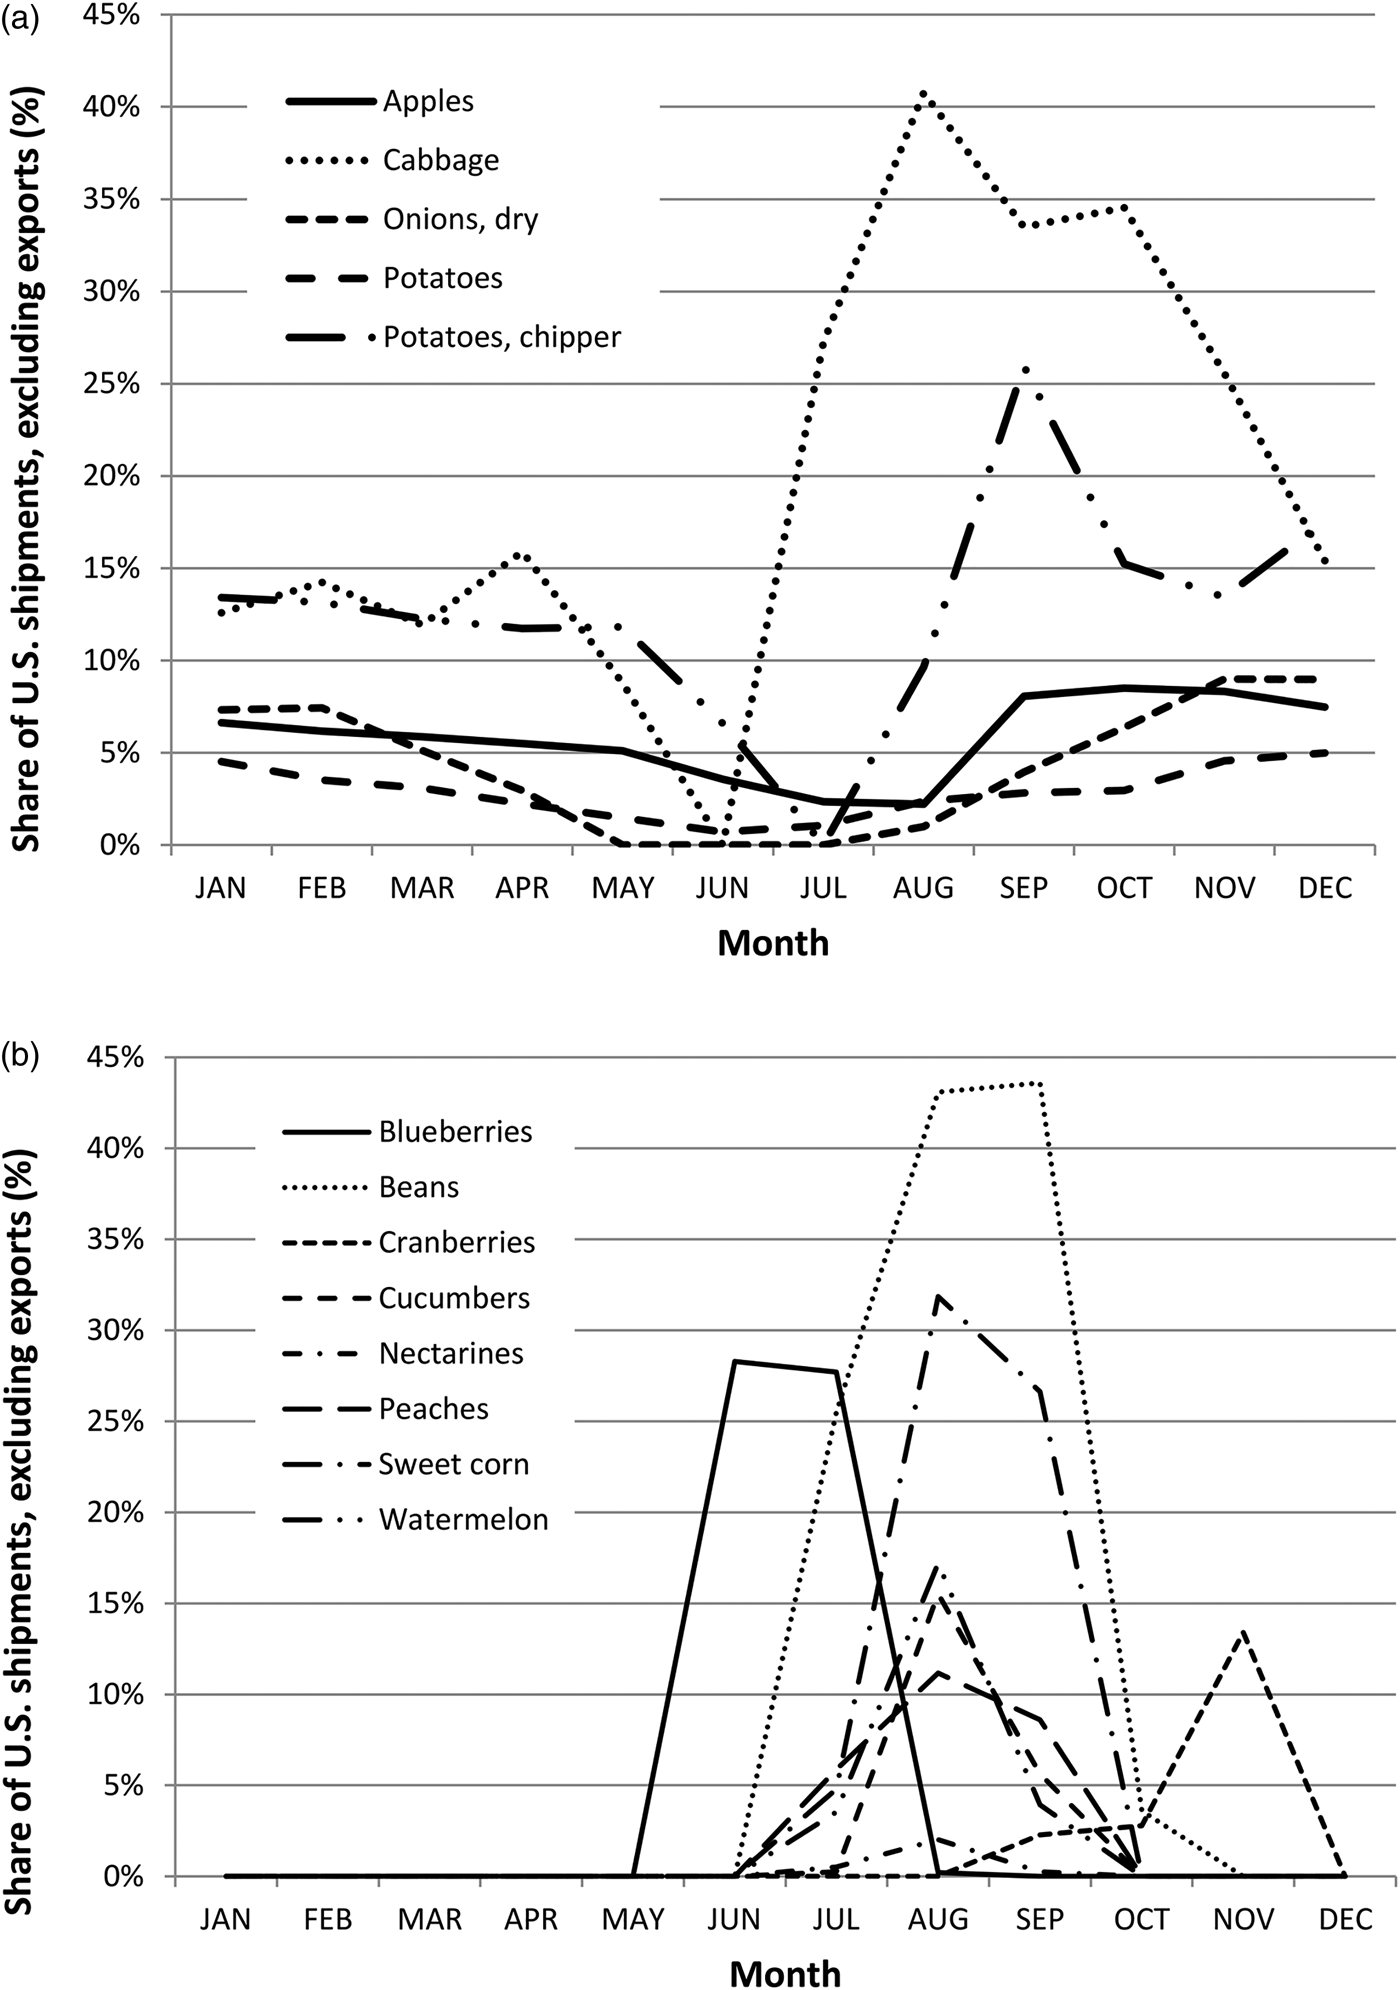
Even if RSR data do not suggest that the region is a major production center, it may serve as an important producer during certain seasons of the year (Role B). Figure 2 shows the contribution of produce shipments originating in the Northeast to the total national shipments made in each month of the calendar year. Percentages above 21% indicate that the share of shipments from the Northeast exceeds the proportion of shipments needed to supply Northeast consumption and, therefore, that the region is probably an important supplier to the national food supply. For storable crops (Fig. 2a), shipments are sent during most if not all months of the calendar year, though the total share varies considerably. Northeast cabbage and chipping potatoes account for major shares of national shipments during the summer and fall, while apples, onions and fresh potatoes account for modest shares. For perishable crops (Fig. 2b), shipments occur within, or just outside, the harvest season. Blueberries, snap beans and sweet corn from the Northeast account for major shares of national shipments during discrete (2 or 3 months) periods of the year. In addition, the region accounts for substantial shares of cranberries, cucumbers, nectarines, peaches and watermelon for 1 or 2 months of the year. Except for cranberries, these crops have only moderate RSR values. Taken together, these data illustrate how a production region can play a central role in the food supply at certain times of the year.
Share of monthly national produce shipments originating from locations within the Northeast region in 2009: (a) crops suitable for long-term storage, and (b) perishable crops with limited storability.

Regional distribution is the predominant model (Role C)
National distribution of fruit and vegetable products, as well as many processed foods, is common and creates an impression that all food flows through national market channels. However, this is not always true. Sometimes regional production and distribution is the primary form of the supply chain (Role C).
One example from the trans-shipment models is the fluid milk supply chain. The milk supply chains in both the trans-shipment models and in the case studies were entirely regional; no non-regional chains existed. There are two primary reasons for this. First, the Northeast dairy industry is large enough to efficiently access the markets in this region relative to other production regions (Nicholson et al., Reference Nicholson, Gómez, Gao and Hill2015). Secondly, the nature of fluid milk makes it difficult to transport efficiently over long distances, keeping production relatively close to assembly and processing plants, and these plants close to destination markets (Nicholson et al., Reference Nicholson, Gómez, Gao and Hill2015). We could presume that other regionally-grown crops or livestock products with these characteristics would have similar supply chain characteristics.
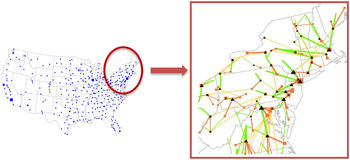
Figure 3 illustrates these relationships visually, as predicted by the dairy trans-shipment model. The left-hand panel shows that the model is national in scope, and the Northeast region is an important market for milk. The panel on the right shows the model-generated movements of milk from farms to processing plants (green), inter-plant shipments of cream (yellow) and fluid milk from processing plants to consumption locations (orange). These model predictions suggest that the Northeast fluid milk supply chain is mostly self-sufficient, meaning that fluid milk produced and processed in the region is generally consumed in the region, and very little is ‘imported’ from other regions. In addition, the model shows that while much of the movement occurs within the region, much of the product flows across state boundaries. The integrated network of relatively short distance, cross-state flows for fluid milk depicts a quintessentially regional distribution system.
Graphic representation of the fluid milk supply chain model used in the analysis adapted from Nicholson et al. (Reference Nicholson, Gómez, Gao and Hill2015). The map on the left illustrates the spatial scope of the model, with blue squares representing demand locations of raw milk nationally. The map on the right zooms into the Northeast region and shows the model-generated movements of milk: farms to processing facilities (green), inter-plant shipments of cream (yellow) and fluid milk to consumption locations (orange). Farms are represented by the central point of sub-state regions, processing nodes are represented by triangles, and consumption locations are represented by squares. The width of the lines connecting farms to processing plants to consumption locations is proportional to the flow of product.

Another example from the case studies is the fresh potato supply chain. Although a large proportion of the fresh potatoes consumed in the region come from elsewhere, all production from Northeastern farms is distributed regionally (Park et al., Reference Park, Gómez and Clancy2018). Moreover, the case studies suggest that regional farms are important suppliers to the focal grocery stores (nearly 40% of the stores’ purchases of fresh potatoes were grown in the region). Two main reasons explain the importance of regional potato supply chains (Park et al., Reference Park, Gómez and Clancy2018). First, regional chains enjoy the economic and environmental advantage of lower transport costs, lower fuel use per unit of output, and shortest distances from farm to retail store. Secondly, travel time for regional chains was less than for non-regional chains. For example, orders placed by one of the focal grocery stores for potatoes grown in the Northeast arrived within 24 h, whereas potato orders from Idaho arrived in 3–7 days and cabbage orders from 2 to 3 days. Lower travel time helps retailers because the product is often fresher and has longer shelf life.
Agro-ecological niches (Role D) and coproducts of predominant industries (Role E)
In some cases, the region does not clearly qualify as a production center or an important seasonal supplier nor is the product regionally-distributed. How does one explain, for example, the production of wheat or soybean in the Northeast, when the major production regions are located well outside the Northeast? The answer, of course, is that agriculture is generally a dispersed phenomenon, meaning that it is spread across large geographic areas. Indeed, cropland and grazing land account for half the land area of the USA. Thus, the production of small amounts of major commodities should not be surprising. Sometimes a product simply fits into a niche within the regional agroecosystem (Role D) or is a co-product of a regionally dominant agricultural industry (Role E).
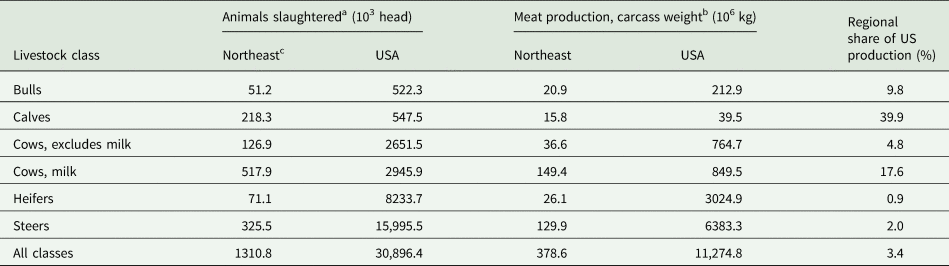
Clear examples of both roles can be observed by considering the production of beef in the Northeast. The region produces just 3% of all cattle and calves slaughtered in the USA (Table 3), making it a minor contributor to the overall supply. However, the region supplies substantial shares of particular parts of the beef and veal supply. About one-sixth of the beef that comes from culled dairy cows is supplied by the Northeast, and the Northeast accounts for 40% of calves slaughtered in the USA. Veal generally comes from male dairy calves, and thus both sources of meat are co-products of the dairy industry (Role E). Incidentally, the disproportionate contribution of the Northeast to veal production may be explained by the fact that the Northeast region has historically constituted a large share of national veal consumption (Henderson and Foster, Reference Henderson and Foster2000).
Production of beef and veal in the Northeast and USA, 5-yr average, 2013–2017.

a Includes only animals slaughtered in federally-inspected facilities. Data from QuickStats database (USDA, 2018).
b Calculated value. Meat production equals the number of animals slaughtered times the national average dressed (carcass) weights for each livestock class.
c Northeast equals the sum of USDA production regions 1, 2 and 3, which includes Virginia.
The Northeast region also slaughters a significant number of finished steers and heifers. The origin of these animals cannot be determined from USDA statistics, but the region produces approximately 1.6 million calves per year (authors' calculations from annual calf crop data for 2010–2017) and is capable of providing many of the animals raised for market and slaughtered in the region (USDA National Agricultural Statistics Service, 2018).
Cow–calf production in the Northeast USA owes its existence, in part, to long-term land use trends. Cropland in the region peaked at about 40% of total land area in 1880, then began a long decline, which continued through the 20th century (Waisanen and Bliss, Reference Waisanen and Bliss2002). Much of this land returned to the forest, but the westward movement of agriculture also left an abundant supply of relatively affordable land for growing hay or pasturing animals. Grassland pasture and hay cover nearly 10 million acres of land in the region (Conrad et al., Reference Conrad, Tichenor, Peters and Griffin2016), much of which is used by cow–calf producers. The ample supply of land in hay and pasture creates a niche for beef production within the Northeast (Role D).
Local and regionally marketed products (Role F)
Regional food systems were the focus of the EFSNE project. Hence, we did not explore local food systems, nor did we examine the marketing of products for their regional provenance. However, in considering the entirety of a region's food and agricultural production, it is vital to note that some products are sold for their regional identity (Role F). Some products may be marketed simply for coming from a state commonly, and favorably, associated with a location, such as New York apples, Maine lobster or Vermont maple syrup. Other products may be sold for their local provenance through farmers markets or intermediated value chains with grocery stores or institutions. Growing, raising, processing and distributing these products require a portion of a region's natural resources and food and agricultural infrastructure. Thus, it is essential to include in this typology.
Additional lessons learned from applying the typology
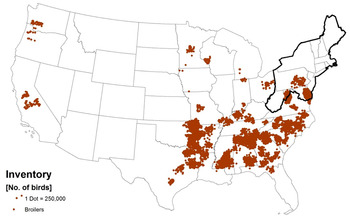
The set of roles outlined above is intended to be exhaustive. However, it is instructive to consider an awkward fit to the typology. Poultry meat falls in the middle of the RSR spectrum, with RSR values of 29 and 30% for chicken and turkey, respectively (Griffin et al., Reference Griffin, Conrad, Peters, Ridberg and Tyler2015). These numbers suggest that regional production may be significant, but they are difficult to put into context without understanding where else poultry is produced within the USA. Most poultry production in the Northeast occurs in southeastern Pennsylvania, eastern Maryland and the state of Delaware, an area that lies in the northeastern corner of a belt of poultry farms that stretches though much of the southeastern USA (Fig. 4). Seen in this light, the Northeast region, as defined herein, simply overlaps with the primary broiler production region of the country. This is a variation on Role A, in that the Northeast is part of, rather than encompassing, a national production center.
Inventory of broiler chickens in the USA. Dot density map indicates the relative number of broilers (meat-producing chickens) per county throughout the USA in 2012 according to the US Census of Agriculture (USDA National Agricultural Statistics Service, 2017). Boundary of the 12-state Northeast region shown with solid black line.

Indeed, defining regions from the standpoint of agricultural similarities, such as that used by the USDA Economic Research Service to define Farm Resource Regions (Heimlich, Reference Heimlich2000), would result in a different spatial grouping than that used by EFSNE. The lesson here is that the boundaries of a study area can make complete sense from one perspective, in this case the boundaries of the Northeast Center for Rural Development as defined by USDA, but not from the perspective of agricultural similarity. Thus, be prepared to look beyond the region to understand certain patterns in defining roles.
Finally, it is worth noting the key role that distribution systems play in determining the geographic scope of supply chains. From the case studies conducted by Park et al. (Reference Park, Gómez and Clancy2018), we learned that the eight items reached supermarkets almost exclusively through a system of intermediaries: producer sales agents, brokers, re-packers, processors, produce wholesalers and grocery wholesalers. The intermediaries provided very valuable services to those shippers who either were not large enough to reach markets on their own or who required additional value-added functions, such as further processing or repacking, or small-scale distribution to small stores, to access these markets. Whether the supply chain was regional or non-regional did not affect the number of intermediaries in the supply chain. Nevertheless, the size and scale of business matters, as larger business typically increase the geographic reach of supply chains and reduce the number of businesses in the supply chain. For example, for the perishable market basket items, the larger the grower/shipper, the more likely it sold directly to the grocery wholesaler servicing the supermarket, instead of selling to other intermediaries. Understanding the structure of supply chains is critical to identifying the geographic scope and thereby the roles of regional production in the food system.
Conclusions
Why do we need a typology?
Agriculture is so vast, that it can be difficult to comprehend the significance of a single field or a single farm to the entire food system. Likewise, the production of a minor agricultural region can seem insignificant to the larger system. However, as we have attempted to show here, aggregate estimates of farm sales, land area or even production of individual crops can bely the role a region plays in the greater food system. Defining the roles of regional production demystifies food systems in at least four important ways.
First of all, clarifying the purpose of regional production in the larger food system helps to communicate the importance of regional and local agricultural resources to non-farm audiences. The roles illustrate how a region contributes to food system resilience by, for example, spreading out production geographically or enabling a more consistent supply of product over time. Similarly, the roles help to show how different pieces of the food and agricultural system fit together, making it less monolithic.
Secondly, understanding the ways in which current production fits in the food system also shows the opportunity cost of expanding one role at the expense of another. Interest in local food has grown steadily over the past 10–20 yrs. The definition of local is often conflated with regional, so some of this interest is not so much about ‘local’ as about ‘regional’ food. Where will this food come from and what will it displace? In the Northeast, the land has been exiting agriculture for over 100 yrs, often returning to forest and sometimes converting to developed uses. We should understand what systems are being displaced before promoting local and regional production and distribution.
To this end, we need to know how to glean as much information as possible from existing data sources. Thus the third important contribution of the typology is to show what we can learn from agricultural production, marketing and food supply data. We also need to know how to delve deeper into the relationships. The supply chain case study data and supply chain models achieve this, to some extent, as do some targeted literature searches.
Fourthly, and finally, building sustainable food systems requires investments of many kinds, and the holistic view provided by the roles can help guide such decisions. The typology presented here might help us to ask better questions. For example, rather than asking, ‘How self-reliant is a region and how much food might we supply regionally’, we could instead ask, ‘How important is region X in contributing to the national (or even global) food supply? And, given this role, how much should we seek to rely on regionally-sourced food?’
Consider the following hypothetical questions and how knowledge of the roles might inform one's responses:
• How much capacity should university departments and cooperative extension services retain for research on beef production and engagement with cattle producers knowing that cow–calf operations fill a unique niche and support a distributed system of calf production around the country?
• What resources should be devoted to collecting agricultural statistics for fruits and vegetables in minor production regions knowing that even minor regions feed into national markets and can be important suppliers at certain times of the year?
• What policies should be considered to support dairy farms knowing that existing regional production, processing and distribution chains are an efficient configuration for supplying fluid milk?
• What are the strategic opportunities and vulnerabilities of Northeast agriculture in the face of climate change given the roles it currently plays as a production center or seasonally important supplier of perishable fruits and vegetables?
• How will US food and agricultural systems change to address broad sustainability concerns and what new roles might the Northeast fill to more sustainably meet national food needs?
In essence, a typology for classifying regional production helps to see the relationship of parts to the whole. Food systems exhibit functional diversity just like ecosystems, and we must protect these functions to ensure the resilience of the larger food system. We may not know or be able to accurately judge the minimum number of production centers needed to produce a given crop or the minimum number of farms to support a given regional industry, but we know that diversity is difficult to replace once lost. A typology of food system roles helps us to see and appreciate these distinct food system functions.
Future challenges to agriculture
Agriculture faces a tremendous number of challenges. Among environmental concerns, climate change often appears most prominent, but many other problems exist. Availability of water, degradation of soil quality, eutrophication of waterways, greenhouse gas emissions, and soil erosion must also be addressed. Many social and economic issues also need attention, such as the loss of farmers and fair labor practices within agricultural industries. Moreover, the most fundamental service of agriculture, the provisioning of food, presents perhaps the most daunting challenge. While most Americans have enough calories to eat, food insecurity persists, and significant changes will be required to bring food consumption and agriculture into accordance with national dietary recommendations. The list is so long that contemplating it can be paralyzing.
For this reason, we must attempt to understand the food system as clearly and holistically as possible. Just as taxonomy is important to cataloging biological diversity and understanding the contribution of species to ecosystems, a typology of production roles can help us to comprehend how different industries and scales of production interact to create food systems. Building more sustainable and renewable food systems will require this holistic understanding of how the parts fit together.
We offer the roles described herein as a practical typology for understanding the system we observe through food and agricultural statistics and through food system analyses. In the absence of statistics on the interstate trade of food, it is impossible to describe the precise contribution of regional food supplies in meeting local, regional, national and global food needs. Nonetheless, it should be possible to understand the ways in which regional production may be important in meeting present and future food needs. Hopefully, this typology serves as a useful heuristic for ensuring that we do not miss the forest for the trees, as we consider the region's future.