

Introduction
As the prevalence of dementia will reach unprecedented levels in the coming years (Alzheimer's Association, 2007), the need for quick, reliable, and accurate diagnostic screening tools applicable in diverse settings has never been more important. In the past 30 years, many variations of the Clock Drawing Test (CDT) have risen to the forefront as a dementia screening measure (Sunderland et al., Reference Sunderland1989; Wolf-Klein et al., Reference Wolf-Klein, Silverstone, Levy and Brod1989; Mendez et al., Reference Mendez, Ala and Underwood1992; Rouleau et al., Reference Rouleau, Salmon, Butters, Kennedy and McGuire1992; Tuokko et al., Reference Tuokko, Hadjistavropoulos, Miller and Beattie1992; Shulman et al., Reference Shulman, Gold, Cohen and Zucchero1993; Watson et al., Reference Watson, Arfken and Birge1993; Royall et al., Reference Royall, Cordes and Polk1998; Manos, Reference Manos1999; Lessig et al., Reference Lessig, Scanlan, Nazemi and Borson2008). Of the many CDT administration and scoring procedures currently in use, differences exist in their development of critical errors, ease of administration, and psychometric properties, thus making it difficult for clinicians and researchers to choose one scoring system over another.
Experts in the field agree, however, that ideal CDT scoring systems must be brief, generalizable to diverse populations, quick and easy to score, highly predictive of dementia, yet at the same time retain the qualities of a comprehensive examination (Ainslie and Murden, Reference Ainslie and Murden1993; Shulman, Reference Shulman2000). The qualitative and quantitative scoring system developed by Tuokko and her colleagues in 1992 satisfies most of these conditions. It has shown to be highly predictive in detecting dementia (O'Rourke et al., Reference O'Rourke, Tuokko, Hayden and Beattie1997) and is one of the most detailed and comprehensive systems available today, with seven broad error categories and 24 error sub-categories (Tuokko et al., Reference Tuokko, Hadjistavropoulos, Miller, Horton and Beattie1995a). This system, however, has been criticized for its complexity and impracticality in the clinical setting (Lin et al., Reference Lin2003).
In 2008, Lessig and her colleagues sought to simplify the CDT scoring system by identifying the optimal number of critical errors needed to detect dementia by combining clock errors from three different popular scoring systems including the Tuokko system (Tuokko et al., Reference Tuokko, Hadjistavropoulos, Miller and Beattie1992) as well as methods developed by Mendez (Mendez et al., Reference Mendez, Ala and Underwood1992) and Shulman (Shulman et al., Reference Shulman, Gold, Cohen and Zucchero1993). Twenty-four separate errors were identified and applied to 536 clock-drawings from ethnolinguistically and educationally diverse older adults enrolled in the University of Washington Memory Disorders Clinic and the Alzheimer's Disease Research Center Satellite (154 classified as healthy controls, 101 classified with subsyndromal cognitive impairment, 281 classified with dementia). An algorithm was used to reduce and simplify the 24 pre-selected errors down to six critical errors: wrong time, no hands, missing numbers, number substitution, repetition, and refusal to draw a clock. Sensitivity and specificity for dementia detection was found to be 71% and 88%, respectively. The results from this study show that an equally effective yet simplified clock-drawing scoring system can be derived from a more complex classification structure when using a clinic-based sample.
This study aims to examine whether or not a procedure that was used to identify six critical errors needed for dementia detection (Lessig et al., Reference Lessig, Scanlan, Nazemi and Borson2008) in a clinic-based sample would produce similar results in a Canadian population-based subsample using the comprehensive Tuokko scoring method as the basis for reduction. No study has yet generalized the newly developed Lessig scoring system to a population-based sample.
Methods
Participants
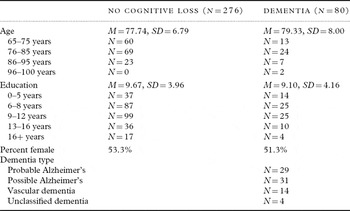
Clock-drawings from 356 participants in the Canadian Study on Health and Aging (CSHA; CSHA Working Group, 1994) were analyzed. The CSHA began its intensive data collection in 1991 by conducting screening interviews with over 9,008 community-dwellers aged 65 years and older. The study sought to identify individuals with cognitive impairment by conducting clinical examinations (medical assessments including blood tests and physical measurements, interviews with caregivers, and neuropsychological assessments) for three groups: (1) those who screened positive for cognitive impairment; (2) a subsample of those who screened negative for cognitive impairment; and (3) 1,255 residents of care facilities. In total, the CSHA collected comprehensive neuropsychological data from approximately 1,879 participants ranging in age from 65 to 100 years (Tuokko et al., Reference Tuokko, Kristjansson and Miller1995b). Of this sample, 493 individuals from British Columbia completed the clock-drawing component of the CDT (Tuokko et al., Reference Tuokko, Kristjansson and Miller1995b). For this study, 356 individuals of the 493 who completed the CDT were identified – 276 classified as cognitively intact and 80 exhibiting any form of dementia as defined by the DSM-III-R criteria (e.g. possible Alzheimer's disease, probable Alzheimer's disease, vascular dementia, unclassified dementia). It should be noted that the prevalence of dementia in this sample is reflective of sample selection and as a result does not mirror prevalence rates of dementia in Canada. The remaining 137 individuals were classified with cognitive impairment no dementia (CIND)/mild cognitive impairment (MCI) and were excluded from the analyses. Previous research has shown that the CDT possesses very poor discriminative power when used to detect CIND/MCI (Lee et al., Reference Lee, Kim, Hong, Lee, Oh and Cheong2008; Ehreke et al., Reference Ehreke, Luppa, Konig and Riedel-Heller2010). In addition, variability in the conversion rates of MCI/CIND to dementia (Bischkopf et al., Reference Bischkopf, Busse and Angermeyer2002) inherently creates heterogeneity in the sample. Consequently, this demographic group was excluded from the study so as to focus on dementia as an outcome. Collectively, participants selected for this study ranged in age from 65 to 100 years (M = 79.28, SD = 6.98). Their education level ranged from 0 to 25 years (M = 9.18, SD = 4.01). Both groups (no cognitive loss and dementia) were evenly distributed between males and females (53.5% females in the no cognitive loss group and 51.3% females in the dementia group). Table 1 presents a summary of the demographic characteristics of each group, individuals with no cognitive loss and those diagnosed with dementia, according to CSHA criteria.

Procedure
During administration by CSHA examiners, participants were presented with a pre-drawn circle (2.8 in/7 cm in diameter) and told to: “Imagine this is the face of a clock. Put the numbers on the clock.” Once the participant completed this initial step, the examiner then instructed the participant to: “Put the hands on the clock to indicate 10 past 11.” A trained psychometrist from the Vancouver CSHA team first scored the clock-drawings using the Tuokko et al. (Reference Tuokko, Kristjansson and Miller1995b) method. A trained psychometrist also scored the clock-drawings using the Shulman, Wolf-Klein, and Watson procedures in order to conduct an inter-scoring system comparison (Shulman et al., Reference Shulman, Sheldetsky and Silver1986; Wolf-Klein et al., Reference Wolf-Klein, Silverstone, Levy and Brod1989; Shulman et al., Reference Shulman, Gold, Cohen and Zucchero1993; Watson et al., Reference Watson, Arfken and Birge1993; see below).
Data analysis
Correlation analyses to determine covariates
Initial analyses (correlations) examined the relationship between dementia status and age or years of education to determine if these variables should be treated as covariates. Previous research has demonstrated that education level can alter performance on the CDT (Ainslie and Murden, Reference Ainslie and Murden1993) thus warranting closer examination of this variable in this study. Although age has traditionally been used as a covariate in statistical analyses, emerging research suggests that correcting for age can, in fact, diminish a test's discriminative ability (Sliwinski et al., Reference Sliwinski, Lipton, Buschke, Wasylyshan and Petersen2003). According to Sliwinski et al. (Reference Sliwinski, Lipton, Buschke, Wasylyshan and Petersen2003), age is an important contributor to the development of dementia and, as a result, a necessary component to examine when using norms.
Identifying significant errors
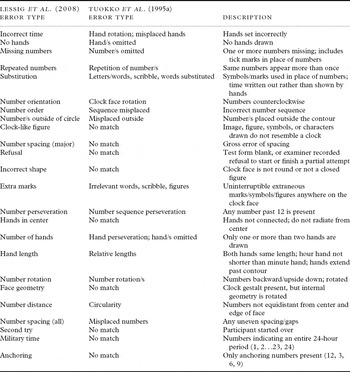
Lessig's (Lessig et al., Reference Lessig, Scanlan, Nazemi and Borson2008) 24 pre-selected clock-drawing errors were matched with the errors from the Tuokko scoring system (Table 2). Nine errors could not be matched due to differences in administration and scoring procedures between the two tests. For example, Lessig's “clock-like figure,” “refusal,” and “incorrect shape” errors could not be matched to Tuokko's errors because the latter scoring system uses a pre-drawn clock thus making these three specific errors impossible to identify. As a result, comparisons between the newly derived scoring system and the Lessig scoring system must be interpreted with caution. Several errors from the Tuokko scoring system were more detailed than errors identified by Lessig and her colleagues (e.g. letters/words, scribble, and words substitution; irrelevant words, scribbles, and figures; hand rotation and misplaced hands; hand perseveration and hand omission) and, as a result, these errors were combined to fit Lessig's error description. Fifteen final clock errors were obtained to represent the overlap between the Lessig and Tuokko scoring systems. Of the six critical errors Lessig et al. (Reference Lessig, Scanlan, Nazemi and Borson2008) found in their original study, only five were used in this study, as the sixth error (refusal to draw a clock) could not be identified, as only those completing the CDT were available.
Initial clock-drawing errors used in statistical analyses

Each of the 15 error type totals were converted to a dichotomous variable (0, 1) with “0” indicating the presence of no errors and “1” indicating the presence of one or more errors. An initial sequential logistic regression analysis was then conducted to predict cognitive status (cognitively intact vs. dementia) using SPSS Version 17. The 15 individual error types were treated as the independent variables and dementia status (0 = normal, 1 = with dementia) was used as the dependent variable. To determine if the utility of Lessig's critical errors would generalize to our sample, five identified critical errors were entered in Block 1 (incorrect time, no hands, missing numbers, repeated numbers, and substitution), followed by all remaining ten errors in Block 2 (number orientation, number order, number/s outside the circle, extra marks, number perseveration, number of hands, hand length, number rotation, number distance, and number spacing).
Reduced errors
Once the errors that significantly discriminated between the cognitively intact participants and those with dementia had been isolated, a second direct logistic regression analysis was conducted to assess for optimal specificity and sensitivity, with dementia status (0 = normal, 1 = with dementia) as the dependent variable and significant errors as predictors. All significant errors were entered in Block 1. These critical errors were then combined to create a single composite score (min = 0, max = 5), which was then tested for specificity and sensitivity for discriminating cognitively intact participants from those with dementia (see next section).
Determining sensitivity and specificity
Receiver operating characteristic (ROC) curves were used to determine the particular sensitivity and specificity associated with the newly derived scoring system, which hereafter will be referred to as the Jouk scoring system. Typically, researchers developing clinical screening tools favor tests with high sensitivity (Essex-Sorlie, Reference Essex-Sorlie1995) to ensure all disease-positive individuals (true positives) are identified early in the decline process. However, with a condition like dementia where treatment options are limited, a diagnostic screening tool should also be highly specific (Essex-Sorlie, Reference Essex-Sorlie1995) to avoid causing undue psychological harm by inaccurately identifying healthy individuals as individuals with dementia. As a result, an excellent scoring system for the CDT is both highly sensitive and specific. The area under the ROC curve was also examined to quantify their relation.
Comparison with the Lessig scoring procedure and other common clock-drawing scoring systems
The Jouk scoring system was dichotomized according to its optimal cut-off score, with “0” representing a healthy, cognitively intact individual and “1” representing a person with suspected dementia. An ROC analysis was conducted to determine the Jouk system's sensitivity, specificity, and area under the ROC curve at this optimal cut-off point. The Jouk procedure's sensitivity, specificity, and area under the curve were then compared to the sensitivities, specificities, and areas under the curve for the Lessig, Shulman, Watson, Wolf-Klein, and Tuokko scoring systems using CSHA data.
The five available critical errors from the Lessig system (wrong time, no hands, missing numbers, number substitution, and repetition), already dichotomized from previous analyses, were added together to form a composite (min = 0, max = 5) and then dichotomized again according to the published cut-off score of 1, with “0” representing a healthy, cognitively intact individual and “1” representing a person with suspected dementia. For the other commonly used scoring procedures, error totals were also converted to dichotomous variables (0, 1) according to their published cut-off scores. The Shulman system scores the CDT on a scale from 1 to 6, with lower scores indicating less or no impairment (Shulman et al., Reference Shulman, Gold, Cohen and Zucchero1993). A cut-off score of greater than 2 suggests cognitive impairment (Shulman et al., Reference Shulman, Sheldetsky and Silver1986). The Watson method scores clock errors from 0 (no errors/least impairment) to 7 (most errors/most cognitive impairment), with a cut-off score of 4 or greater reflecting a person with dementia (Watson et al., Reference Watson, Arfken and Birge1993). The Wolf-Klein scoring system ranges from 1 to 10, with higher scores depicting less impairment and a cut-off score of 8 or greater suggesting a healthy individual with no cognitive impairment (Wolf-Klein et al., Reference Wolf-Klein, Silverstone, Levy and Brod1989). The Tuokko scoring method produces an error score ranging from 0 to approximately 31 and utilizes a cut-off score of 2 and below to indicate no cognitive impairment (Tuokko et al., Reference Tuokko, Kristjansson and Miller1995a). After dichotomizing all the error totals using the appropriate cut-off scores, ROC analyses were conducted for each of the commonly used scoring systems to provide a direct comparison to the Jouk method.
Results
Correlation analyses
Initial correlations between dementia status and age, and years of education revealed no correlation between the dementia status and age (r = 0.095, N = 198, p = ns) or education (r = –0.059, N = 354, p = ns). Since both age and years of education were not significantly correlated with dementia status, they were not entered into the regression model as covariates.
Significant and non-significant errors
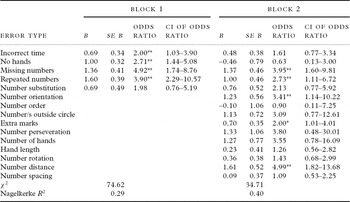
Table 3 shows the sequential logistic regression conducted to assess the utility of Lessig's 15 original errors in our sample. In Block 1 of the analysis, Lessig's five identified critical errors (incorrect time, no hands, missing numbers, repeated numbers, and substitution) significantly predicted dementia status (χ2(5, N = 356) = 74.62, p = 0.00, Nagelkerke R 2 = 0.29) with all but one of Lessig's original errors (number substitution) significantly contributing (see Table 3). Entering the ten remaining errors (number orientation, number order, number/s outside the circle, extra marks, number perseveration, number of hands, hand length, number rotation, number distance, and number spacing) in Block 2 of the regression equation significantly improved the prediction of dementia status (χ2 (10, N = 356) = 34.71, p = 0.00, Nagelkerke R 2 = 0.40).
Summary of initial logistic regression analysis for all 15 clock-drawing errors predicting dementia status (N = 356)

*p < 0.05; **p < 0.01.
Note: SE = Standard Error; CI = Confidence Interval at 95%.
Examination of odds ratio showed that five errors (missing numbers, repeated numbers, number orientation, extra marks, and number distance) significantly discriminated cognitively intact participants from participants with dementia (see Table 3). Two of Lessig's originally identified errors, incorrect time and no hands, no longer proved to contribute significantly. However, three other errors (number orientation, extra marks, and number distance) were added to the set of significant/critical errors. Closer scrutiny of the odds ratios showed that those exhibiting number distance errors were at a five-times increased risk of having dementia compared to individuals who did not make this error. Individuals exhibiting missing number errors were at a four-times greater risk of having dementia compared to those who did not make this error. Individuals who repeated numbers when drawing the clock and displayed number orientation errors were at a three-times increased risk for dementia versus those who did not make these errors. Finally, individuals who made extra marks on the clock face (vs. those who did not make this error) were at twice the risk of having dementia.
Reduced errors
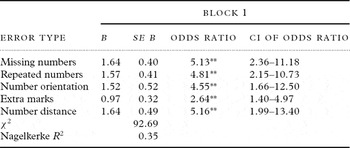
A second direct logistic regression analysis was conducted to evaluate the relation of newly identified errors to dementia status. The five significant errors identified from the initial logistic regression (missing numbers, repeated numbers, number orientation, extra marks, and number distance), entered in Block 1 of the regression equation, significantly predicted dementia status (χ2(5, N = 356) = 92.69, p = 0.00, Nagelkerke R 2 = 0.35; Table 4). Examination of the odds ratios verified that all five errors significantly discriminated cognitively intact individuals from participants with dementia with greater predictive power than the previous analyses (see Table 4). Closer inspection of the odds ratios showed that those exhibiting missing number, number orientation, and repeated number errors (vs. those who did not) were at a five-times increased risk of having dementia. Those who placed extra marks on the clock face were at a three-times increased risk of having dementia compared to those who did not make this error. Finally, individuals displaying number distance errors (compared to those who did not make this error) were at an approximately five-times increased risk of having dementia.
Summary of the logistic regression analysis for five significant clock-drawing errors predicting dementia status (N = 356)

*p < 0.05; **p < 0.01.
Note: SE = Standard Error; CI = Confidence Interval at 95%.
These five critical errors (missing numbers, repeated numbers, number orientation, extra marks, and number distance) were then combined to create a composite score (min = 0, max = 5), which was used to calculate the sensitivity and specificity of this reduced scoring system using ROC curves for each of the five possible cut-off points (see next section).
Sensitivity and specificity of the reduced Jouk scoring system
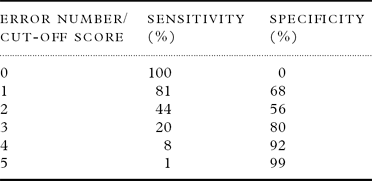
An ROC curve was plotted (sensitivity vs. 1 – specificity for all possible cut-off scores) for the reduced Jouk scoring system to evaluate its overall sensitivity and specificity for detecting dementia. The area under the ROC curve was 0.80 (SE = 0.03), indicating a moderate trade-off between the false negative (sensitivity) and false positive (specificity) rates for the five possible cut-off scores. After examining the sensitivity and specificities for each of the five possible cut-off points (Table 5), a cut-off score of 1 produced the most balanced sensitivity and specificity values at 81% and 68%, respectively.
Sensitivity and specificity at each possible cut-off point for the Jouk scoring system

Positive and negative predictive power of the reduced Jouk scoring system
Positive and negative predictive values of the reduced Jouk scoring system were calculated based on a dementia prevalence rate of 8% as determined by CSHA statistics (CSHA Working Group, 1994). Calculations of the positive and negative predictive powers associated with the Jouk scoring system yielded values of 18% and 98%, respectively. The positive predictive value of 18% suggests the Jouk scoring system accurately predicts the development of dementia at a 10% higher rate than the estimated rate in the CSHA population-based sample. Thus, by using the Jouk scoring system to screen for dementia, an accurate prediction for the development of dementia would be achieved 18% of the time whereas without the test (i.e. prevalence rate prediction alone) only 8% of the population would be accurately predicted. Similarly, the prediction of the sample that will not go on to have dementia (negative prediction value) was slightly higher than the estimated prevalence rate in the CSHA sample (98% vs. 92%).
Comparison with the Lessig procedure and other commonly used scoring systems
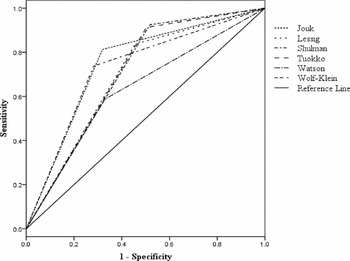
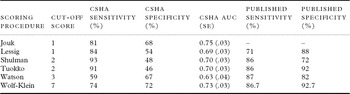
Using the optimal cut-off score of 1, the Jouk system's area under the ROC curve fell slightly to 0.75 (SE = 0.03; see Figure 1), while the sensitivity and specificity remained at 81% and 68%, respectively. Using CSHA data, ROC curves were drawn for the Lessig, Shulman, Tuokko, Watson, and Wolf-Klein scoring systems to evaluate their respective areas under the curve, sensitivities, and specificities (see Figure 1). The areas under the curve for each of the six scoring systems are presented in Table 6. The Jouk scoring system had the largest area under the curve (0.75, SE = 0.03), followed by the Wolf-Klein system (0.73, SE = 0.03). The Shulman and Tuokko scoring procedures’ area under the curve fell in the middle of all the scoring systems (both 0.70, SE = 0.03), closely followed by the Lessig system (0.69, SE = 0.03). The Watson scoring method had the smallest area under the curve (0.63, SE = 0.04).
ROC curves for the six clock scoring procedures derived from CSHA data.

Sensitivity, specificity, and area under the curve (AUC) with the associated standard error (SE) calculated at the published cut-off scores for the six clock scoring procedures derived from CSHA data and also published by the original authors

The sensitivities and specificities of the six scoring systems derived from CSHA data are also presented in Table 6. The Shulman and Tuokko scoring systems had the highest sensitivities at 93% and 91%, respectively. The Lessig, Jouk, and Wolf-Klein scoring procedures fell in the middle at 84%, 81%, and 74%, respectively. The Watson method had the lowest sensitivity at 59%, performing just above chance level for correctly identifying individuals with dementia. With regard to specificity, the Wolf-Klein scoring procedure had the highest specificity at 72%, followed by the Jouk scoring method at 68%. The Watson scoring system's specificity closely trailed the Jouk method at 67%. The Lessig procedure's specificity ranked in the middle at 54%, while both the Shulman and Tuokko procedures had the lowest specificities at 48% and 46%, respectively.
Table 6 also presents the sensitivities and specificities published by the original authors to provide another method of comparison.
Discussion
Using a population-based sample, the Jouk scoring method for the CDT was found to have a similar sensitivity and higher specificity compared to the Lessig scoring procedure using one less critical error. The Jouk scoring system used five critical errors (missing numbers, repeated numbers, number orientation, extra marks, and number distance) with a cut-off score of 1 to produce a sensitivity of 81% and a specificity of 68%. The Lessig scoring system, derived from a clinical sample, had a sensitivity of 71% and a specificity of 88%. Even though Lessig's originally published specificity surpassed the Jouk scoring system's specificity, the sensitivity of the Jouk method exceeded the Lessig system's sensitivity. When using a population-based sample to calculate the diagnostic utility of the Lessig scoring procedure, the Jouk system's sensitivity was only 3% lower than the Lessig method. The specificity of the Jouk system, however, was 14% higher than the Lessig procedure. This comparison revealed the Jouk method to be more balanced than the Lessig system.
With regard to the other traditionally used scoring methods, the Jouk procedure also had one of the most balanced sensitivities/specificities when using this population-based sample (81% and 68% respectively). The Wolf-Klein scoring system also produced a balanced sensitivity and specificity when using the CSHA data (74% and 72% respectively). Although the Shulman and Tuokko methods had two of the highest sensitivities when using population-based data (93% and 91% respectively), their specificities using this same data were very low (48% and 46% respectively). However, when the scoring systems derived from CSHA data in this study were compared with the original studies conducted by the authors who developed the scoring systems, the sensitivities and specificities were generally much higher and more balanced in the clinically derived samples.
The differences in these results could have stemmed from inherent qualities of the two samples. Many of the originally published scoring systems, including the Lessig scoring method, were derived from samples obtained from dementia-specific clinics. Individuals attending these clinics have already been “pre-selected” for their cognitive impairments, thus creating homogeneity among the sample. The homogenous characteristics of this sample increase the sensitivity of the CDT. Conversely, individuals examined from a representative subset of the general population, like those tested in CSHA and used in this study, comprise a more heterogeneous sample, thereby decreasing the sensitivity of the CDT. Pinto and Peters (Reference Pinto and Peters2009) also found similar results when conducting a general review of the administration and utility of the CDT. They also attributed the discrepancy in sensitivity and specificity among the original published results and subsequent comparative studies to differences in the populations and control groups used for each study, respectively.
In general, this study showed that the Jouk method provided one of the better procedures for scoring the CDT in a population-based sample. Of all the scoring systems examined, the Jouk procedure had the greatest diagnostic utility as indicated by the area under the curve (Pinto and Peters, Reference Pinto and Peters2009). Moreover, when sensitivity and specificity were individually compared among the different scoring systems examined in this study, the Jouk and Wolf-Klein procedures produced the most evenly balanced sensitivity and specificity. According to Essex-Sorlie (Reference Essex-Sorlie1995), a screening tool for dementia should be both highly sensitive and specific. It can be argued that if the CDT is to be used in dementia clinics or other clinical settings as a screening tool, the test should have a higher specificity so as not falsely to identify healthy individuals as having an incurable condition. Screening tests with higher sensitivities may therefore be best suited to research settings, where it is important to accurately classify participants in disease-positive/experimental and disease-negative/control groups. As a result, the Jouk scoring system for the CDT may prove to be more useful in a research setting where a population-based sample is used. Further research, however, is needed to evaluate this procedure in different settings.
When individual error types from the reduced Jouk and Lessig scoring systems were compared, two common errors were found – missing numbers and repeated numbers. These errors, as well as the other three errors detected from the Jouk scoring method (number orientation, extra marks, and number distance), are fairly obvious errors to detect from a single glance. This proves to be a strength of the Jouk scoring system since identifying these errors can be done quickly, easily, and without much deliberation.
Additionally, it was noted that the majority of the errors comprising the Jouk scoring system (missing numbers, number orientation, and number distance) represented a spatial planning deficit. This result supports other findings that spatial planning errors strongly predict dementia status (Blair et al., Reference Blair, Kertesz, McGonagle, Davidson and Bodi2006; Lee et al., Reference Lee, Kim, Hong, Lee, Oh and Cheong2008). Lee et al. (Reference Lee, Kim, Hong, Lee, Oh and Cheong2008) conducted a quantitative and qualitative analysis to define the characteristics of the error types made on the CDT by patients with Parkinson's disease, subcortical vascular dementia, and Alzheimer's disease. They found that spatial planning errors most sensitively detected all forms of dementia, even in the early stages. Blair et al. (Reference Blair, Kertesz, McGonagle, Davidson and Bodi2006) conducted a similar study, although they limited their sample to include individuals with Alzheimer's disease and frontotemporal dementia. They observed that patients with Alzheimer's disease made more spatial planning errors compared with patients with frontotemporal dementia. Collectively, these results suggest that spatial planning errors represent a core feature in the detection of dementia, although further research is needed to disentangle the discrepant findings concerning the different types of dementia.
Several limitations of this study need to be considered when examining the results. First and foremost, due to restrictions in the original data, not all 24 errors identified by Lessig and her colleagues were used in the initial regression analysis. One error in particular – refusal to draw a clock – was found to be a critical error in the Lessig scoring system but could not be included in the initial regression. The availability of this error may have increased the Jouk procedure's sensitivity and specificity. The reported sensitivity and specificity may also have been slightly inflated due to the elimination of the CIND/MCI group. To aid clinicians working in heterogeneous settings, future studies will benefit from examining various other diagnostic features of dementia (e.g. etiology, stage, and severity) in order to increase the predictive power of the CDT as a screening tool. In addition, although the sample of participants used in this study already comprised a more representative subset of the general population compared to the clinic-based participants used in the Lessig study, this sample was not as ethnically diverse nor as representative as might be desirable. Even though the CDT has been shown to be free of cultural bias (Leung et al., Reference Leung, Lui and Lam2005), a stronger case for the reduced Jouk system could have been made if it had been possible to examine this directly. Cross validation of the Jouk scoring system in an independent sample is needed as well.
Conclusions
This study sought to simplify the scoring system of the CDT with the aim of creating a more generalized and streamlined but sensitive dementia-screening test. Not only was the Lessig system validated, but a second simplified scoring method was developed and validated as well. In addition, this study broadened the CDT scoring system to a representative sample to mimic conditions a general clinician will encounter when working among a wide-ranging population and not at a dementia/memory clinic. The findings support the current literature that the CDT scoring system can indeed be reduced while still maintaining fairly high sensitivity. The lower specificity found in this study, however, suggests that the Jouk scoring system may be best suited for use in situations where it is more important to classify individuals in their condition group by increasing false-positives. In general, the findings underscore the importance of evaluating all aspects of a scoring system's performance, as certain qualities of the system may make it more or less appropriate for the task at hand (e.g. screening for dementia vs. answering a research question). Since no screening measure can be perfectly valid, it is also important to use other assessment tests, clinical interviews, observations, and caregiver reports before arriving at a diagnosis. The simplified Jouk scoring system for the CDT can be used as a dementia screening measure, although caution must be exercised so as not to base a diagnostic decision solely on the results of this screening test alone.
Conflict of interest
None.
Description of authors’ roles
A. Jouk prepared the data for analysis, analyzed the data, and wrote the paper; H. Tuokko originally formulated the research question, provided the data, and supervised/advised A. Jouk during all phases of the research process including study design, data analysis, and preparation of the paper.
Acknowledgments
The authors thank the BC Network for Aging Research for partly funding this research. The data reported in this paper were collected as part of the Canadian Study of Health and Aging. This was funded by the Seniors Independence Research Program, administered by the National Health Research and Development Program of Health and Welfare Canada (Project No. 6606-3954-MC[S]). The study was coordinated through the University of Ottawa and the federal government's Laboratory Centre for Disease Control. We also thank Dr Stuart MacDonald and Dr Mauricio Garcia-Barrera for their consultation on this project.