


Introduction
The past three decades have Seen a drastic reduction in arctic Sea-ice extent and thickness (vinnikov and others, 1999). as a consequence, there is a pressing interest to: (1) anticipate future ice conditions and their impact on ecosystems and human activities; and (2) better understand and predict the effect of a declining Sea-ice cover on the climate System, as reduced Sea ice is expected to reduce the earth’s Surface albedo. the current decline in ice cover appears to have begun in the early 1950s, in phase with a general increase in air temperature over the northern hemisphere (walsh and chapman, 2001). however, trends vary Spatially as the Sea-ice response to climate forcing differs between regions. this variability arises from complex interactions between air and Sea Surface temperatures, winds and ocean currents, and makes it difficult to Separate trends due to the recent anthropogenic climate warming from the background, ‘natural’ variability.
Changes in Sea-ice cover have been inferred from Satellite measurements (e.g. parkinson and others, 1999) or operational charts (e.g. kinnard and others, 2006) Spanning the last ∽30 years. historical observations, of lesser consistency, have been used to extend the record back 100 years (walsh and chapman, 2001), while local indices of Sea-ice extent have been developed for periods up to 400 years (kelly and others, 1987). the relatively Short instrumental and historical record makes the interpretation of current trends difficult, as our understanding of the natural modes of Sea-ice variability is limited. longer proxy records of Sea-ice cover are therefore needed to help put modern observations in the context of longer-term, natural variability, and forecast future Sea-ice conditions in a warming climate.
This paper presents results from an ongoing Study of past arctic Sea-ice variability over the last 1000 years based on ice-core records from the canadian arctic. arctic ice caps represent natural archives of past climates, as Snow layers deposited annually reflect the State and composition of the atmosphere (see legrand and mayewski, 1997, for a review). on devon ice cap (fig. 1), koerner (1977) found that the percentage of annual Snowmelt, as inferred by the thickness of melt-ice layers, was positively correlated with the fraction of open water through the queen elizabeth islands. although a potentially useful proxy for past Sea-ice conditions, the ice-core melt percentage primarily reflects Summer temperature forcing and can therefore not account for Sea-ice cover variability related, for example, to dynamic motion of the ice pack.
(a) Map of Study area, Showing locations discussed in the text; 1. Gulf of Boothia; 2. Committee Bay. Black area is average minimum (September) Sea-ice cover; grey area is average (March) maxium Sea-ice cover. (b) Close-up on the Baffin Bay region and ice-coring Site on Devon Ice Cap. NOW is North Open Water polynya.

Sea-salt aerosols deposited in Snow represent another possible indicator of Sea-ice conditions. these aerosols are emitted when bubbles created by breaking waves burst at the air–sea interface (blanchard and woodcock, 1980). the working hypothesis is that an increase (decrease) in open-water, or ice-free, area enhances (reduces) the potential emission, transport and deposition of Sea-salt aerosols on nearby ice caps. here we use this hypothesis to investigate the relationships between regional Sea-ice concentrations and the major glaciochemical Series in an ice core from the canadian arctic.
Study Site and Methods
In april–may 1998, a 302m Surface-to-bedrock ice core (D98) was retrieved from the Summit region of devon ice cap on devon island, nunavut, canada (75.32˚ n, 81.64˚w; 1930 ma.s.l.; fig. 1). the drill Site is ∽50km from the coast and has a mean annual air temperature of –23˚c. the core was processed and analyzed at the climate change research center of the university of new hampshire following well-established clean protocols (murphy, 2000). the data presented here are from the top 52m long firn Section of the D98 core. this Section was Sampled at 3 cm intervals, giving an average resolution of 13 Samples a–1 (see below). the Samples were analyzed using a dionexTM Suppressed ion chromatograph (ic) for major anions (cl–, no3 –, So4 2–) and cations (na+, k+, nh4 +, mg2+, ca2+). Stable-isotope ratios for oxygen (expressed as δ18o relative to Standard mean ocean water) were determined at the department of geophysics, university of copenhagen, denmark.
In most Summers on devon ice cap, Some Surface melt occurs, and this may alter Seasonal Signals in the δ18o and glaciochemical Series Such that confident resolution of these Signals is compromised (koerner, 1977, 1997). although no melt percent record is yet available for the D98 core, one was developed for another core (D99) collected a year later from a nearby Site. in the D99 record, the average melt percentage for the past 1000 years was 10%, but after the 1850s annual rates increased up to 50%, although the mean for 1980–99 remained only 12%. Studies on penny ice cap, baffin island, nunavut, have Shown that despite intense Summer melt there (50% average, Sometimes 100%), Seasonal glaciochemical cycles are Still preserved in the ice, albeit partly obscured by noise (grumet and others, 1998; goto-azuma and others, 2002). we feel reasonably confident that the comparatively lower Summer melt rates on devon ice cap have not altered the D98 chemistry to the point of obliterating meaningful interannual variability. identification of the bomb-produced 1963 tritium peak in the D98 core was used to calculate a mean ice accumulation rate of 0.245 ma–1 for 1963–98. Spectral analysis applied to the glaciochemical and δ18o Series also reveals Strong periodicities corresponding to ice layer thicknesses of 0.23–0.30 m, which Supports the preservation of a Seasonal or quasi-seasonal cycle in these Series.
Two depth–age relationships were used for the D98 core. the first was developed for the upper 11 m of the core by counting annual peaks in major ionic Species and δ18o values. annual cycles in na+, k+, mg+, ca2+ and cl– often Show a double concentration peak. these ‘doublets’ have been observed in Snow-pit and ice-core Studies in the canadian arctic and were attributed to Separate aerosol deposition episodes in late winter/early Spring and fall due to increased Storm activity during these time periods (goto-azuma and others, 1997; grumet and others, 1998; koerner and others, 1999; Sharp and others, 2002). the least negative δ18o values in the D98 core represent Summer precipitation and typically correspond to minima in major-ion concentrations, while peaks in these Same ions occur on the rising and falling limbs of the δ18o annual cycle. the year boundary in the core was therefore assigned to the δ18o maxima and corresponding minima in ionic concentrations, representing the end of Summer (august). this timescale covers the period 1980–97. despite the relative ease in identifying annual layers in the topmost part of the core, the process remains Subjective and is prone to errors of interpretation. we estimate the maximum error for this period to be less than ±1 year. the estimated from annual-layer counting is 0.257± 0.084ma–1 (1σ). this value agrees well with that calculated from the 1963 tritium peak, but the Standard deviation also points to Significant interannual variability (±33%), part of which may be due to local Stratigraphic noise (fisher, 1985).
The Second depth–age Scale used for the D98 core is based on an ice-flow model (dansgaard and johnsen, 1969) ‘tuned’ using volcanic reference horizons identified from major Sulphate peaks in the ice core. two volcanic events, katmai, alaska, USA, (AD 1912, at 25.5m ice depth) and laki, iceland, (AD 1783, at 44.35m ice depth) provided control points for dating the topmost 52 m of the core, which is interpreted as representing the accumulation period 1852–1997. the accuracy of this theoretical timescale was estimated to be better than 4.5 years (see appendix).
The Sea-ice data used in this Study come from the canadian ice Service (CIS) weekly operational charts, available year-round Since 1980. each chart Supplies total Sea-ice concentration (ct) in tenths per gridcell on a 0.25˚×0.25˚ regular grid. the cis dataset was used because of its high Spatial resolution and because it offers a better coverage of transitional periods (ice break-up and ice melt) than ice concentrations derived from passive microwave measurements. the ct data were averaged into annual values, giving 18 year long gridded Series of mean annual ct. full descriptions of the data preparation and homogenization Steps are given in kinnard and others (2006).
Heterogeneous correlation maps between the D98 glaciochemical time Series and the CT Series were calculated in order to identify potential relationships between these variables. for the D98 core, annually averaged ionic concentrations were used because Snowfall and aerosol deposition are not evenly distributed through the year, and therefore these Series cannot be Sub-annually resolved with absolute confidence. Significance levels for all correlations were computed by monte carlo Simulation. each time Series was randomly reordered 200 times, and the correlation coefficients (r) recomputed. the 95% Significance threshold was determined from the distributions of r, and the procedure was repeated at each gridpoint of the ct Series to obtain a map of Significance levels.
Results
Glaciochemistry
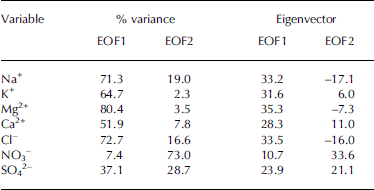
The D98 time Series of major ions and δ18o for the calibration period 1980–97 are presented in figure 2. ammonium (nh4 +) has a more complex origin than other ions and is not discussed in this paper. to investigate the covariability between various ionic Species, an empirical orthogonal function (Eof) analysis (ribera and others, 2001) was performed on time Series of the Seven remaining (standardized) ionic variables for the period 1852–1997 (N = 1546 Samples). the estimated Standard errors (north and others, 1982) Suggest that the first two eof modes are distinct, the next two may be mixed, and numbers 5–7 are distinct from each other but together only account for 8% of the total variance. the two dominant modes, Eof1 and Eof2, account for 55.1% and 21.5% of the total variance, respectively. Eof1 has positive loadings on mg2 + (80.4%), cl– (72.7%), na+ (71.3%), k+ (64.7%) and, to a lesser extent, ca2+ (51.9%) and So4 2– (37.1%). Eof2 has positive loadings on NO3 – (73%), So4 2– (28.7%) and lesser negative loadings on na2+ (19%) (table 1). in coastal environments na+, mg2+ and cl– deposited in Snow are almost entirely derived from Sea Spray, while k+ and ca2+ may have both a Sea-salt and crustal (soil dust) origin. Sulphate (SO4 2 –) has multiple Sources that include Sea Spray, marine biogenic emissions, volcanism and, over the last century, industrial pollution (keene and others, 1986; legrand and mayewski, 1997). here the dominant mode of glaciochemical variability (Eof1) appears to capture primarily a Sea-salt Signal. in contrast, Eof2 is interpreted as representing an arctic haze Signal, with SO4 2– and no3 – concentrations rising Since the 1950s (goto-azuma and koerner, 2001).
Time Series of major ions, δ18O and Eof1 in the D98 ice core for the period 1980–97.

Results from Eof analysis of glaciochemical data
Correlation with Sea-ice concentration
figure 3 Shows correlation maps between annually averaged time Series of CT, na+ and Eof1. the correlation maps between CT, mg2+ and cl– (not Shown) are Similar. both maps Show maximum negative correlations over baffin bay (r min ∽ –0.80) and Scattered positive correlations over the beaufort Sea area, davis Strait/labrador Sea area (DS/LS) and hudson bay (fig. 3). the negative correlations over baffin bay between ct and Eof1 are Stronger (r min = –0.85) and more Spatially widespread than for individual Sea-salt Species (e.g. na+). most positive correlations in the DS/LS region are below the 95% Significance threshold. these results indicate that the Sea-salt Signal in Eof1 increases mainly when reduced Sea-ice concentrations occur over baffin bay, Suggesting that Sea-salt aerosols reaching devon ice cap originate primarily from that area. Eof1 can then be taken as a proxy indicator of Sea-ice conditions in the baffin bay area.
(a, b) Heterogeneous correlation maps between annually averaged Series of CT and Na+ (a) and Eof1 (b). (c, d) Corresponding areas of Significant correlation (p < 0.05) for Na+ (c) and Eof1 (d). Numbers refer to areas of Strong correlation presented in Table 2.

The Seasonality of the CT–Eof1 relationship was investigated by correlating Seasonally resolved (gridded) CT time Series with the annually averaged Eof1 Series. very few Significant correlations were found in winter (january–march; fig. 4a). however, locally high negative correlations (r min = –0.81) were found along the eastern coast of devon island, in lancaster Sound to the South and also in prince regent inlet, the gulf of boothia and committee bay (see fig. 4a inset). these regions correspond to the location of Sea-ice leads that form recurrently during winter. the lead Systems in lancaster Sound, prince regent inlet and committee bay typically open between november and february in response to ocean and tidal currents (smith and rigby, 1981), and may represent locally important Sources of Sea-salt aerosols. negative correlations between ct and Eof1 in winter were also found in the north open water polynya (now; See fig. 1), but these are not Statistically Significant. although open-water conditions are common at the head of Smith Sound in winter, the main area of open water does not begin to expand Southward in northern baffin bay until may (smith and rigby, 1981).
During Spring (april–june) the areas of negative correlation expand over north baffin bay, especially its western part (fig. 4b). this is consistent with ice break-up which begins there and progresses Southward, and with the area of maximum interannual variability in Spring ct for the eastern arctic (kinnard and others, 2006). Significant positive correlations are also found in the kane basin and nares Strait between greenland and ellesmere island, as well as in the DS/LS region. these findings Suggest that reduced Springtime ct in north baffin bay tends to occur Simultaneously with increased ct in the DS/LS and nares Strait regions. the mean annual Sea-level pressure (SLP) pattern for the area Shows a trough extending from a quasi-stationary low South of greenland, and into north baffin bay. this pattern results in predominant northerly Surface winds over much of baffin bay, and Southerly winds along the west coast of greenland, which imparts the typical anticlockwise Sea-ice gyre motion observed in baffin bay (barber and others, 2001). in years with Stronger northerly winds, the flux of ice through nares Strait may result in the formation of an ice bridge across Smith Sound, Slowing or even blocking further ice flux into baffin bay (barber and others, 2001). Stronger northerly winds over baffin bay also advect more ice Southward into the DS/LS region, which increases open-water areas in north baffin bay. this Scenario appears to be reflected in the positive correlations found between ct and Eof1 in nares Strait/smith Sound and the DS/ls region, and in the negative correlations found in baffin bay (fig. 4b).
During Summer (july–september), Significant negative correlations (rmin = –0.88) are found primarily in central/east baffin bay (fig. 4c), which coincides with the area of maximum interannual ct variability in this Season (kinnard and others, 2006). while baffin bay is typically clear of ice by late august, conditions over the Summer may vary from year to year, depending on air temperature, ocean circulation and antecedent ice conditions (cis, 2002). the Strongest and most Spatially extensive negative correlations between ct and Eof1 occur in the fall (october–december) over the whole of baffin bay (fig. 4d). during these months, ice forms in north baffin bay and expands Southward depending on ocean currents and weather Systems (CIS, 2002). we hypothesize that delayed freeze-up or increased Southward advection of ice in baffin bay is causing the regional negative ct anomaly which anticorrelates with the D98 Sea-salt record (Eof1).
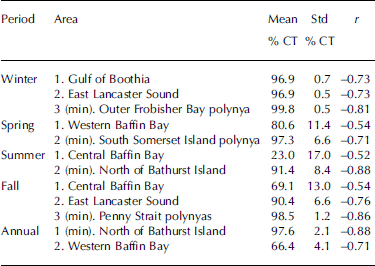
In order to obtain visual confirmation of the aforementioned correlations, key areas were chosen in the calculated correlation maps (annual and Seasonal). time Series of ct for gridpoints Showing maximum negative correlations with Eof1 were plotted for each map, as well as other Selected ct time Series representing areas of widespread negative correlations, Such as baffin bay (fig. 5). Standardized Series were used for direct comparison between ct Series and Eof1. the mean and Standard deviation for each extracted ct Series are given in table 2, along with their geographic location, and correlation coefficients (r ) with Eof1. the highly negative correlations between Selected polynya regions and Eof1 during winter arise because of the anomalously low ct of 1992. these conditions (like those in 1981 in the outer frobisher bay polynya) may have contributed to a higher than average Sea-salt flux on devon ice cap. remarkably, the most negative correlations between ct and Eof1 during the other Seasons also occur in areas with polynyas. these correlations are Sometimes Surprisingly high, especially during Summer and fall (table 2; fig. 5). although not as high, correlations in baffin bay do appear in all Seasons except winter.
Heterogeneous correlation maps between Seasonal CT and Eof1 during winter (a); Spring (b); Summer (c); and fall (d). Insets Show areas of 95% Statistical Significance. Numbers refer to areas of Strong correlation presented in Table 2.

Comparison between annually averaged time Series of Eof1 and Selected CT Series from areas of pronounced negative correlation. Note: Eof1 is inverted for better comparison with CT Series. Numbers refer to the corresponding locations on the correlation maps of Figures 3 (annual) and 4 (seasonal).

Areas of Strong correlation (r) between Eof1 and Seasonal and annual CT; min. is gridcell with most negative correlation
Discussion
The negative correlation found between baffin bay ct and Sea-salt aerosols in the D98 core (represented by Eof1) is consistent with our hypothesis that reduced Sea-ice cover leads to greater emission of Sea-salt aerosols. increased wind fetch over open water results in more Surface waves, which favours Sea-spray production (blanchard and woodcock, 1980). Sea-salt particles are typically contained in the coarse mode of the atmospheric aerosol, which limits their atmospheric residence time and potential transport distance (barrie, 1985). hence most Sea-salt aerosols deposited on devon ice cap are likely to come from nearby, rather than distant, Sources. the cl–/na+ ionic ratio in the uppermost 52m of the D98 core is 1.07±0.02 (N = 1546; r 2 = 0.85).
This is close to the Sea-water ratio of 1.17 (keene and others, 1986), which Suggests that these ions were derived primarily from nearby open-water areas, with little fractionation during airborne transport (legrand and delmas, 1988). deviations of the cl–/na+ ratio from the Sea-water ratio mostly occurred at low na+ concentrations.
An alternative interpretation for the Sea-ice–sea-salt relationship was proposed in antarctica, where Salty ‘frost flower’ crystals formed over polynyas and leads can dominate the Sea-salt budget in marine aerosols (rankin and others, 2002). freezing of highly Saline brine below –8˚c precipitates mirabilite (sodium Sulphate decahydrate), which is Strongly depleted in Sulphates. a deficit of non-sea-salt Sulphate (nssso4 2– in excess of the Sea-water ratio) in Snow or ice is then taken as diagnostic of the presence of an important Sea-ice (frost flower) Source for Sea-salt aerosols. Such a deficit was observed in ice cores from non-coastal antarctic Sites, which led wolff and others (2003) to propose that Sea-salt variability at these Sites may reflect Sea-ice production rather than changes in open-water area. in the devon ice cap core, however, the nssso4 2– content before the industrial era (AD <1900), calculated using the method of o’brien and others (1995), is always positive and represents over 90% of the total Sulphate load. hence, we assume that the main Source of Sea Salts is from open water rather than the Sea-ice Surface (aristarain and delmas, 2002). however, we acknowledge that because nssso4 2– input from other Sources (e.g. marine biota) can be Significant, it could mask the diagnostic low So4 2– Signature of aerosols derived from frost flowers. furthermore, we would expect to find positive correlations between ct and Eof1 if Sea Salts were mostly produced over newly formed ice. this is not the case. instead, the few Significant positive correlations were found in areas of predominant old Sea-ice cover, as discussed earlier.
Our correlation analysis of Eof1 against Seasonal ct Suggests that local lead and polynya Systems may contribute to the annual input of Sea Salts to devon ice cap, but that these Source areas are Spatially restricted. in terms of correlation Strength, the relationship between Eof1 and ct in baffin bay is Similar for the Spring, Summer and fall Seasons. although maximum open-water conditions usually occur in late august/early September, correlation maps Suggest that the most extensive Sea-salt-producing areas exist between october and december. while the amount of open water may limit the Source area for Sea-salt aerosols, wind patterns and Storm trajectories Strongly control their delivery to the ice cap. baffin bay is an area of intense cyclonic activity, with both cyclogenesis and cyclolysis occurring regularly (serreze, 1995). cyclone intensity throughout the arctic is greater during the cold months (october–april) than during the warm months (may–september), with a maximum in february and a minimum in july (zhang and others, 2004). in baffin bay, maximum (minimum) wind Speeds occur during winter (summer), while the amount of precipitable water peaks in Summer (barber and others, 2001). data from automated weather Stations maintained on ice caps in the eastern canadian arctic Show that most precipitation there falls as Snow in the Spring and fall Seasons (e.g. Sharp and others, 2002), in concurrence with the deposition of Sea-salt Species (goto-azuma and others, 1997; koerner and others, 1999; Sharp and others, 2002). the interplay between moisture availability from open-water Sources (greatest in Summer) and wind transport efficiency (greatest in winter) results in a Seasonal cycle of precipitation and Sea-salt flux that peaks during the transition periods of Spring and fall. in particular, the fall months are when the fraction of open water is Still great and cyclonic activity most intense, which effectively maximizes emission and dispersal of Sea-salt aerosols in this Season. while the broad zone of negative correlation between annual ct and Eof1 (fig. 3) is due mainly to interannual changes in fall ct, the area of maximum negative correlation within baffin bay is found over its western portion (fig. 3), and is due mainly to Spring ct variations (fig. 4b). hence, Eof1 appears to reflect the overall ct variability in baffin bay during the ‘warm’ Season (spring to fall), with possible year-round influence from leads and polynyas.
Time Series of the first mode of glaciochemical variability in the D98 core (Eof1) for the period 1852–1998 are Shown in figure 6. also Shown for comparison are ice-core time Series of δ18o (a proxy for regional air temperature) and melt percentage (a proxy for Summer warmth) developed from the Same Site, and a Surface air-temperature (sat) record from upernavik, greenland, for 1875–1999 (polyakov and others, 2003). over the 146 year period considered, Eof1 Shows considerable variability at both decadal and interannual Scales. it is noteworthy that the Eof1 index generally increased Steadily from the early 1950s to the late 1990s, indicating an increasing flux of Sea-salt aerosols to devon ice cap during this period. if our interpretation of the Sea-ice–sea-salt relationship is correct, this trend is consistent with the decline in Sea-ice extent observed in the northern hemisphere Since the 1950s (walsh and chapman, 2001).
(a) Time Series of Eof1 for the period 1852–1997. The bold line is an 11 year running mean to highlight decadal variability. (b) Same as (a) but for δ18O values. (c) Five-year averages of melt percentages from the D99 core. (d) Measured SAT at Upernavik for the period 1875–1999, with 11 year running mean bold line. The black horizontal lines on each graph represent the mean of the Series.

The Eof1 and δ18o time Series Show little resemblance on an interannual timescale but appear to be inversely correlated at the decadal timescale (fig. 6b). the correlation is low (r = –0.243), but Significant at the 99% level. the D98 δ18o record captures Some of the low-frequency trends in Sat recorded at upernavik (fig. 6d). however, the melt percent record from the D99 core better captures the Step-like warming of the early 1920s (fig. 6c). there is also little resemblance between the D99 melt record and our Sea-salt proxy. a Similar but more pronounced inverse relationship between δ18o and Sea-salt concentrations has been found in greenland ice cores, and attributed to more efficient Sea-salt transport during cold periods due to increased Storminess (o’brien and others, 1995; fischer and others, 1998; dawson and others, 2003). So while Sea-salt variability in greenland ice cores appears to result primarily from changes in meteorological factors, our analysis Suggests that the devon ice cap Sea-salt record is more closely linked to changes in regional Sea-ice cover. it is, however, expected that our Sea-ice proxy Should also partly reflect the meteorological conditions driving the Sea-ice anomalies. a Similar interpretation was proposed for the ice-core Sea-salt record from penny ice cap (grumet and others, 2001).
The lack of positive correlations between our Sea-salt proxy and the δ18o and upernavik Sat Series Suggests that Sea-ice cover (ct) in baffin bay is not controlled directly and/or uniquely by air temperature. one mechanism already discussed may produce reduced ctunder colder conditions: when northerly winds force Sea ice to accumulate in nares Strait, blocking the flux of ice into baffin bay while allowing existing ice in the bay to drift Southward (barber and others, 2001). kinnard and others (2006) have Shown that the dominant mode of variability in monthly ct anomalies is a north-to-south contraction of the ice edge which occurs on a decadal timescale, mainly in response to the north atlantic oscillation (NAO). it is hypothesized that increased ct occurs in the DS/LS region and hudson bay in response to northerly winds and decreased Sat over the eastern arctic during positive phases of the nao. enhanced northerly winds advect ice Southward during the cold months, and, when the ice bridge forms in nares Strait, open-water areas develop in baffin bay, resulting in a dipole pattern of Sea-ice cover with the DS/LS region. an eof analysis performed on annually averaged gridded ct Series Shows a comparable pattern for the dominant mode of Sea-ice cover variability (not Shown).
Polyakov and others (2003) have Shown that Sats measured at arctic coastal Stations Since 1875 display considerable inter-decadal variability (50–80 years), which they refer to as the low-frequency oscillation (LFO). the lfo may be linked to Slow changes in oceanic thermohaline circulation in the north atlantic. in its positive phase, the lfo is associated with reduced SLP and Sat and increased wind vorticity over the baffin bay region. the resulting wind-stress field tends to increase Sea-ice mobility and redistribute it more vigorously via the baffin bay gyre. increased cyclonic activity in the region during the positive phase of the lfo could also increase emissions and transport of Sea-salt aerosols, especially in the fall when Sea-ice cover is near its minimum. thus the lfo may represent one mechanism accounting for decadal covariability between the D98 Eof1 record and baffin bay ct.
Conclusions
We found a Statistically Significant inverse relationship between annually averaged Sea-salt concentrations (represented by Eof1) in the D98 ice core from devon island, and ct in the baffin bay area over the period 1980–97. this relationship is consistent with our hypothesis that reduced Sea-ice cover expands the Source area for Sea-salt aerosols, thereby allowing for greater emissions and Subsequent deposition in Snow on the ice cap. the mean cl–/na+ ratio in the D98 core also indicates that the bulk of Sea-salt aerosols originate from nearby Sources. our results are in good agreement with those of grumet and others (2001), who found an inverse correlation (r = –0.26, p < 0.05) between time Series of Sea-ice cover in baffin bay and Sea-salt na+ in an ice core (p95) from penny ice cap over the period 1901–90. these authors also found that increased Sea-salt concentrations in the p95 core resulted from the interplay between reduced Sea-ice cover in baffin bay and increased atmospheric transport associated with a positive nao index. murphy (2000) followed the Same approach using the D98 core, and found a better correlation with Summer Sea-ice extent in the now (r = –0.46, p < 0.05) but a weaker correlation for baffin bay (r = –0.34, p < 0.15). our own approach differs from these Studies in that we used heterogeneous correlation maps of Eof1 and ct to identify regions of greatest Sea-ice–sea-salt correlations, rather than testing the Strength of these correlations over predefined regions. our findings further demonstrate that ice-core glaciochemical proxies can yield meaningful information on past arctic Sea-ice conditions and variability at the regional Scale. our Sea-ice proxy Suggests a dominant influence of dynamical factors on the control of Sea-ice variability in baffin bay over the past ∽150 years.
Acknowledgements
This Study was funded by the cryosphere System in canada project (CRYSIS) at environment canada, and the canadian foundation for climate and atmospheric Sciences (CFCAS). funding to c. kinnard by the natural Sciences and engineering research council of canada (NSERC) is appreciated.
Appendix
The cumulative error between the theoretical timescale, which assumes constant accumulation rate  and the true unknown accumulation rate function λ
(
t) is:

Where t = 1 :N is the number of years between two well-dated points (e.g. the katmai and laki volcanic horizons). the function λ(t) is assumed to be a white or blue Stationary noise process with a mean  and Standard deviation σ. the white-noise model is a more conservative assumption and is used here. attenuation of ice layers is assumed to be negligible in the firn Section of the D98 core.
 is calculated as the ice thickness between the two fixed points divided by N years. σ must be estimated from known accumulation Series. σ is 30% of
 for the upper 11 m of the D98 core, but values of 20–25% are more common from the literature and from mass-balance measurements. the maximum error in units of depth (m ice) is E
max = max(Y(t)). in time units (years),
 E
max is computed for n = 5000 Surrogate λ(t) Series, and the 95% percentile of the distribution is taken as a conservative estimate of the maximum error expected in the theoretical timescale. for a white-noise model with σ = 30% and N = 146 years, this gives an E
max of 4.5 years. this is in good agreement with the <5 year error estimated by zheng and others (1998) for an ice core from agassiz ice cap, ellesmere island, over the past 1000 years.



