I. INTRODUCTION
Bulk metallic glasses (BMGs) are a relatively new class of engineering metals that have been widely investigated as potential high-performance materials for a variety of applications, from bulk structural hardware to microelectromechanical systems (MEMS).Reference Greer1–Reference Peker and Johnson6 Unfortunately, BMGs have been underutilized in high performance structural applications due to their abrupt failure in unconfined loading, their low fracture toughness, and low fatigue limit.Reference Xu, Ramamurty and Ma7–Reference Launey, Hofmann, Johnson and Ritchie9 Recently, significant progress has been made toward toughening BMGs by developing a series of ductile phase-reinforced BMG matrix composites (BMGMCs), which combine soft crystals (usually body-centered cubic) with a metallic glass matrix.Reference Hays, Kim and Johnson10–Reference Qin, Zhang, Asami, Kimura, Wang and Inoue17 Although these BMGMCs first emerged a decade ago, a correlation between processing and mechanical performance was not realized until recently.Reference Hofmann, Suh, Wiest, Duan, Lind, Demetriou and Johnson12, Reference Hofmann, Suh, Wiest, Lind, Demetriou and Johnson13 When cast from the liquid, BMGMCs exhibit a wide range of dendrite morphologies that develop as a result of thermal gradients during cooling. By processing the composites below the liquidus temperature, in the semisolid two-phase region, a more uniform microstructure can be obtained. It has been demonstrated that the length scale associated with the dendrites is directly related to the fracture toughness of the composites. For example, a BMGMC, termed LM2 (Zr56.2Ti13.8Nb5.0Cu6.9Ni5.6Be12.5), cast from the liquidus exhibited a plane strain fracture toughness of K 1C = 31 MPa m1/2 (Ref. Reference Flores, Johnson and Dauskardt18), which represents a twofold improvement over the fracture toughness of the matrix BMG, Vitreloy 1 (Zr41.2Ti13.8Cu12.5Ni10Be22.5), K 1C = 15 MPa m1/2 (Ref. Reference Lowhaphandu and Lewandowski19). By processing a BMGMC with similar properties when cast from the melt, DH1 (Zr39.6Ti33.9Nb7.6Cu6.4Be12.5), semisolidly, the fracture toughness is dramatically enhanced, K 1C = 97 MPa m1/2 (Refs. Reference Launey, Hofmann, Suh, Kozachkov, Johnson and Ritchie8,Reference Hofmann, Suh, Wiest, Duan, Lind, Demetriou and Johnson12).
The effect of processing on the mechanical properties and microstructure of BMGMCs has been well established utilizing quasistatic and even dynamic mechanical testing (see Refs. Reference Chen, Chen, Xu, Du, Li and Liu20–Reference Qiao, Feng, Zhang, Zhang, Liaw and Chen25), such as tension tests and fracture toughness tests, but not as widely for impact testing (Charpy or Izod). The objective of the current study is to investigate the effect of processing on the Charpy impact toughness (CIT) of a series of Zr–Ti–Be-based BMGMCs and to compare those results with some common high-performance crystalline materials. The Charpy impact test was selected for its simplicity in estimating notched toughness at moderately high-strain rates and has not been widely used for BMGs because the American Society for Testing and Materials standard-sized specimen (10 × 10 × 55 mm3) typically exceeds the critical casting thickness of many glassy alloys and requires at least 30 g of material per test (for Vitreloy 1, for example). Several groups have investigated the impact toughness of monolithic BMGs in compact (miniaturized or substandard) dimensions, primarily with the focus of investigating the ductile-to-brittle transition.Reference Raghavan, Murali and Ramamurty26–Reference Park, Lim, Park, Shin, Lee, Kim and Kim30 For example, Raghavan et al. demonstrated a substandard impact toughness of 1.2 J in compact Charpy samples of Vitreloy 1 at room temperature, whereas Park et al. looked at the impact toughness of BMG/metal laminate composites. The major objective of the current work is to compare the CIT of two representative BMGMCs produced through suction casting (SC) from above the liquidus temperature with those produced by semisolid processing, both in 3-mm-thick samples. As such, the selected geometry for the testing is a compact specimen (3 × 3 × 30 mm3), which can be rapidly produced on a mini-suction casting arc melter. Although larger samples of the Be-bearing BMGMCs can be produced, the smaller geometry was selected so that future work on non-Be–bearing BMGs, which typically cannot be produced thicker than 3 mm due to cooling constraints necessary to produce BMGs, can be directly compared with the current results. The impact toughness of the compact specimens are directly compared with commercially available BMGs and common crystalline alloys for validity of the testing. In addition, the hardness of each alloy tested was measured and compared.
II. MATERIALS AND EXPERIMENTS
Two different BMGMCs were produced and examined in this work, one based in Ti with 40% volume fraction of crystalline phase (DV1)Reference Hofmann, Suh, Wiest, Lind, Demetriou and Johnson13 and one based in Zr with 67% volume fraction of crystalline phase (DH3)Reference Hofmann, Suh, Wiest, Duan, Lind, Demetriou and Johnson12; the compositions are given in Table I. The composites were produced by arc melting high-purity elements in a Ti-gettered argon environment. Charpy specimens were produced either by SC square beams or by semisolidly forgingReference Hofmann, Kozachakov, Khalifa, Schramm, Demetriou, Vecchio and Johnson31 (SSF) 3-mm-thick plates and then cutting them into beams. The 3 × 3 × 30 mm3 samples were then mounted and notched en masse with a 90° notch 1-mm-wide and 0.5-mm-deep cut by an endmill. These samples were compared with a monolithic glass (Vitreloy 1)Reference Peker and Johnson6 and a BMGMC (LM2),Reference Hays, Kim and Johnson10, Reference Szuecs, Kim and Johnson11 both obtained commercially. The Vitreloy 1 samples were broken and suction cast, whereas the LM2 samples were cut from a large 3-mm-thick plate. Crystalline alloys used for comparison (rolled 304 Stainless Steel, Al-2024-T6, Al-7075-T6, and Grade 5 Ti-6Al-4V) were cut from 3-mm (1/8 in) plates and notched using the endmill.
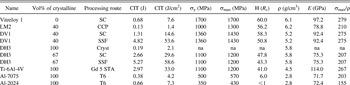
Physical and mechanical properties of the 11 different samples used in this study.

Yield strengths, ultimate tensile strengths, and Young’s Modulus for the crystalline alloys were obtained from www.matweb.com, a materials property database. Compositions in at.%: Vitreloy 1, Zr41.2Ti13.8Cu12.5Ni10Be22.5; LM2, Zr56.2Ti13.8Nb5.0Cu6.9Ni5.6Be12.5; DV1, Ti48Zr20V12Cu5Be15; and DH3, Zr39.9Ti33.9Nb7.6Cu6.4Be12.5. Processing conditions are SC, CCP, SSF, cryst, STA, and CIT.
CIT, Charpy impact toughness; SC, suction cast; CCP, commercial cast plate; SSF, semisolid forge; cryst, crystalline; na, not applicable; STA, standard.
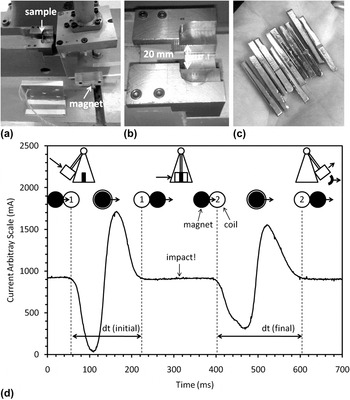
Charpy tests were performed on a modified Riehle Impact Testing Machine, which was instrumented to detect small changes in hammer velocity (Fig. 1). Standard Charpy machines operate from two drop heights, 61 and 122 cm (24 and 48 in) with two hammer masses so that four impact energies can be obtained, 41, 81, 163, and 325 J (30, 60, 120, and 240 ft-lbs). Unfortunately, full-sized Charpy testing on Zr–Be-based BMGs from literature indicate only 1–5 J of energy is absorbed, whereas Zr–Be-based BMGMCs absorb 25–45 J.Reference Hofmann, Suh, Wiest, Duan, Lind, Demetriou and Johnson12, Reference Raghavan, Murali and Ramamurty26–Reference Shin, Kim, Jung and Ko29 Since the cross-sectional area of the compact samples in the current work is ∼10 times smaller, the amount of energy absorbed would be nearly undetectable using a standard drop height and hammer mass. As such, the Charpy tester was modified by reducing the drop height and the hammer mass and the impact energy was measured both by dial and computer. By equating the potential energy of the hammer at the drop height (PE = mgh) with the kinetic energy of the hammer at impact (KE = ½ mv2), the initial velocity (v0) of the hammer before impact is found to be a function only of the height of the drop

Instrumented small-scale Charpy testing. (a) The pendulum hammer has been stripped of mass to reduce the impact energy. A plastic extension has been built to hold the magnet. As the pendulum swings, the magnet passes a coil before and after impact, which registers a current. (b) The modified sample holder has a shorter span length of 20 mm for compact Charpy samples. (c) Suction cast (SC) samples of the alloy DV1. (d) Data obtained from an impact test on DH3 using a digital oscilloscope. The location of the magnet relative to each coil during the test is shown with a schematic. The hammer velocity slows during impact, which broadens the second peak. The width of the coils and magnets are known to be dx = 1 cm, so the velocity of the hammer can be determined through v = dx/dt. The energy during the impact is E = 1/2 mv2.

To instrument the machine, a 1-cm-diameter cylindrical magnet was attached to a plastic arm on the side of the hammer pendulum. Two 1-cm-diameter copper coils were mounted on a plate, 70-mm apart, with their midpoint located at the impact location [Fig. 1(a)]. The coils were wired to a digital oscilloscope connected to a computer. When the magnet attached to the hammer passes the first coil, it creates a voltage that registers as a sinusoidal peak on the oscilloscope. During the impact with the specimen, the hammer slows down before it passes the second coil, creating a difference in the width of the sinusoidal peak. The energy absorbed by the sample can then be determined through

The velocity of the hammer can be determined by v = Δx/Δt, where Δt is the width of the sinusoidal pulse (the transit time of the magnet across the coil) and Δx is the width of the coil. Using the known standard drop height of the hammer, the initial velocity was calculated to be 3.46 m/s; using this known velocity, Δx was calculated to be ∼1.0 cm for each coil by measuring the peak width. Using the known original impact energy and hammer height, the original effective mass of the hammer was calculated as 6.8 kg. To accommodate the small-scale specimens, the energy of the hammer was reduced by decreasing the hammer mass to 2.7 kg and the initial velocity to 2.0 m/s. The new drop height was calculated to be 21 cm (from the measured velocity) and, thus, the total energy of the hammer was reduced from 41 to 5.6 J. For samples requiring more than 5 J to fracture, a second drop height was calibrated at 83 cm imparting 22.2 J of energy at impact. A modified fixture to support the shorter samples was built as an insert into the existing Charpy fixture, as shown in Fig. 1(b). The span length was thereby reduced from 50 to 20 mm for the small-scale tests. The microstructures of the samples were analyzed through x-ray, backscattered scanning electron microscope (SEM), Rockwell hardness testing, acoustical measurements, and optical microscopy.
III. RESULTS AND DISCUSSION
Compact Charpy impact testing was performed on 10 alloys in total, six containing an amorphous phase and four crystalline alloys, see Table I for compositions and processing. Figure 2 is visual plot to the data shown in Table I, which shows the impact energy (in Joule) for each sample along with impact energy per cross-sectional area (in Joule per square centimeter). On average, seven samples of each type were impacted to observe the effect of processing variation on impact energy and the average value for each sample is shown in Fig. 2 with a circle. As a baseline, the monolithic BMG Vitreloy 1 was also evaluated via Charpy testing, as was done by several other groups.Reference Raghavan, Murali and Ramamurty26–Reference Shin, Kim, Jung and Ko29 Vitreloy 1, which is the most widely studied and commercialized BMG to date (often under the trade name LM1), is the matrix material for the composite LM2. The samples were obtained commercially in a high-purity form and were then broken up and suction-cast into beams. The impact energy for the monolithic samples was determined to be 0.68 J, which is similar to the results from other studies when scaled to full size, despite differences in sample geometry and origin. The crack propagation through the Charpy test of Vitreloy 1 also appears similar to the crack propagation through a fracture toughness tests done in other studies (see Ref. Reference Hofmann, Suh, Wiest, Duan, Lind, Demetriou and Johnson12).
Compact Charpy impact toughness values from 11 alloys tested; one bulk metallic glass (BMG), six bulk metallic glass matrix composites (BMGMCs) in various processing conditions, and four crystalline alloys. The processing conditions are commercially cast plate (CCP), crystalline (cryst), suction cast (SC), and semisolid forge (SSF). The maximum hammer energy for the low drop height is displayed on the plot along with a scaled estimation of the full-sized Charpy toughness. On average, seven samples of each alloy were tested and the average is plotted as a circle.

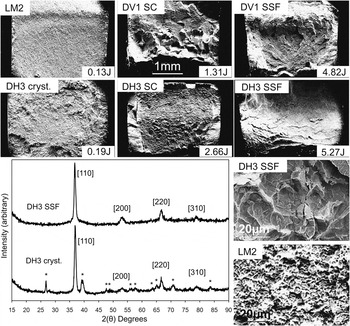
Surprisingly, the lowest impact energy observed, 0.13 J, was that of the commercially cast plate of the composite LM2, despite the 40% volume fraction of soft crystalline phase. The brittle fracture surface representative of the impact tests are shown in Fig. 3 and the microstructure is shown in Fig. 4. These cast samples were fabricated from commercial-grade starting materials, using graphite crucibles in an industrialized (low vacuum) process. Quantitatively, the impact toughness of the BMG alloys in this study can be measured using the energy absorbed during impact. Qualitatively, the impact toughness can be estimated by observing the relative roughness of the fracture surface, the number of shear bands observed on the sample’s surface, and the distance that shear bands are observed from the edge of the crack (which is an estimation of the plastic zone size). The lack of roughness in the fracture surface of the LM2 sample, shown in Fig. 3, demonstrates its low impact toughness, which is a well-known result from the smooth fracture surfaces observed in brittle crystalline metals after Charpy tests.
Fracture surfaces from six BMG composite samples tested in this study, along with their impact energy. X-ray scans from the composite DH3 in the SSF and the completely crystalline state are also shown. Although the body-centered cubic dendrites remain in the crystalline sample, the matrix is no longer amorphous, evident from the numerous peaks. Also shown are magnified fracture surfaces from DH3 SSF and LM2, showing the difference in the fracture pattern. Backscattered scanning electron microscopy (SEM) images from compact Charpy impact tests on the BMGMC DH3 (67% dendrites).

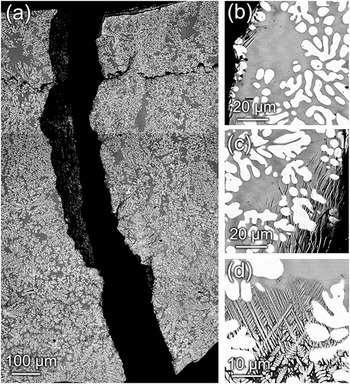
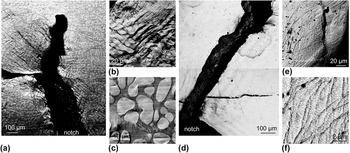
(a) A backscattered SEM micrograph showing a fractured specimen of commercially cast LM2. Despite the large, coarse dendrites, other factors (like oxygen content and partial crystallization) make this the most brittle alloy. (b) The edge of the crack from a region in (a) demonstrating very little toughness. (c) Another region near the edge of the crack showing that several shear bands have formed. (d) A region where the matrix has crystallized into an unknown brittle phase.

Figure 4(a) is a stitched backscattered SEM micrograph of LM2 showing both the bulk microstructure and a crack propagating through the entire width of a sample. It is of interest that the microstructure in the LM2 sample is actually quite coarse, despite being cast from near the liquidus temperature (which generally leads to a smaller microstructure). This particular sample was produced commercially by die-casting the liquid from a shot sleeve into a steel mold with the shape of a large plate. As such, the cooling rate for this sample was quite slow, which allowed the microstructure to coarsen to levels similar to the SSF samples, as seen in Figs. 5 and 6. The dendrite arms are ∼10-μm thick, and the spacing between the arms is 1–5 μm. The overall dendrites (i.e., the diameter of dendrite trees sectioned near their centers) are ∼100 μm in diameter and are spaced several 100 microns apart. Despite the coarsened microstructure, which is typical of highly toughened alloys, the crack generated during the impact essentially cleaves the LM2 sample [Fig. 4(b)], without significant blunting or branching. Although some regions near the crack exhibit shear bands [Fig. 4(c)], they only extend between 5 and 50 μm away from the edge of the crack. In total, very few shear bands are observed on the surface, which is indicative of a brittle failure. The reason for the low toughness is a combination of the high oxygen content in the BMG matrix (∼5000 ppm) and brittle intermetallic phases that have nucleated during the processing, as shown in Fig. 4(c). These brittle phases are either carbide remnants from the graphite crucibles used to cast these samples or from partial crystallization of the matrix due to insufficient cooling. The combined result is that the matrix BMG is brittle, which promotes easy crack formation and propagation.
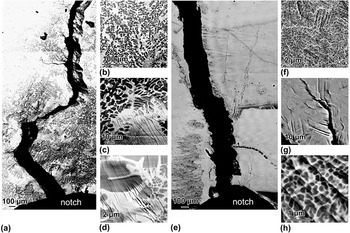
Backscattered SEM micrographs from the BMGMC DV1 (40% dendrites). (a) Crack originating at the notch and then propagating through a SSF sample during a compact Charpy test. (b) Initial microstructure obtained through SSF and (c, d) higher magnification of shear bands interacting with the Ti-based dendrites. (e) Crack propagating through a SC sample during compact Charpy test. (f)–(h) Higher magnification micrographs of the shear bands in the SC sample along with the nominal microstructure.

(a) Crack arrest and branching after impact in a SSF sample. (b) Near the edge of the crack, many shear bands have formed and been arrested by the soft dendrites. (c) Magnification of a region in (a) demonstrating that even far away from the crack, shear bands still form in the glass matrix. (e) Crack propagating through a SC sample of DH3 and (f, g) higher magnification images of the shear bands and microstructure.

The first composite that was prepared in the laboratory for Charpy testing was the Ti-based BMGMC DV1, which is notable for its large amount of tensile strain (∼15%) and its low density (5.17 g/cm3).Reference Hofmann, Suh, Wiest, Lind, Demetriou and Johnson13 Ten samples were produced by SC, and their impact energy is plotted on Fig. 2. What is immediately clear from the plot is that the SC produces a wide scatter in the impact energy of the composite, from as low as 0.56 J to as high 3.1 J with an average of 1.3 J. Unlike Vitreloy 1 (but similar to LM2), DV1 contains a metal crystal phase, whose morphology strongly affects the sample’s material properties. Although SC produces very uniform samples of Vitreloy 1, which is monolithic, the distribution of dendrites in DV1 is clearly not uniform between casts, which can be seen in Fig. 5. To demonstrate the effect of semisolid processing on impact energy, a 90 g plate of DV1 was fabricated utilizing an SSF technique developed in Ref. Reference Hofmann, Kozachakov, Khalifa, Schramm, Demetriou, Vecchio and Johnson31. The ingot was heated into the two-phase region consisting of glass and dendrites (at ∼950 °C), was held isothermally for ∼1 min to coarsen the microstructure, and was then forged between two copper plates into a 3-mm-thick plate. In the case of DV1, the effect of SSF was dramatic, with an average Charpy energy of 4.8 J, almost four times higher than the impact energy of the SC samples and with much less scatter.
The difference between the impact tests of DV1 produced by SC and SSF is shown in Figs. 3 and 5. The fracture surface from DV1 produced by SC shows a rougher surface compared to the smooth LM2 sample. The fracture surface from DV1 produced by SSF also exhibits a rough surface but has significant shear lips on the edges perpendicular to the notch. Stitched backscattered SEM micrographs of the crack propagating through both samples are shown in Figs. 5(a) and 5(e). In the case of SSF, the microstructure is coarse enough that it can be seen at low magnification. The crack moves in a jagged manner and exhibits severe blunting, especially at the notch. Damage is observed 1–2 mm away from the crack edge and is comprised of closely spaced shear bands (<10-μm separation) with significant damage evident in the dendrites [Figs. 5(c) and 5(d)]. The nominal microstructure, shown in Fig. 5(b), exhibits a dendrite arm size of 10- to 15-μm thick, and the spacing between the arms is 5–10 μm. The overall dendrites are ∼200 μm in diameter and are spaced several 100 microns apart. In contrast, the crack propagating through the SC sample shows much less branching and blunting, with shear bands observed only ∼100–200 μm from the edge of the crack. Although many shear bands are observed, as seen in Fig. 5(g), there are significantly less than in the SSF sample. The microstructure from the SC sample, shown in Fig. 5(f), is one order of magnitude smaller than the SSF sample. At low magnification, this makes the sample appear gray in Fig. 5(e). The dendrite arm size is 0.5–1 μm and their spacing is much less. The overall dendrite size is 5–10 μm in diameter, which is about 20 times smaller than the SSF sample. A highly magnified image of the dendrites and the shear band spacing is seen in Fig. 5(h). Although the impact toughness from the DV1 SC samples is about 3.5 times lower than the SSF samples, they are not brittle. In fact, the SC samples were 10 times tougher than the LM2 samples, despite their fine dendrite structure. Although the smaller dendrites are not as efficient at blunting the crack as the coarser dendrites, there is still a significant amount of damage near the edge of the crack.
The next composite that was impact tested was the Zr–Ti-based BMGMC DH3, which is notable for its large fracture toughness (173 MPa m1/2) and fatigue endurance limit (25% of yield strength), mostly caused by the increased volume fraction of soft dendrites (66%).Reference Hofmann, Suh, Wiest, Duan, Lind, Demetriou and Johnson12 Specimens of DH3 were prepared in a similar fashion to DV1, through SC and SSF, but also in a third way by crystallizing the matrix into a eutectic phase, as shown in the x-ray scans in Fig. 3. The x-ray scan from DH3 is a nominal scan for all the composites, which exhibit a superposition between an amorphous background and body-centered cubic diffraction peaks. The x-ray scan from the crystalline DH3 sample demonstrates that when the matrix phase crystallizes, many new intermetallic compounds are present. X-ray scans from the other composites are not shown.
The SC samples of DH3 show the reverse trend during impact testing like the SC samples of DV1. Instead of a wide distribution of data points, the Charpy energies are clustered very close to the average value of 2.7 J. In the case of DH3, the volume fraction of crystal phase is sufficiently large that the compact arc melter cannot fully melt all the dendrites before casting, leading to a more uniform microstructure during casting. Similar to DV1, the samples of DH3 subjected to SSF exhibited much higher average impact energy (5.3 J) than those produced by SC. In fact, the toughness of the SSF plates of DH3 exceeded the limit of the hammer’s impact energy and a larger drop height was required to break the samples, which at least in part attributed to the large scatter. As with the DV1 samples, the scale of the microstructure in the DH3 SC and SSF samples varies by approximately an order of magnitude. The nominal microstructure from the SSF samples, shown in Figs. 6(b) and 6(c), exhibits dendrite arms that are 10- to 15-μm wide and spaced ∼5 μm apart. The overall dendrite size is 100–200 μm. The scale of the dendrites is very similar to the DV1 SSF samples, just with a smaller interdendrite spacing due to the large volume fraction in DH3. In contrast, the dendrites from the DH3 SC sample exhibit an arm size of 0.5–1 μm, shown in Figs. 6(e) and 6(f), and a spacing of only a few 100 nm. The overall dendrite size is on the order of 5–10 μm in diameter.
As a direct comparison to the amorphous alloys, four high-performance crystalline alloys were also tested in the same geometry. The aerospace aluminum alloys Al-2024-T6 and Al-7075-T6 exhibited impact energies of 0.66 and 0.38 J, respectively, with very low scatter. Samples of Ti-6-4 were also tested in the same configuration, exhibiting average impact energy of 3.0 J. The impact energy of Ti-6-4 was most closely matched by the SC samples of DH3 but was surpassed by SSF samples of DV1, which exhibit similar mechanical properties (see Ref. Reference Hofmann, Suh, Wiest, Duan, Lind, Demetriou and Johnson12 and Table I). To illustrate the importance of having an amorphous matrix in DH3, we fabricated an ingot through semisolid processing and then cooled the alloy slowly by reducing the radio frequency (RF) power until crystallization was visible on the sample’s surface. As shown in the x-ray scan in Fig. 3, many crystalline phases are present from crystallizing the matrix and a differential scanning calorimetry scan was used to verify that very little, if any, glass phase remains. Although not shown, the microstructure of the sample appears similar to Fig. 4(d), with large coarsened dendrites and a crystalline eutectic matrix. The ingot was cut into several Charpy specimens, and the impact energy was measured to be 0.19 J (14 times smaller than the SC samples and nearly 30 times smaller than the SSF samples). The results are remarkable, but not unexpected. By crystallizing the glass, the toughness of the matrix goes down substantially, with a corresponding decrease in the critical size at which cracks form (100 μm in the glass to ∼10 nm in the crystalline eutectic).Reference Hofmann, Suh, Wiest, Duan, Lind, Demetriou and Johnson12 Since cracks form at such small lengths in the crystalline matrix, the dendrites, regardless of size, have no effect on toughening since cracks simply propagate through the matrix unimpeded. Even in DH3, with 67% volume fraction of crystal, the toughness decreases by more than an order of magnitude when the matrix is crystallized. The fracture surfaces from all three DH3 samples are also shown in Fig. 3 along with a higher magnification image comparing the dimpled fracture pattern between the tough DH3 SSF sample and the brittle LM2 sample. As expected, the brittle sample exhibits approximately an order of magnitude smaller dimple pattern than the toughest composite alloy (∼20 μm versus ∼2 μm). The fracture surfaces from the composites are shown in order of increasing toughness from the crystalline DH3 sample to the SC sample, to the SSF sample. In each case, the roughness increases with toughness as does the size of the shear lips on the sample’s edge (∼1 mm in DH3 SSF).
Lastly, rolled samples of 304 Stainless Steel were impacted, leading to an average of 9.5 J. These samples exhibited sufficiently high toughness that the hammer experienced substantial vibration and the results of the experiment were widely scattered. Only the average is plotted in Fig. 2.
It is also of note that the toughened BMG composite samples used in this study do not show a significant toughening effect from being in plane strain conditions due to the small sample sizes. This has been well observed during the construction of R-curves for fracture toughness testing (see Ref. Reference Launey, Hofmann, Suh, Kozachkov, Johnson and Ritchie8). Therefore, despite using compact specimens in this study, the results should scale to larger samples. This is evident by scaling the impact energy from the DH3 SSF sample up to a larger specimen (58 J) and comparing it with half-sized semisolidly processed Charpy tests done in Ref. Reference Hofmann, Suh, Wiest, Duan, Lind, Demetriou and Johnson12, also scaled up (45 J). They are of the same order. Nevertheless, the results of this study were compared with crystalline alloys (Al, Ti, and steel) in the exact same dimensions (3 × 3 × 30 mm3) so that a direct comparison would be valid.
In addition to impact energy, Table I also lists the standard mechanical properties of the alloys tested in this work. The yield strength (σ y), ultimate tensile strength (σ max), density (ρ), and specific strength (σ max/ρ) of the listed alloys allow a comparison between BMGMCs and crystalline alloys; some values for the crystalline alloys were taken from Matweb (www.matweb.com). In comparison to Ti-6-4, the increased strength of the BMGMCs counteracts their slightly higher densities and their specific strengths are about the same. The specific strengths of the BMGMCs also exceed that of the Al alloys, which have very low densities and low strengths. The hardness of the alloys was also measured in Table I using the Rockwell C scale. The monolithic BMG Vitreloy 1 exhibits the highest hardness of 60.0, which is similar to hardened tool steel. The composites exhibit a lower hardness than the monolithic glass, depending on the volume fraction of soft dendrites, with DH3 having the lowest hardness at 43.3. In both DV1 and DH3, the hardness of the composite formed by SSF was lower than that formed by SC due to the larger scale of the dendrites. All the composites exhibited a higher hardness than the hardest crystalline alloy tested, Ti-6-4, at 41.0. Both Al alloys and 304 steel were too soft for the Rockwell C scale, so a conversion from the Rockwell B scale was used instead. One potential disadvantage in using a BMGMC over a crystalline material in a structural application is the stiffness (or Young’s modulus), also listed in Table I. The composites, with their large elastic limits, have very low stiffness, typically half that of steel and significantly lower than Ti-6-4.
IV. SUMMARY AND CONCLUSIONS
The above results demonstrate the steep dependence of the material properties of BMGMCs, in particular of CIT, on processing techniques. In the example of DH3, the average impact toughness ranged from 0.2 J for one processing technique (crystalline) to 5.3 J for another (SSF), a roughly 28-fold increase from the same composition. Even when all the processing techniques applied preserved the glassiness of the matrix, as for DV1, one technique yielded CIT values ∼4 times higher than another. Given such strong dependence on processing conditions, the development of BMGMCs is facilitated by quick, repeatable techniques for characterizing the material properties yielded by a given set of parameters. The substandard-sized Charpy impact test used herein is one such method for quickly identifying the superior processing technique for each alloy. Provided that the correct processing techniques are applied, the resulting BMGMCs compare favorably to both BMGs and crystalline alloys, inviting further exploration of BMGMCs as high performance structural materials.
ACKNOWLEDGMENTS
The authors thank R. DeSalvo for assistance with the setup and Liquidmetal Technologies Inc. for supplying materials. D.C. Hofmann acknowledges financial support from the Jet Propulsion Laboratory, California Institute of Technology, under contract with the National Aeronautics and Space Administration (NASA). C.F. Zachrisson acknowledges financial support from American Association for the Advancement of Science Entry Point’s ACCESS, a program sponsored by NASA.