

Transportation is one of the significant factors of disaster preparedness. Victims must evacuate from devastated areas as quickly as possible. Rescue teams must be dispatched to victims who are waiting for treatment and supplies. Accurate and appropriate information on transportation route often divides life and death in disaster conditions.
SELECTION OF EVACUATION ROUTE
Prefectures, cities, towns, and villages have been developing evacuation programs for their residents. Residents and rescue organizations participate such evacuation drills. Predictions on large scale disasters are behind such activities.
The disaster predictions of some areas are alarming. The tsunami prediction at Kuroshio-cho, Kochi Prefecture, is an alarming 34.4 m (112 ft) high.1 The tsunami is predicted to invade the area at 8 minutes after the earthquake outbreak with a seismic intensity level of 7.2 At Kushimoto-cho, Wakayama Prefecture, a 17-m (55.2-ft) high tsunami is predicted to invade 3 minutes after an M9.1 Tonankai Trough mega-earthquake.3 Selection of evacuation routes is significant and often divides life from death. The development of an Individual Evacuation Program (IEP), which includes the best evacuation route selection, has been recommended.
DISPATCHING RESCUE WORKERS
Improvement of the logistics of rescue workers is one of the major issues in disaster preparedness. Improvements with the resilience of roads, railways, airports, and other transportation systems have been carried out for evacuation and rescue operations. The Japanese National Government is developing emergency transportation routes for disaster rescue operations.4 Information on such major roads is provided through the Ministry of Land, Infrastructure, Transport and Tourism web map of road information for disaster prevention.5 If provided, road information is expanded to local community roads, stairways, garden paths, and walkways, and it is expected that activities of rescue workers will be prevalent.
DATA ANALYTICS
Information on disasters is often acquired in exchange for the lives of people. Accumulated knowledge of disasters is a precious resource to improve disaster preparedness. If the knowledge is synthesized appropriately, disaster preparedness will be improved and the number of victims will be minimized.
The thinking process by experts has been trusted, so far, and the paradigm shift is happening. Classical statistics, which have been used over a century, are being replaced by machine learning or other artificial intelligence techniques. In the geoinformatics field, the Geographic Information System (GIS) is demonstrating its power. Topological analysis or other new techniques are driving out spatial statistics based on classical statistics.
The usefulness of GIS is being recognized. Unlike paper maps, a large amount of attribute data is attached with GIS map data. The GIS is able to present predicted seismic intensity, liquefaction area, predicted tsunami height, gradient of ground, and other attributes with major map data. Previously, the GIS was a tool for trained specialists, but improved interface enabled ordinary workers to operate the GIS. Now, high-spec topological functions are provided as easy-to-use plugins for non-expert persons.
DATABASE CONSTRUCTION AND DISSEMINATION
The GIS needs a large amount of data to operate. Without systematically accumulated data, the GIS is only a do-nothing-toy. Data needed to operate the GIS were collected by GIS users who have a technical background in geoinformatics.
As GIS becomes popular, geoinformatics experts have begun to provide GIS data as open source data to assist GIS beginners. It was recognized that use of the GIS will be further expanded if data are provided as ready-to-use open data. For new users of the GIS, selections of map and data attributes, such as geodetic system, data type, and layer specification, are not easy. Mixed use of data with different geodetic systems may produce serious problems in disaster preparation.
If road centerline data are accumulated and disseminated for public use, the data will be a powerful tool to improve disaster preparedness. This study intends to collect and disseminate the data for public use. Open use of such data will improve planning and activities of residents and rescue workers. More lives will be saved.
COLLECTION AND ACCUMULATION OF ROAD CENTERLINE DATA
Road Data of Traditional Maps and GIS
Road data provided by traditional maps are road edge data, which are presented by parallel lines from which humans are able to develop images of road width. However, the parallel lines only impose confusion upon computers. For computers, road width must be presented as road centerline data and direct distance from road centerline to the closest road edge.
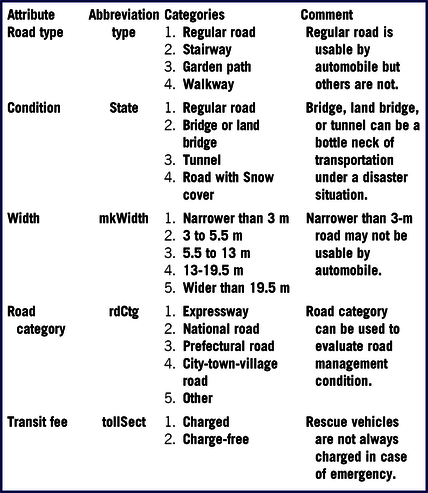
If road data are accumulated as road centerline data, many functions of GIS, such as network analysis and other topological techniques, are applied. Unlike road data of traditional maps, the road centerline data have abundant useful attributes as described later (Table 1). The combination of road centerline data attributes with other useful data has been left to GIS users’ discretion. The GIS users who are working in communities will be able to respond to residents’ needs and to present an easy-to-understand map by applying affluent visualization plugins.
Attributes Included in Road Centerline Data

Rapid Improvements in the GIS
From the road centerline research and GPS technology, much applied research has been derived. The use of road centerline data is proposed for disaster evacuation.Reference Shimura and Yamamoto6 It is possible to provide post-disaster information on evacuation and rescue routes immediately after the outbreak. Road centerline data are core data of a knowledge-based method for road damage detection.Reference Wang, Qin and Zhao7 Numerous techniques, which can be used for disaster preparedness, are being developed.
Road Centerline Data
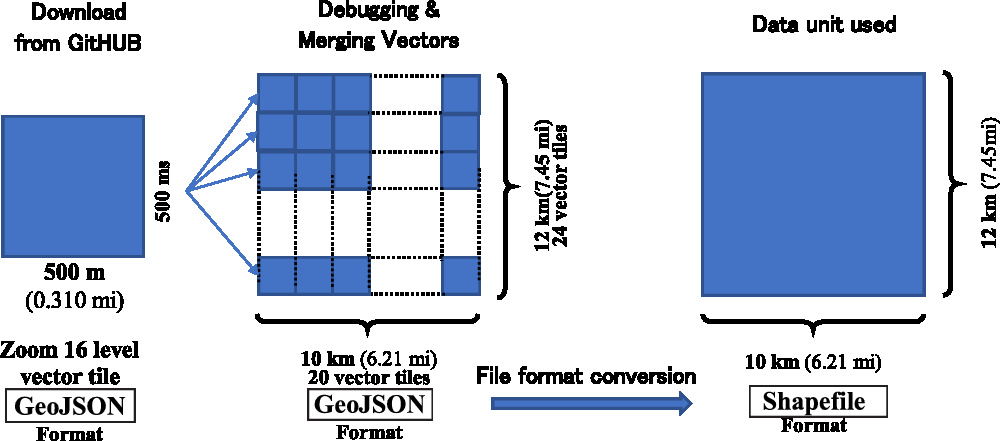
Geospatial Information Authority of Japan8 (GIAJ) started to release experimental vector tile format road centerline data through GitHUB repository after years of investigation.9 The tile data supported by the newest GIS technology are accurate but GeoJSON format tile data8 are provided by small level-16 vector tile of which the size is 500 m (0.31 miles).
GeopaparazziReference Chiaradia10 downloader was used to download Geospatial Information Authority vector tile data for this study. Downloaded vector tile data were merged by QGIS Version 3.4.4 vector merge function.11 In this study, a maximum of 480 (20 × 24) tiles was displayed simultaneously. Data provided by the GIAJ are experimental and still include bugs in attributes. Software skills are needed to merge many tile data while removing bugs.
Regular GIS users are not accustomed to the GeoJSON format and many of them do not have a high specification PC to process large memory consumed in converting vector data to Shapefile data. Shapefile format is a de facto standard GIS data format,12 and Shapefile format data are easier to use for health care or other rescue workers. At the first stage of this study, 10 km × 12 km size Shapefile format data were produced (Figure 1).
Process of Data Compilation From Zoom 16 Level Vector Tiles to 10 km × 12 km Shapefile Format Data.

Data Collection Area
Initially, this study intended to provide road centerline data from Chiba Prefecture to Kagoshima Prefecture where direct influences of Nankai Trough mega earthquakes13 are predicted. Collecting and converting road centerline data, which are experimental and may have bugs, demand a large amount of work. The data processing of these prefectures were prioritized. Receiving inquiries of the community of health care workers and GIS community, the data collection areas were expanded to all the 47 prefectures of Japan.
Second Medical Care Area
The initial 10 km × 12 km (6.21 miles × 7.45 miles) size Shapefile data were still too small to display areas of rescue operations. However, the prefectural size map was too large for most of the office use PCs, for example, Aichi Prefecture data were 19 GB.
The Second Medical care area is a medical district designated by the Medical Service Act of Japan (Article 30, 1948, rectified 2017).14 The area is determined by considering local government administrative borders, geographical conditions, daily life activities, transportation network, health conditions of residents, and so forth. Hospital conditions, including number of beds, ambulance cars, and other medical resources, are determined by referring the Second Medical care area information.
Regional medical services, including emergency medical services, are planned according to the Second Medical care area. Disaster base hospitals are located in every Second Medical care areas.15 By collating data of the Second Medical care area, the data are used for disaster preparation planning in relation to the disaster base hospitals.
The Second Medical care area border and area data, provided by Ministry of Land, Infrastructure, Transport and Tourism through National Land Numerical Information Download Service, in 2014,16 were used. For GIS display, QGIS Version 3.4.411 was used. The GIS map size based on the Second Medical care area was an appropriate size to be processed by a PC with a regular memory size.
Use of Road Centerline Data
Road centerline data are useful in improving disaster preparedness. There are 2 merits in introducing road centerline data. First, the road centerline data contain attributes (Table 1) usable in improving disaster preparedness. Second, the data provide accurate transportation distances and other topological data. By using road centerline data combined with the network analysis function of GIS, transportation distance is measured automatically.
Attributes of Map Data
Over 20 kinds of attribute data, such as road width, transit fee, managing organization, utilization purpose, bridge or tunnel, road type, and part of garden, are attached with each road data. Subsidiary maps were produced by grouping these categories, as seen in Table 1. These categories are used to evaluate transportation conditions, and the categories are color coded by the GIS.
GIS road centerline data include information about attributes that were not included in traditional printed maps. Road type is useful for the evacuation of disaster-vulnerable people, such as wheelchair users, elderly people, children, pregnant women, and other people who have difficulty in locomotion. Road condition and width provide useful information for vehicle transportation. Expressways are well maintained and rescue vehicles are given priority to use. However, there will be cases in which a vehicle may be limited to using routes with undesirable road conditions due to damages to the major roads. Hence, the rescue vehicles need information on subsidiary routes. Road centerline data can provide that needed information.
Example of Road Condition
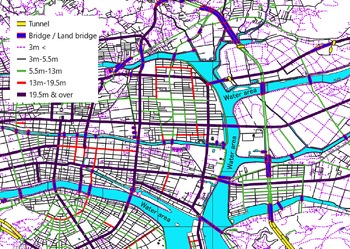
Figure 2 is an example of road centerline data attributes. This is a part of Kochi City, Japan, where a tsunami invasion was predicted after a Nankai Trough mega earthquake.17 The dotted lines represent narrow roads less than 3 m wide. Thick black lines are roads wider than 19.5 m. The city downtown sections are separated by water and connected by bridges. GIS can visualize attributes of roads by color, type, or thickness of line of the user’s choice. (In order to distinguish road width and to increase visibility of the figure, thickness of road centerlines is exaggerated.)
Road Centerlines With Attribute Data.

Example of Distance Measurement
By using road centerline data and network analysis plugin,11 the distance of transportation on the road is calculated. The shortest distance between 2 locations or a set of locations is also calculated. Hence, preparation of the road centerline data is useful to improve disaster preparedness.
Road Centerline Data Combined
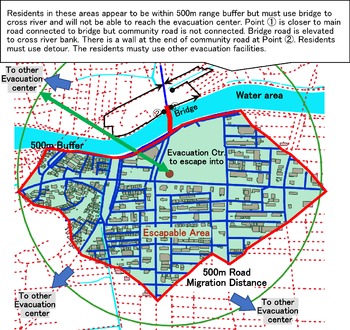
Traditionally, buffering has been used to determine distance. The buffering calculates linear distance from the origination. The buffering provides a sort of index of distance by concentric circle but is not appropriate in determining escapable distance. Evacuees do not transport linearly but escape by way of roads. If there is a river, they have to take a detour by bridge. Unlike the buffering technique, road centerline data combined with network analysis11 can measure road migration length. Although evacuees included in concentric circle are presented as escapable by buffering technique, actually they may not be escapable. Road migration length to evacuation facilities (500 m, 0.31 mi) is better presented by road centerline data (Figure 3). More accurate data are important in the survival situation of evacuees, especially disaster-vulnerable people, such as elderly people, disabled people, children, and pregnant women.
Comparison of Buffering and Network Analysis Combined With Road Centerline Data.

Example of Facility Selection
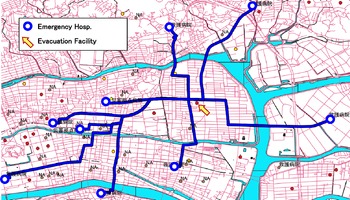
By combining road centerline data and network analysis, logistics information between multiple features can be acquired. Figure 4 shows patient transportation routes between an evacuation facility (arrow) and multiple emergency hospitals.11 In disasters, it is not unusual for a contingency situation to occur. Multiple plans, rather than a single-track plan, should be prepared for a rescue operation. Information for multiple plans can satisfy certain prerequisites. Even if some emergency hospitals cease their functions, surviving hospitals are selected. Road centerline data, hence, can increase the flexibility of disaster preparedness.
Finding Patient Transportation Routes

Open Use of Developed Data
Preparation to post-developed data at the G Spatial Information Center18 after approval by the Geospatial Information Authority of Japan is underway. The center is a mechanism to distribute geospatial information, which is possessed for public use by industries, public organizations, and academic institutions. The developed data are planned to be released by a creative commons license.
DISCUSSION
Authors are engaging in new tasks. One is the decrease of GIS illiteracy, and the other is the use of road centerline data by smartphone.
GIS Illiteracy
The GIS is not yet very popular among health care workers. Road centerline data improve disaster preparation and planning more effectivelyReference Hattori, Miyagawa and Hattori19; however, health care workers who have access to use the technique are not onboard. To help resolve this problem, HattoriReference Hattori20 has developed the GIS training textbook for health care workers. This preliminary version is being reviewed by GIS specialists.
The scale of disaster areas caused by a predicted mega earthquake will be larger than disasters experienced in the past. Countermeasures against the predicted earthquake need to be more effective than those in the past. Through much research on disasters in Japan, numerous factors useful for disaster preparedness were revealed. To make good use of research outcomes, the factors are needed to be processed systematically. The GIS is one of the methods used to improve efficiency of the countermeasures.
CONCLUSION
This study developed a road centerline database by shapefile format covering the whole nation. The original data use vector tile format. The data are technically advanced but are provided by small size. For professionals of disaster medicine area, who are often beginners of GIS, the original data were difficult to approach. The developed shapefile format data are organized by second level medical district which is a common unit of administration of public health and emergency services. GIS accessibility was improved by the developed database. Authors believe disaster preparedness was therefore improved by the database.
Financial Support
This research is partially funded by Grants-in-Aid for Scientific Research (16K00400).
Support of Aero Asahi Corporation (AAC) is sincerely appreciated. The AAC provided technical advice on data collection and dissemination.
Conflict of Interest Statement
The authors have no conflicts of interest to declare.