Introduction
Intensive care units (ICUs) care for the most critically ill patients who require constant monitoring and nursing care. However, despite advances in technology, these environments have become increasingly noisy and contribute to the development of delirium and sleep disturbances. Despite recommendations from the World Health Organization (WHO; Geneva, Switzerland) that set noise levels to 30 decibels (dB), with nighttime peaks of no more than 40 dB in the health care environment, prior studies have shown noise levels in the hospital environment often exceed these guidelines.Reference Ryan, Gagnon, Hanna, Mello, Fofana, Ciottone and Molloy 1 - Reference Darbyshire and Young 4
In healthy patients, increasing noise levels lead to arousals that disrupt sleep and circadian rhythms. This fragmentation of sleep resembles that of patients suffering from obstructive sleep apnea.Reference Aaron, Carlisle, Carskadon, Meyer, Hill and Millman 5 Early work reviewing the effect of noise in hospitals found an increase in length of stay for patients.Reference Parthasarathy and Tobin 6 Staff conversations can also negatively impact physiologic parameters of patients, such as their heart rate. In addition to affecting heart rate, staff conversations are also a source of frustration to patients resulting in the increased use of pain medication. 2 , Reference Fife and Rappaport 7
Understanding that noise can impact delirium, and that delirium leads to increased length of stays and health care costs,Reference Baker, Garvin, Kennedy and Polivka 8 , Reference Ely, Gautam and Margolin 9 noise levels were monitored in the coronary care unit (CCU) of the West Roxbury Veterans’ Administration (VA) Hospital (Roxbury, Massachusetts USA), 24 hours a day for one month, and alarm monitor data were reviewed to determine sound levels, trends of noise levels, and sources of alarm data present during the same period.
Methods
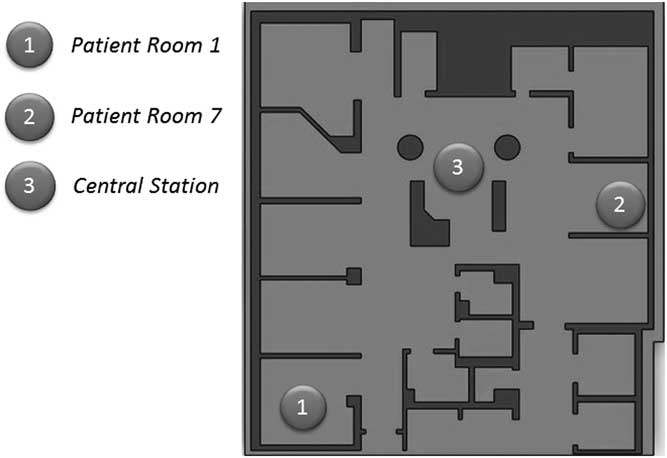
This study was based at the West Roxbury Campus of the VA Boston Healthcare System (Massachusetts USA), a tertiary care inpatient medical center for the region that is Joint Commission accredited. The facility includes an emergency department, medical ICU, CCU, surgical ICU, and approximately 448 authorized beds. The CCU, constructed in 2000, includes eight individual patient rooms with curtains at the room entrance and is laid out as shown in Figure 1. The unit has an average daily census of approximately 5.5 patients, though during the study period, a daily census was not recorded.
Layout of CCU, Including Locations of the Three Sensors. Abbreviation: CCU, coronary care unit.

To determine ambient sound levels in the CCU, the Extech Sound Logger SDL-600 Sound Level Meters (Extech Instruments; Nashua, New Hampshire USA) were utilized in three locations over a one-month period. All areas were free of acoustical treatments and staff were instructed to continue with their normal routines. The three devices were placed in the CCU to determine sound levels simultaneously. The first sensor location was in Patient Room 1 next to the entrance to the CCU. Location 2 was located at the central nurses’ station, and location 3 was in Patient Room 7, across from the central nurses’ station. The devices were placed in thermostat protector boxes to comply with regulations regarding disinfection between patients. The devices were placed approximately seven feet above the floor to avoid disrupting the device during daily activities, or from manipulation, though placed as close to the patient’s bed as possible to accurately record noise experienced by the patient.
The device settings were programmed to record in “A” frequency, resembling that of the human ear and commonly used for environmental/conversation type noises. Each devices recording times (for analysis) were set to that of the alarms utilized by the PHILIPS Alarm Software (Philips Healthcare; Amsterdam, The Netherlands). In terms of response times, “fast” was selected in place of “slow,” as fast applies to situations tracking noise peaks and quickly occurring noises.
Each device had a sampling rate of one second and would store recordings as dB in Excel format via an SD card. Per the manufacturer, the accuracy of the loggers was +/− 1.4 dB. Every 30,000 samples recorded resulted in the creation of a new document.
For the data analysis, Microsoft Excel (Microsoft Corporation; Redmond, Washington USA) was used. To obtain averages, the “AVERAGEIF” function was employed, as each time stamp was unique due to using 24-hour military time. The hour range used was midnight to midnight to show all hourly data points for 24 hours. To determine the time spent above a certain dB, the “COUNTIFS” function provided time spent above a certain level. The number of points between 7:00 pm and 7:00 am that occurred over 45 dB were counted and divided by total number of points to arrive at a percentage.
In addition to measuring ambient noise levels, the Biomedical Engineering Department of the VA Hospital purchased the alarm-tracking software PHILIPS Alarm Software IntelliVue Information Center (Philips Healthcare; Amsterdam, The Netherlands) to record this information. The software recorded type of alarm, time and date, patient bed, and priority of alarm, which all were then exported to Microsoft Excel. Blue alarms were not recorded, and included events such as lead off and oxygen saturation probe not connected. Alarm specific data to Patient Room 1, Patient Room 7, and the central nurses’ station (which included alarms for all patient rooms) were used for analysis of percentages and total occurrences. Medium priority alarms sound in the patient’s room who triggered the alarm and the central nurses’ station, and include events such as low respiratory rate or high respiratory rate, while high priority alarms sound in all rooms and the central nurses’ station, and include events such as asystole or apnea.
Approval for this study was obtained from the Institutional Review Board of Worcester Polytechnic Institute (Worcester, Massachusetts USA).
Results
Data were collected from February 20th through March 25th, though between March 5th and March 14th, a power outage reset the sensors and corrupted the dataset rending this period of data ineligible. Average sound levels for each location were determined and plotted on a graph.
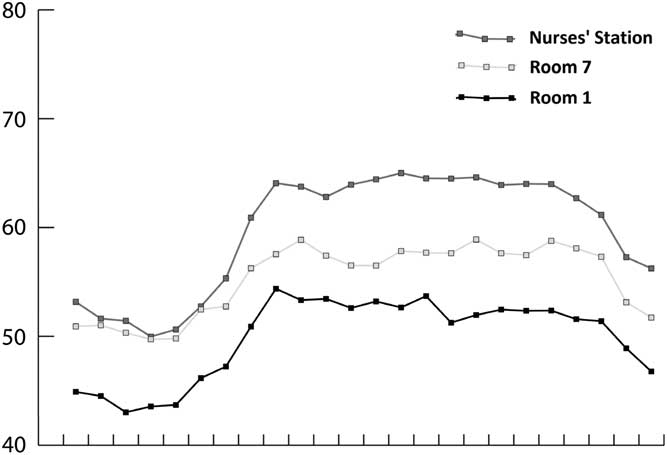
The hourly averages at the central nurses’ station had an average low recording of 49.98 dB at 4:00 am and a maximum average of 65.00 dB at 2:00 pm. The peak average for Patient Room 1 next to the entrance was 54.38 dB at 9:00 am with a low average of 43.03 dB at 3:00 am. Located next to the central nurses’ station was Patient Room 7 which was, on average, louder than Patient Room 1. The peak average was 58.90 dB at 5:00 pm and a low of 49.73 dB at 4:00 am. Figure 2 illustrates the hourly sound averages for each of the three locations. Patient Room 1 spent 55.25% (95% CI, 55.11-55.39%) above the 45 dB overlay for the night hours while Patient Room 7 spent 99.61% (95% CI, 99.59-99.63%) of the night hours over 45 dB.
Average Sound Level for All Three Locations. (Note: X-axis = Time in Hours; Y-axis = Sound Level in Decibels)

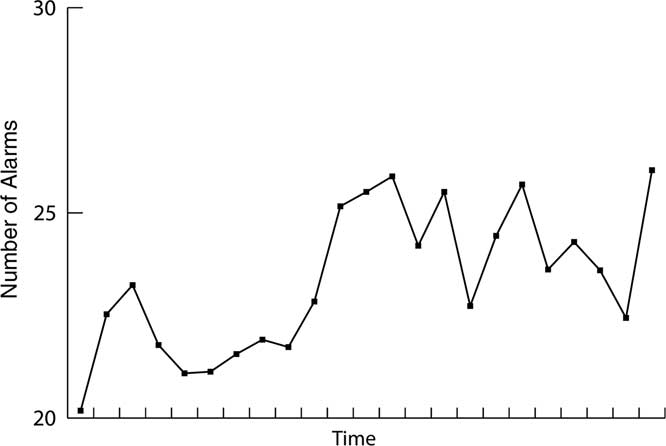
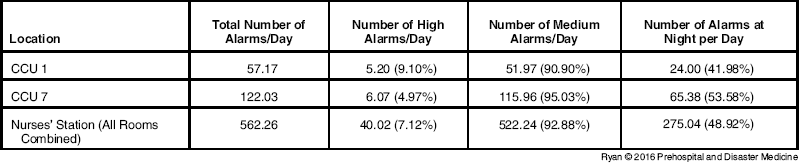
The Philips IntelliVue software allowed extraction of alarms specific to Patient Room 1 and Patient Room 7 for analysis. The central nurses’ station experienced, on average, 522.24 medium alarms per day and 40.02 high priority alarms per day. Figure 3 depicts the total number of alarms for all locations over a 24-hour period.
Number of Alarms per Hour per Day for All Locations.

Table 1 shows the number of high and medium alarms triggered at each location as well as the total number of alarms per day. Despite decrease in sound levels at night, no appreciable difference occurs at night.
Number of Alarms per Location per Day, at Night, and per Acuity

Abbreviation: CCU, coronary care unit.
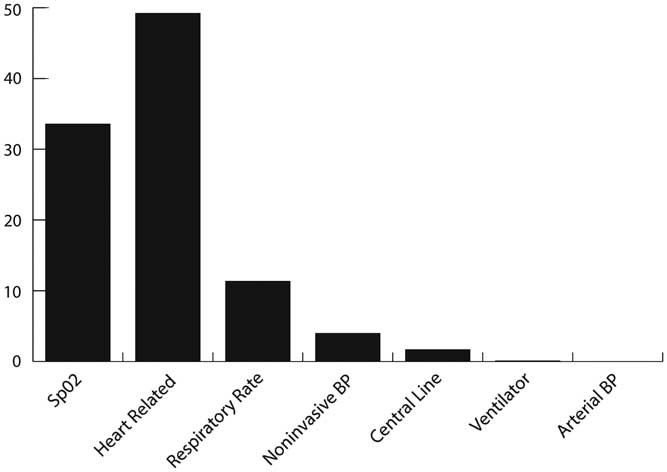
The software also enabled review of the types of alarms triggered in the CCU. The oxygen saturation probe accounted for a large proportion of the alarms at approximately 33.59%. Heart-related alarms included triggers such as: QT alarms, ST segment alarms, pacemaker-related alarms, and rate, and these accounted for 49.24% of the total alarms. As seen in Figure 4, the remaining alarms accounted for a substantially smaller percentage, such as the ventilator, non-invasive blood pressure, central line alarms (central venous pressure and pulmonary artery pressure), and respiratory rate.
Characterization of Alarms Triggered in the CCU. (Note: Y-axis = Percentage of Total Alarms) Abbreviations: BP, blood pressure; CCU, coronary care unit; SpO2, saturation of oxygen.

Discussion
Noise levels are often measured and reported using dB. The lowest level normal hearing can detect is approximately 0 dB. Meanwhile, 30 dB is equivalent to a soft whisper, 40 dB a quiet office or library, and 85 dB heavy traffic or a noisy restaurant.Reference Milbrandt, Deppen and Harrison 10 To enable healing, the WHO recommends that noise levels in hospitals not exceed 35 dB with max peaks during the day/night of no more than 40 dB.Reference Ryan, Gagnon, Hanna, Mello, Fofana, Ciottone and Molloy 1 This study found that of the three locations in the CCU, no location recorded levels below 40 dB, on average.
Though there were slight differences between the locations and average sound levels, each location followed the same general trend of sound levels. The early morning hours experienced the quietest time, and just prior to shift change, sound levels began to increase. The central nurses’ station, where the majority of activity, phone calls, and patient rounds occur, remained the loudest location at all times, with peak levels in midafternoon. For patients requiring rest, the noise levels did not begin to decrease until after 10:00 pm, nearly 16 hours after experiencing the quiet of the early morning hours. Patient Room 1, despite being next to the entrance and a high foot traffic area, remained the quietest location averaging 5-10 dB lower than Patient Room 7, which was across from the central nurses’ station.
Despite improvements in sound levels in this particular CCU compared to another ICU, which saw peaks above 85 dB almost 16 times per hour overnight, patients are still experiencing noisy healing environments.Reference Hansell 3 With increasing sound levels, patients’ sleep becomes fragmented and the number of arousals increases, along with decreasing rapid eye movement/REM sleep, as patients are subjected to increasing noise.Reference Darbyshire and Young 4 , Reference Aaron, Carlisle, Carskadon, Meyer, Hill and Millman 5 , 11 In a prior study examining healthy subjects, electronic sounds were found to be more arousing from sleep than human voices; however, staff conversations and overhead voice paging were still disruptive to rest.Reference Topf and Davis 12
Though sound levels are disruptive to the healing environment, examining what the patients find most disruptive can offer clues to improving the hospital environment. Patients experience noise from monitors, intravenous pumps, staff, and cleaning equipment; however, when asked for the most disturbing noise, patients report not their cardiac monitor alarm, but staff conversations. 2 When identifying activity that increases noise in the ward, talking was identified as the highest frequency and longest duration event, with turning and repositioning of the patients resulting in increasing occurrences of noise.Reference Buxton, Ellenbogen and Wang 13
Increasing noise levels are not only a disturbance to patients but contribute to the development of delirium as sleep becomes fragmented and circadian rhythm becomes distorted. A prior small study found that with increasing noise came a relationship of increasing length of stay.Reference Parthasarathy and Tobin 6 Additional studies have more closely examined the relationship of delirium and effects on health as well as identifying those at risk for the development of delirium.Reference Xie, Kang and Mills 14 Ely found that in the ICU, the majority of patients develop delirium with delirium being the strongest independent determinant of length of stay.Reference Baker, Garvin, Kennedy and Polivka 8 With increasing length of stay, hospital and health care costs begin to rise.Reference Ely, Gautam and Margolin 9
Increasing noise levels not only affect the patients in the CCU but also the nurses, many of whom work 12 hours a day in the same noisy environments patients are healing in. One study observed pediatric ICU nurses and found that with increasing noise, nurses’ heart rate and annoyance rating also increased.Reference Van den Boogaard, Pickkers and Slooter 15 As the nurses experienced increased noise-induced occupational stress, it adversely affected the development of burnout.Reference Morrison, Hass, Shaffner, Garrett and Fackler 16 Alarm recordings in this CCU found that nurses experienced on average 562 alarms/day, or approximately one alarm every three minutes, with no relief at night as, on average, 275 alarms were triggered. Though measures such as earplugs can help alleviate some of the stress patients experience,Reference Topf and Dillon 17 nurses are not able to utilize such measures to protect against stress and burnout.
Limitations
The primary limitation of this study relates to the single hospital/single CCU environment in which sound levels were recorded. Despite numerous recordings, the findings of this study may lack external validity for other institutions. The study also only examined sound levels, without recording clinical activity ongoing at the bedside, which may result in the increased noise levels. In addition, the study did not examine length of stay for each patient location or outcomes for the patients. The alarm recordings, though robust, did not include blue alarms, which include oxygen saturation probe off and lead off of patient, and can contribute to noise levels. During this study period, a power outage also interrupted data collection and corrupted the software, resulting in two weeks of lost data points during the one-month period.
Conclusion
The CCU cares for ill patients requiring constant monitoring. Despite advances in technology, measured noise levels at the hospital studied exceeded WHO recommendations of 35 dB with peaks of no more than 40 dB, even during night hours when patients require rest. Further work is required to determine the best interventions to reduce noise levels and examine the subsequent effects on patient satisfaction, clinical outcomes, and length of stay.
Acknowledgments
This research project was supported in part by funding from the West Roxbury VA Hospital and the MIRAD Laboratory. The authors would also like to thank William Pinette, BSc and Elena Simoncini, MSc for their assistance with the project.