Introduction
Beta thalassaemia major is a genetic haemoglobinopathy resulting from a defect in the beta-globin chain in the haemoglobin structure.Reference Fosburg and Nathan1 Since patients with beta thalassaemia major are regularly transfused, transfusion-related iron overload occurs. Iron accumulates in the cardiovascular system and is one of the most important causes of mortality.Reference Wood2
Electrical abnormalities may occur as a result of direct accumulation of iron in the myocardium or damage due to oxidative stress caused by iron.Reference Lekawanvijit and Chattipakorn3,Reference Shizukuda and Rosing4
In clinical practice, electrocardiography parameters based on repolarisation times are used to evaluate ventricular arrhythmias. The index of cardiac electrophysiological balance is a parameter based on the ratio of repolarisation time to depolarisation time and is mathematically equal to the cardiac wavefront (λ). An increase or decrease in the cardiac electrophysiological index of balance poses a risk for ventricular tachyarrhythmias.Reference Lu, Yan and Gallacher5,Reference Robyns, Lu and Gallacher6
This study aimed to evaluate the risk of ventricular arrhythmia using the cardiac electrophysiological index of balance parameter in patients with beta thalassaemia major and to evaluate the usability of cardiac electrophysiological index of balance in patients with beta thalassaemia major in the early period.
Materials and methods
The study included 60 patients with beta thalassaemia major, who were diagnosed with laboratory and genetic tests from the Pediatric Hematology Department, and 60 healthy children, whose ages were similar to those of the beta thalassaemia major group, who applied to the Pediatric Cardiology Department; no cardiac pathology was detected as a result of the evaluations.
This was a prospective, case-control study. The ethics committee for our study was obtained from the local ethics committee (Gazi Yaşargil Training and Research Hospital, Ethics Committee, decision no: 505/2023), and written consent was obtained from all patients in accordance with the Declaration of Helsinki.
Beta thalassaemia major patients received blood transfusions every 2–3 weeks, followed by a paediatric haematologist. The evaluation was made one week after the transfusion, and the blood ferritin and haemoglobin levels were calculated by taking the average of the last year’s values.
Patient age was expressed in decimal years, body weight in kilograms, height in centimetres, and body surface area in square metres.Reference Du Bois and Du Bois7 Systolic and diastolic blood pressures were measured after the patients had rested for 10 min.
All patients were evaluated by the same paediatric cardiologist. All patients underwent transthoracic echocardiographic evaluation while lying on their left side (Vivid S60; General Electric Healthcare, GE, Vingmed, Norway). Using apical four-, two-, and three-chamber, parasternal long- and short-axis images with a 1.5–4 MHz transducer, 2D mode, colour Doppler, M-mode, and tissue Doppler echocardiography images were obtained.Reference Lopez, Colan and Frommelt8
TAPSE (tricuspid annular plane systolic excursion) by tricuspid lateral annulus M-mode measurement in the apical four-chamber position, left ventricular mass (LVmass) derived from the data obtained from left ventricle M-mode measurement, left ventricle mass index (LV-mass-index) left ventricle LVmass-i was calculated by dividing the mass (LVmass) by body surface area.Reference Lopez, Colan and Frommelt8
By placing the PW Doppler cursor on the mitral valve tip in the apical four-chamber position, E velocity, A velocity, and E/A ratio were calculated.Reference Lopez, Colan and Frommelt8
Tissue Doppler evaluation was performed using PW Doppler from the mitral lateral annulus and tricuspid lateral annulus in the left ventricular apical four-chamber position. Early diastolic velocity (e), late diastolic velocity (a), and systolic velocity (s) were obtained.Reference Lopez, Colan and Frommelt8
All patients underwent 12-lead electrocardiography (Econet Cardio M Plus, Germany; filtered 0.5–150 Hz, 25 mm/s, 10 mm/mV). The five consecutive electrocardiography waves or intervals in leads DII and V5 were enlarged 100 times on a computer, and the calculations were performed manually.
The difference between the maximum P-wave duration (Pmax) and the minimum P-wave duration (Pmin) measured in the 12-lead electrocardiography was defined as the P-wave dispersion.Reference Dilaveris and Gialafos9
The QRS duration and the difference between the maximum QRS duration (QRSmax) and the minimum QRS duration (QRS min) were calculated as QRS dispersion (QRS-d).Reference Chávez-González, Rodríguez Jiménez and Moreno-Martínez10
QT, JT, JTp, QTc, JTc, JTpc for evaluation of repolarization times and QT-d, QTc-d, JT-d, JTc-d, JTp-d and JTpc-d for evaluation of repolarization dispersion.Reference Bednar, Harrigan, Anziano, Camm and Ruskin11–Reference Russo, Rago and Pannone15 To evaluate the transmural repolarization distribution (TDR), Tpe, Tpe/QT ratio, and Tpe/QTc ratio were calculated, whereas the QT/QRS ratio and QTc/QRS ratio were calculated to evaluate the cardiac electrophysiological balance index (iCEB).Reference Lu, Yan and Gallacher5,Reference Robyns, Lu and Gallacher6,Reference Kors, Ritsema van Eck and van Herpen16,Reference Gupta, Patel and Patel17 QTc, JTc, and JTpc times were corrected according to the heart rate using the Bazett formula (corrected time: measured time/√ RR).Reference Indik, Pearson, Fried and Woosley14 Interval dispersions were calculated as the difference between the maximum and minimum periods after five consecutive waves were measured.Reference Russo, Rago and Pannone15
Time-interval SDNN, SDNN-index, SDNN, SDANN, rMSSD, mean heart rate, and frequency-based LF/HF ratio parameters were obtained from 24-hour Holter electrocardiography data (Del Mar Reynolds Lifecard CF; Impresario software).Reference Bernardi, Valle, Coco, Calciati and Sleight18
The electrocardiography measurements were performed blindly by two paediatric cardiologists using computer magnification and a ruler. The inter-observer variability was <5%. Measurements were not made in leads that had artefacts in the electrocardiography and whose beginning and ending were not clearly marked.
Analyses were performed using the IBM SPSS (SPSS, Chicago) analysis programme. The Kolmogorov–Smirnov test was used to evaluate the normal distribution. Continuous variables are expressed as mean±standard deviation or median (minimum-maximum), depending on whether they showed normal distribution, and categorical variables are expressed as percentages. The chi-square test was used to compare categorical variables, and the Student t-test or Mann–Whitney U test was used to compare continuous variables, depending on whether the parameters were normally distributed. In the correlation analysis, the Pearson correlation test and Spearman’s correlation test were used depending on whether the parameter distribution was normal. Statistical significance was set at p < 0.05.
Results
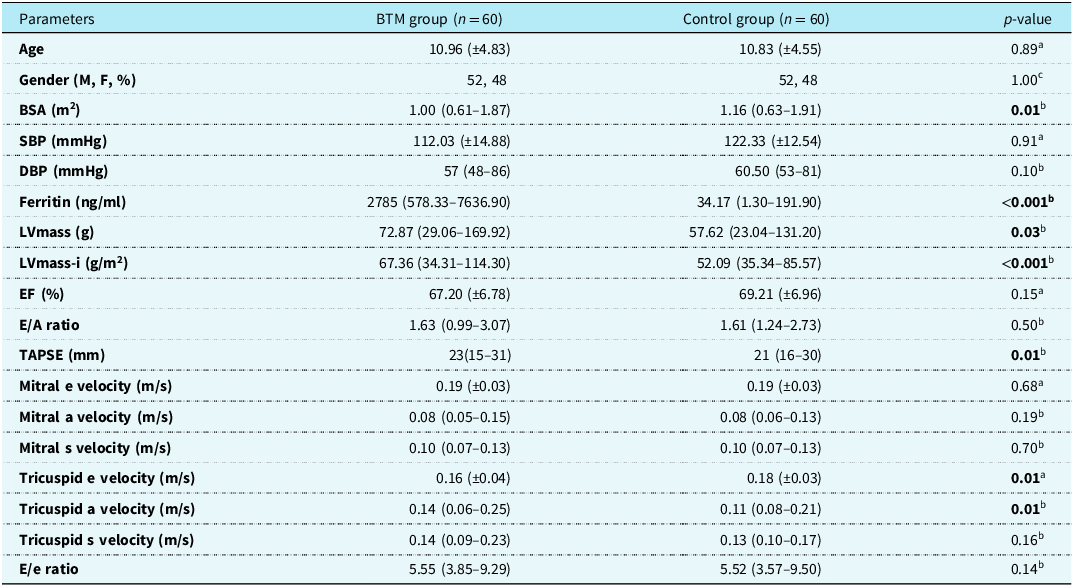
The mean ages in the beta thalassaemia major and control groups were 10.96 (±4.83) and 10.83 (±4.55) years, respectively. A total of 52% of the patients in the beta thalassaemia major and control groups were male.
Body surface area was significantly lower in the beta thalassaemia major group than in the control group (p = 0.01).
Systolic blood pressure and diastolic blood pressure values were similar between groups.
The annual median blood ferritin levels in the beta thalassaemia major and control groups were 2785 (578.33–7636.90) and 34.17 (1.30–191.90) ng/ml, respectively.
Left ventricular mass (LVmass) and left ventricular mass index (LVmass-i) were significantly higher in the beta thalassaemia major group than in the control group (p values 0.03 and <0.001, respectively).
The left ventricular ejection fraction and left ventricular mitral E/A velocity ratio were similar in both groups.
The TAPSE value was significantly higher in the beta thalassaemia major group than in the control group (P = 0.01).
On tissue Doppler echocardiography examination, the mitral lateral wall systolic and diastolic tissue velocities were similar. Although the tricuspid lateral e’ velocity was significantly lower, a’ velocity was significantly higher (p = 0.01, 0.01 respectively).
The E/e ratios were similar between the groups (Table 1).
Comparison of demographic data, annual average blood ferritin levels, and echocardiography data between the beta thalassaemia major (BTM) and control groups

a Student t-test.
bMann–Whitney U test.
cChi-square test.
BSA = body surface area; SBP = systolic blood pressure; DBP = diastolic blood pressure; EF = ejection fraction; FS = fractional shortening; LVmass = left ventricle mass; LVmass-i = left ventricle mass index; E = mitral early diastolic velocity; A = mitral late diastolic velocity; TAPSE = tricuspid anular plane systolic excursion; e = early diastolic tissue velocity; a = late diastolic tissue velocity; s = systolic tissue velocity.
Bold values represents Statistically significant parameters.
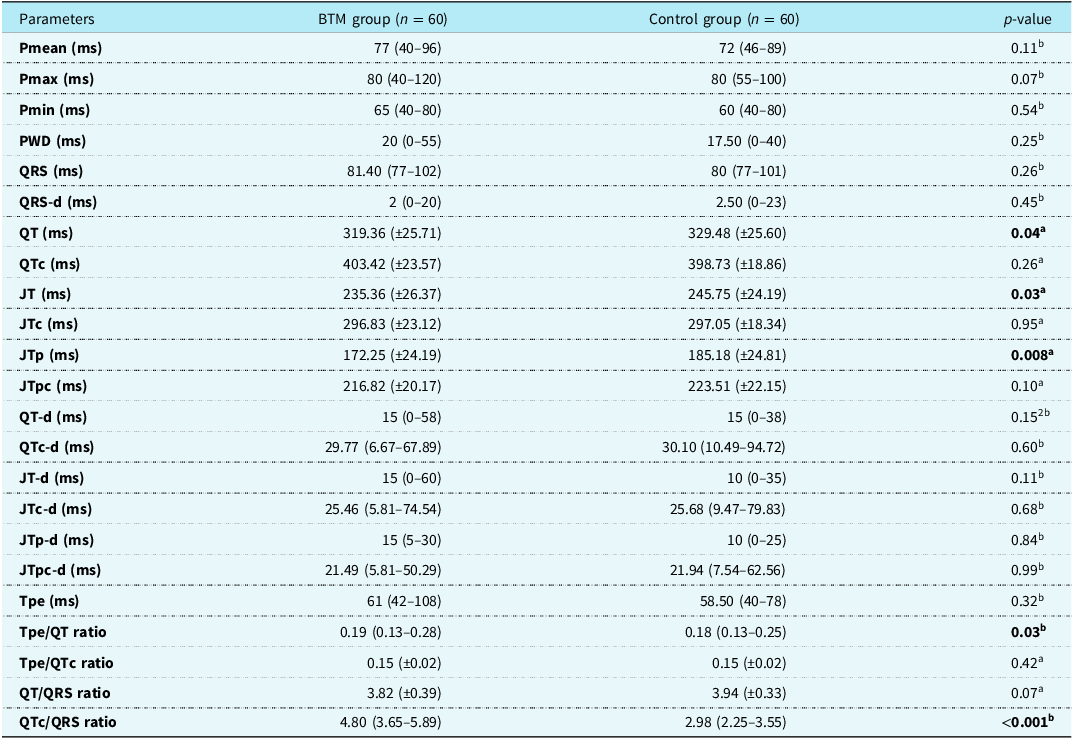
Among the electrocardiography parameters, P-wave durations (Pmean, Pmaximum, Pminimum, P-wave dispersion) were similar in the groups.
The QRS duration and dispersion duration (QRS-d) were similar.
Although QT, JT, and JTp values were significantly lower in the beta thalassaemia major group than in the control group (p = 0.04, 0.03, and 0.008, respectively), QTc, JTc, and JTpc values corrected for heart rate were similar.
Among the total repolarisation dispersion parameters, QT-d, JT-d, JTp-d, QTc-d, JTc-d, and JTpc-d were similar between groups.
Although the Tpe and Tpe/QTc ratios, which are among the transmural repolarisation dispersion parameters, were similar in the groups, the Tpe/QT ratio was significantly higher in the beta thalassaemia major group (p = 0.03).
Although the QT/QRS ratio was similar between the groups, the QTc/QRS ratio was significantly higher in the beta thalassaemia major group (Table 2) (p < 0.001).
Comparison table of electrocardiography parameters in the beta thalassaemia major (BTM) and control groups

aStudent t-test.
bMann–Whitney test. PWD= P-wave dispersion.
Bold values represents Statistically significant parameters.
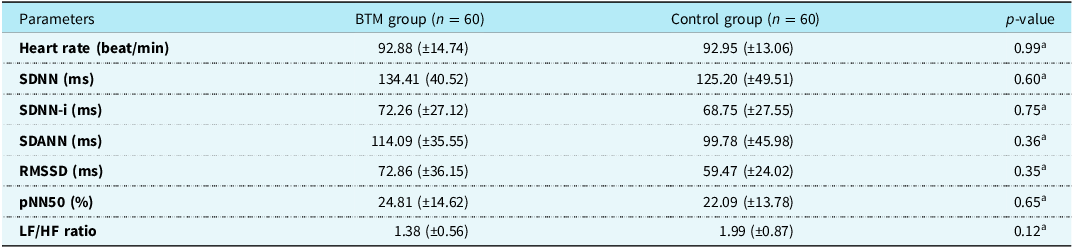
Among the heart rate variability parameters, mean heart rate, SDNN, SDNN-i, SDANN, RMSSD, pNN50, and LF/HF ratio values were similar between the groups (Table 3).
Comparison of heart rate variability parameters of the beta thalassaemia major (BTM) and control groups

aStudent t-test.
SDNN = the standard deviation of all normal R–R intervals in the 24-h electrocardiogram (ECG) recording; SDNN-index = the mean of the standard deviation of all R–R intervals for all 5-min segments of the 24-h ECG recording; SDANN = the standard deviation of the mean of R–R intervals in all 5-min segments of the 24-h ECG recording; rMSSD = the square root of the mean of the sum of the squares of differences between adjacent RR intervals; pNN50 = the proportion of adjacent R–R intervals that differ by more than 50 ms in the 24-h recording; LF = low frequency (0.04–0.15 Hz); HF = high frequency (0.15–0.40 Hz).
None of our patients had a ventricular bundle branch block pattern or a fractional QRS pattern on their 12-lead electrocardiogram. No ventricular extrasystole was observed on the 24-hour Holter electrocardiography in any of our patients.
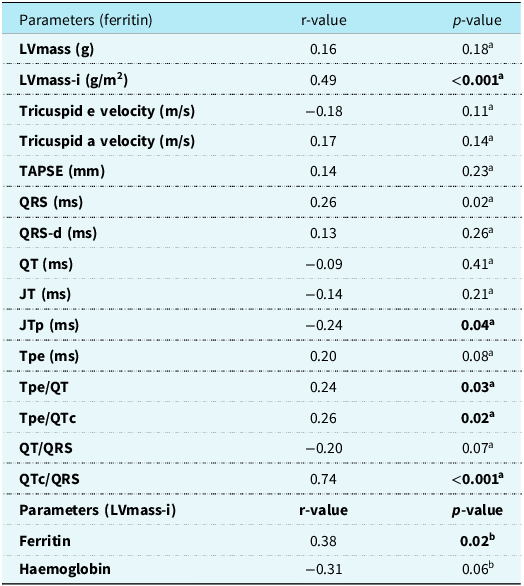
There was a moderate positive correlation between blood ferritin levels and LVmass-i and QTc/QRS ratio and a slight negative correlation with JTp duration. There was a positive correlation between LVmass-i and blood ferritin levels (Table 4).
Table of correlations between ferritin and left ventricular mass index (LVmass-i) and various parameters

aSpearman’s test.
bPearson test. LV = left ventricle; TAPSE = tricuspid anular plane systolic excursion.
Bold values represents Statistically significant parameters.
Discussion
Cardiac action potential: This consists of the depolarisation, repolarisation, and restoration phases. While the main ion in cardiomyocytes is sodium, depolarisation occurs with calcium in nodal cells. During repolarisation, potassium ions leave the cell.Reference Bernstein and Morley19 Transient outward channels, fast and slow potassium channels (IKR and IKS, respectively), and IKATP and IK1 channels provide the exit of potassium ions from the cell. These channels participate in different phases of repolarisation.Reference Grant20
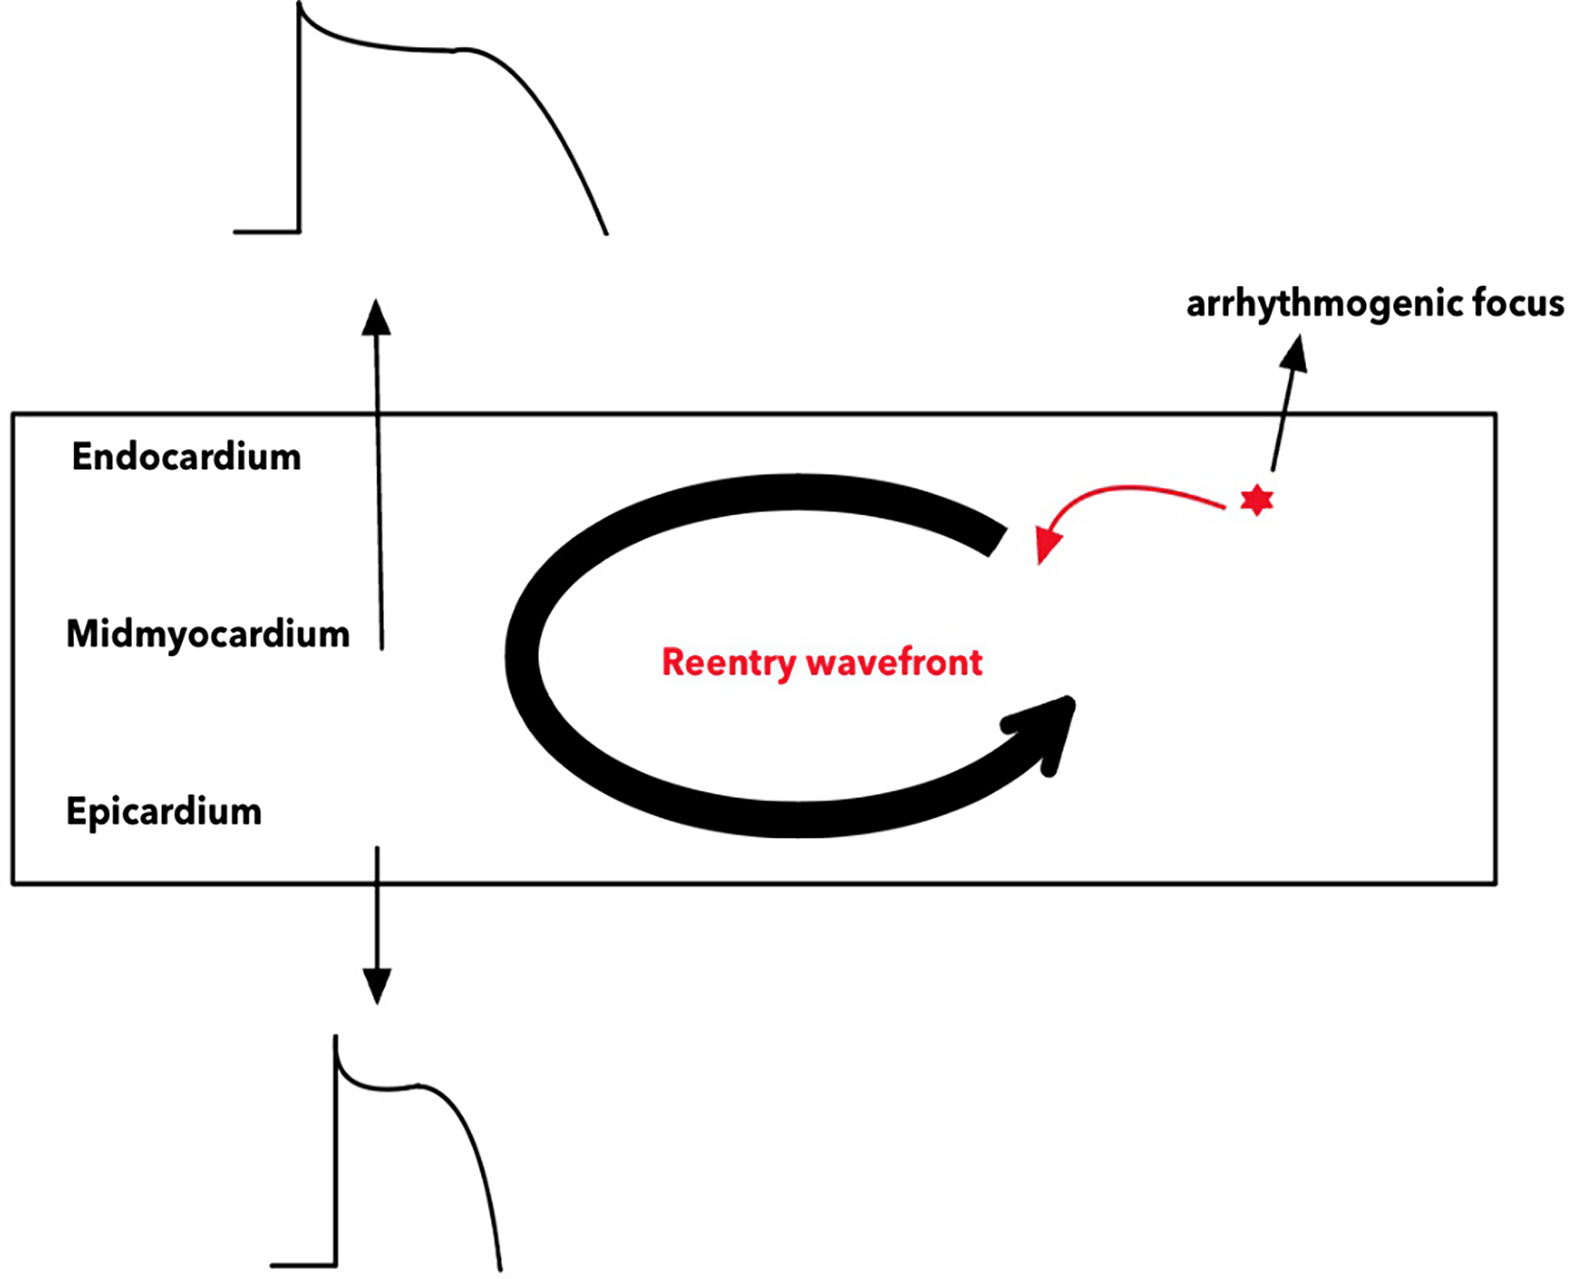
The ventricular myocardium consists of endocardium, mid-myocardium (M-cell), and epicardium layers. The electrophysiological properties of these layers differ from each other. The action potential duration of the epicardial layer is the shortest, and the M-cell action potential duration is the longest (Figure 1).Reference Yan, Lankipalli, Burke, Musco and Kowey21,Reference Liu, Gintant and Antzelevitch22 In electrocardiography, the JT interval is the time from the beginning of the J wave to the end of the T wave and is the total repolarisation time. The QT interval: The time from the beginning of the QRS to the end of the T wave and the sum of the depolarisation and repolarisation times. The time from the beginning of the J wave to the peak of the T wave (JTp) is equal to the action potential duration of the epicardial layer.Reference Takeuchi, Omeki and Horio23 Electrophysiologically, a predisposing situation for arrhythmias occurs when electrical heterogeneity increases in the myocardial layers.Reference Poelzing and Rosenbaum24 In electrocardiography, electrical heterogeneity can be measured as repolarisation dispersion. Repolarisation dispersion: Total repolarisation dispersion can be measured as transmural repolarisation dispersion. The total repolarisation dispersion can be measured as QT-dispersion, JT-dispersion, and transmural repolarisation dispersion, which can be measured as Tpe, Tpe/QT, and Tpe/QTc ratios.Reference Gupta, Patel and Patel17
Arrhythmia mechanism that may occur in the myocardial layers; extrasystole that may occur in the arrhythmogenic focus may trap the tissues as refractory and cause re-entry.

The cardiac wavefront (λ) is equal to the product of the tissue conduction velocity and tissue refractory period time. It can be measured in a non-invasive manner.Reference Robyns, Lu and Gallacher6 The cardiac electrophysiological balance index is a non-invasive method that can be used instead of the λ value. It has been reported to be similar to invasive measurements.Reference Robyns, Lu and Gallacher6 The cardiac electrophysiological index of balance must be between certain values. An increase or decrease in the cardiac electrophysiological index of balance value creates a risk of ventricular tachyarrhythmias.Reference Lu, Yan and Gallacher5,Reference Robyns, Lu and Gallacher6
The most important cause of mortality in patients with beta thalassaemia major and the situation that may cause sudden death is the iron accumulation burden due to transfusion.Reference Modell, Khan and Darlison25 Undoubtedly, histopathological evaluation of samples taken by interventional biopsy is the gold standard.Reference Wood-Trageser, Lesniak and Demetris26 However, the fact that a biopsy is invasive brings the use of non-invasive methods to the agenda in terms of possible complications.Reference Baraldi-Junkins, Levin, Kasper, Rayburn, Herskowitz and Baughman27 Therefore, cardiac involvement can be detected at an early stage using non-invasive methods such as echocardiography and electrocardiography.
Cardiovascular system damage mechanisms in patients with beta thalassaemia major include myocardial iron accumulation, damage caused by free oxygen radicals as a result of oxidative stress caused by iron, myocardial damage due to anaemia, and dysfunction in myocardial ion channels due to autonomic dysfunction.Reference Lekawanvijit and Chattipakorn3,Reference Schwartz, Li, Schwartz, Cooper and Braselton28–Reference Kardelen, Tezcan, Akcurin, Ertug and Yesilipek30
In our study, the significantly higher LVmass and LVmass-i in patients with beta thalassaemia major may be related to iron accumulation in the myocardium. In our study, analyses were conducted using the average blood ferritin and haemoglobin levels of patients with BTM over the past year. The lack of correlation between LVmass-i and blood haemoglobin levels and the positive correlation between LVmass-i and ferritin levels support the association between left ventricular mass and transfusion.
In our study, the left ventricular systolic and diastolic functions were normal in patients with beta thalassaemia major. Right ventricular subclinical diastolic dysfunction was observed in patients with beta thalassaemia major. The first compensatory response in right ventricular dysfunction is increased contractility and early diastolic velocity.Reference Monitillo, Di Terlizzi and Gioia31 The significantly higher TAPSE value in the beta thalassaemia major group supports the increased contractility. The lack of correlation between blood ferritin levels and right ventricular tissue Doppler velocities in our study may have developed secondary to impaired lung function in right ventricular subclinical diastolic dysfunction.Reference Abu-Ekteish, Al-Rimawi, Al-Ali and Shehabi32,Reference Piatti, Allegra, Fasano, Gambardella, Bisaccia and Cappellini33 The fact that respiratory function testing was not performed in patients with beta thalassaemia major in our study is a limitation. More work needs to be conducted on this subject.
In beta thalassaemia major patients, both oxidative stress caused by iron and oxidative stress caused by cardiomyopathy disrupt mitochondrial function in cardiomyocytes. As a result, rapid sodium conduction (INa) decreases, late sodium conduction (INa-late) and calcium conduction (ICa) increase, Na-Ca exchanger channel conduction increases, IKATP inhibition, and ITO channel conduction increases.Reference Shizukuda and Rosing4,Reference Russo, Melillo, Papa, Rago, Chamberland and Nigro34 As a result of the decrease in fast sodium channels, the depolarisation peak and depolarisation duration decrease, while the action potential shortens owing to the increase in conduction in ITO channels.Reference Shizukuda and Rosing4,Reference Russo, Melillo, Papa, Rago, Chamberland and Nigro34 Additionally, triggered depolarisation may occur as a result of an increase in late sodium, calcium, and sodium–calcium exchange channels.Reference Shizukuda and Rosing4 The impulse that may occur as a result has the potential to capture non-refractory tissues and cause reentrant arrhythmia (Figure 1).
Studies evaluating the risk of arrhythmia in patients with beta thalassaemia major are often related to repolarisation time and repolarisation dispersion times. It has been reported that the repolarisation times and repolarisation dispersion times are high in patients with beta thalassaemia major.Reference Russo, Rago and Pannone15,Reference Dharmawan, Ugrasena, Cahyadi and Utamayasa35–Reference Kayrak, Acar and Gul39 In our study, while repolarisation times were significantly lower in patients with beta thalassaemia major, the heart rate-corrected repolarisation times were similar. In our study, patients with beta thalassaemia major were receiving regular chelation therapy, and echocardiographic evaluation was performed approximately one week after transfusion. Transfusion-related myocardial accumulation occurs interstitially in the early stages and intracellularly in the later stages.Reference Anderson, Holden and Davis40 The shorter repolarisation times in our study may be due to early interstitial accumulation affecting the myocardial repolarisation time but may also be related to the evaluation time. Further detailed studies on this topic are required.
In our study, except for the Tpe/QT ratio, the other repolarisation dispersion parameters were similar. A significantly high Tpe/QT ratio may be associated with a short QT interval. We believe that the reason for the short QT duration is the short action potential duration of the epicardial layer (JTp). This may be related to the increase in the function of ITO channels, which provide outward potassium conduction in the epicardial layer. In the literature, a case presenting with heart failure due to the Brugada phenotype caused by post-transfusion iron load has been presented.Reference Sun, Liu and Liu41 Chelation therapy is used in addition to blood transfusion for the chronic treatment of patients with beta thalassaemia major. Studies have shown that iron accumulation due to transfusion occurs in the epicardial layer during the early period in patients with beta thalassaemia major.Reference Carpenter, He and Kirk42 In the myocardium, blood flow and oxygenation in the epicardial layer are high.Reference Weintraub, Hattori, Agarwal, Bodenheimer, Banka and Helfant43 Accumulation in the epicardial layer may be related to increased oxidative reactions due to the high blood flow and oxygenation of the epicardial layer. We believe that the shortening of the repolarisation time in the epicardial layer is due to ion channel function resulting from oxidative stress caused by iron. In this sense, we believe that the addition of antioxidant therapy in addition to blood transfusion and chelation therapy in the early treatment of patients with beta thalassaemia major may reduce changes due to oxidative stress damage. More work needs to be done on this subject.
In addition to the measurements of repolarisation intervals, depolarisation time and depolarisation dispersion time pose a risk for the development of arrhythmia.Reference Chávez-González, Rodríguez Jiménez and Moreno-Martínez10 It has been reported in the literature that depolarisation times in patients with beta thalassaemia major are significantly higher than those in the control group.Reference Weintraub, Hattori, Agarwal, Bodenheimer, Banka and Helfant43 In our study, depolarisation time and depolarisation dispersion time (QRS and QRS-d, respectively) in beta thalassaemia major patients were similar in the groups, and no bundle branch block pattern or fractional QRS pattern was observed in the electrocardiography of any of our patients. There was no ventricular extrasystole in the 24-hour Holter ECG recordings; sodium that provides depolarisation, or calcium ions showed no clinical pathology.
In our study, while the cardiac electrophysiological index of balance parameters QT/QRS were similar, the heart rate-corrected cardiac electrophysiological balance index QTc/QRS ratio was significantly higher, indicating that patients with beta thalassaemia major are at high risk of ventricular tachyarrhythmias even in the early period. We believe that there is a positive moderate correlation between blood ferritin levels and iCEBc parameters and that the cardiac electrophysiological balance index can provide important information in the evaluation and follow-up of patients with beta thalassaemia major in terms of arrhythmia. There are no studies in the literature in which the cardiac electrophysiological index of balance was performed in patients with beta thalassaemia major. In this sense, we believe that our study is important. Although beta thalassaemia major patients have been shown to have a high ventricular risk with the cardiac electrophysiological index of balance, this needs to be supported by clinical cohort studies.
Cardiac accumulation of iron is not homogeneous in patients with beta thalassaemia major. It is frequently concentrated in the septal and epicardial layers.Reference Ulger, Aydinok, Levent, Gurses and Ozyurek37 The action potential duration of the epicardial layer was expressed as the JTp duration on the electrocardiography. In our study, the significantly lower action potential duration of the epicardial layer in patients seems logical and consistent in terms of the anatomical localisation of iron accumulation. No other studies have evaluated JTp in patients in the literature.
Autonomic dysfunction has been reported in patients with beta thalassaemia major, and cardiac electrical abnormalities have been associated with autonomic dysfunction.Reference Kardelen, Tezcan, Akcurin, Ertug and Yesilipek30,Reference Ahmed, Salih, Omer, Rahman and Rasool44 SDNN indicates autonomic nervous system balance, while pNN50 and rMSSD predominantly indicate parasympathetic activity. The LF/HF ratio reflects sympathovagal balance.Reference Rutjanaprom, Kanlop and Charoenkwan45 In our study, parameters derived from 24-hour Holter electrocardiography recordings were evaluated in the evaluation of autonomic function, and there was no difference between the groups. This shows that there was no autonomic dysfunction in the patients with beta thalassaemia major in the early period.
Studies have reported that P-wave dispersion is high in patients with beta thalassaemia major in the evaluation of atrial arrhythmia.Reference Nisli, Taner and Naci46 In our study, P-wave dispersion values were similar between the groups. This finding supported the absence of atrial accumulation. In patients with beta thalassaemia major, iron is first present in the ventricles and then in the atria.Reference Wood47 Since the beta thalassaemia major patients in our study were in the early stages, the absence of atrial involvement was consistent.
Conclusion
In our study, the high QTc/QRS ratio value in beta thalassaemia major patients in the early period, despite normal ventricular and autonomic functions and normal repolarisation and repolarisation dispersion times, shows that the risk of ventricular arrhythmia is high even in the early period. Although it is normal when evaluated only with parameters based on repolarisation time, the fact that the cardiac electrophysiological index of balance is significantly high shows that the cardiac electrophysiological index of balance is a useful parameter for the evaluation of ventricular arrhythmia in patients with beta thalassaemia major. In addition, we believe that there is a correlation between blood ferritin levels and QTc/QRS and that the cardiac electrophysiological balance index can provide useful information for the follow-up of patients with beta thalassaemia major.
Limitations of our study
The biggest limitation of our study was that cardiac MRI was not performed. Another limitation of this study is that a parameter indicating oxidative stress caused by iron was not examined as a biomarker. Another limitation of our study is that respiratory function testing was not performed. We believe that this study could provide useful information about the mechanism of myocardial damage, even in the early period, by examining cardiac MRI and a biomarker indicating oxidative stress caused by iron and respiratory function testing. Another limitation of our study is the absence of a long-term follow-up to assess clinical arrhythmias in patients.
Acknowledgements
None.
Financial support
None.
Competing interests
The authors declare that they have no conflict of interest.
Ethical standard
The authors assert that all procedures contributing to this work comply with the ethical standards of the relevant national guidelines on human experimentation and with the Helsinki Declaration of 1975, as revised in 2008, and have been approved by the institutional committees (Ethical Committee of the Gazi Yaşargil Training and Research Hospital, with approval number 505/2023).
Informed consent
Informed consent was obtained from all individual participants included in the study.