INTRODUCTION
Leishmaniasis is caused by more than 20 species of Leishmania, which are transmitted by sandflies (genus Phlebotomus in Europe, Africa and Asia; and genus Lutzomyia in the Americas and Oceania). The World Health Organization (WHO) estimates that 350 million people are at risk of contracting this disease, as leishmaniasis is endemic in 98 countries (WHO, 2010). Considering the officially reported cases, approximately 58 000 cases of visceral leishmaniasis and 220 000 cutaneous cases are diagnosed each year (Stockdale and Newton, Reference Stockdale and Newton2013).
The immune response to leishmaniasis is complex, and the result of infection depends on the genetic composition of the Leishmania species and the immunity of the host. Several works have demonstrated that B cells contribute to the susceptibility of infection by producing polyclonal antibodies (Louzir et al. Reference Louzir, Belal-Kacemi, Sassi, Laouini, Ben Ismail and Dellagi1994; Casato et al. Reference Casato, de Rosa, Pucillo, Ilardi, di Vico, Zorzin, Sorgi, Fiaschetti, Coviello, Laganà and Fiorilli1999) and/or cytokines, such as IL-10 (Peruhype-Magalhães et al. Reference Peruhype-Magalhães, Martins-Filho, Prata, Silva Lde, Rabello, Teixeira-Carvalho, Figueiredo, Guimarães-Carvalho, Ferrari, Van Weyenbergh and Correa-Oliveira2006). IL-10 is an immunoregulatory cytokine that plays a key role in immunosuppression, a hallmark of visceral leishmaniasis. This cytokine may be produced by several cell types, but it has recently been demonstrated that cytokines secreted by B cells can play decisive roles in immunity. The in vivo role of IL-10-producing B cells has already been shown in murine autoimmune encephalomyelitis (Fillatreau et al. Reference Fillatreau, Sweenie, McGeachy, Gray and Anderton2002), Leishmania major (Ronet et al. Reference Ronet, Hauyon-La Torre, Revaz-Breton, Mastelic, Tacchini-Cottier, Louis and Launois2010) and experimental cerebral malaria caused by Plasmodium berghei (Liu et al. Reference Liu, Chen, Li, Han, Sun, Wang, Liu and Su2013).
B-1 cells are a subset of B lymphocytes that produce large quantities of IL-10 (O'Garra et al. Reference O'Garra, Chang, Go, Hastings, Haughton and Howard1992). In mice, B-1 cells represent 35–70% of the B cell subpopulation in the pleural and peritoneal cavities (Hayakawa et al. Reference Hayakawa, Hardy, Herzenberg and Herzenberg1985) but are also found in low frequency in the spleen, lymphoid tissue, mucosal sites and omentum (Ansel et al. Reference Ansel, Harris and Cyster2002). Peritoneal B-1 cells are well characterized and express some B-lineage markers, such as CD19, CD45, IgM and IgD, but do not express CD23 (Herzenberg et al. Reference Herzenberg, Stall, Lalor, Sidman, Moore, Parks and Herzenberg1986). The expression of CD5 distinguishes the two B-1 subtypes: B-1a, which is CD5+, and B-1b, which is CD5− (Hayakawa et al. Reference Hayakawa, Hardy, Parks and Herzenberg1983; Kantor and Herzenberg, Reference Kantor and Herzenberg1993). Although B-1 cells secrete large amounts of IL-10, the role of these cells in leishmaniasis is still contradictory. BALB/XID mice (X-linked immunodeficient mice which are genetically deficient in B-1 cells) infected with L. major, responsible for zoonotic cutaneous leishmaniasis, showed a significantly lower parasite burden in lymphatic organs (Hoerauf et al. Reference Hoerauf, Solbach, Lohoff and Röllinghoff1994). On the other hand, BALB/c mice depleted of peritoneal B-1 cells and infected with L. major developed a more severe disease compared with controls (Babai et al. Reference Babai, Louzir, Cazenave and Dellagi1999). Studies have not been conducted to verify the role of these cells in visceral leishmaniasis.
The aim of the present study was to analyse the role of B-1 cells in experimental infection with Leishmania. (L.) chagasi. We demonstrated that B-1 cells are necessary for susceptibility to visceral leishmaniasis, most likely due to the IL-10 produced by these cells.
MATERIALS AND METHODS
Animals
BALB/c, BALB/XID, C57BL/6 and C57BL/6 IL-10 knockout mice (IL-10KO) were purchased from the Centro de Desenvolvimento de Modelos Animais (CEDEME) of the Universidade Federal de São Paulo (UNIFESP). All of the animals used in the experiments were 6–8 weeks of age. For all experiments, we used 5–8 animals per group. The animals were handled and housed according to the NIH guide for the care and use of laboratory animals. The mice were housed in pathogen-free conditions. This study was approved by the Research Ethics Committee (CEP) of UNIFESP under protocol number 2011/00063.
Parasites
The L. (L.) chagasi strain used (MHOM/BR/1972/LD) was characterized by Dr J. J. Shaw (Instituto Evandro Chagas, Belém, Pará, Brazil) and was kindly provided by Clara Lúcia Barbieri (Universidade Federal de São Paulo, São Paulo, Brazil). The parasites were maintained as amastigotes by inoculation of BALB/c mice by the intravenous route (lateral tail vein) every 6–8 weeks with 1 × 10⁷ amastigotes. The isolate amastigotes were obtained as previously described (Barbieri et al. Reference Barbiéri, Doine and Freymuller1990).
Isolation of B-1 lymphocytes and adoptive transfer
B-1 lymphocytes were obtained as previously described, with modifications (Almeida et al. Reference Almeida, Aroeira, Frymuller, Dias, Bogsan, Lopes and Mariano2001). The cells from the peritoneal cavity were collected in cold Roswell Park Memorial Institute (RPMI) 1640 medium (Sigma, St. Louis, MO, USA) supplemented with 2 mm L-glutamine, 10 mm HEPES (4-(2-hydroxyethyl)-1-piperazineethanesulfonic acid), 24 mm sodium bicarbonate and 0·01% penicillin/streptomycin (Gibco, Thermo Fisher Scientific Brand, Grand Island, NY, USA). The obtained cells were seeded onto a tissue culture disc for 45–60 min at 37 °C to isolate the adherent cells. The non-adherent cells were discarded, and RPMI (Gibco) supplemented with 10% foetal bovine serum (FBS; Cultlab, Campinas, SP, Brazil) was added to the adherent monolayer. After 5 days without changing the medium, B-1 cells became apparent in the non-adherent layer. The B-1 cell cultures were routinely checked by flow cytometry using monoclonal anti-CD19 and anti-CD23 antibodies (BD Biosciences, San Diego, CA, USA) before each experiment.
To adoptive transfer experiments, peritoneal B-1 cells from BALB/c mice were cultured as described above. After that, the cells were washed in sterile pyrogen-free saline and 5 × 10⁵ cell/200 µL were intraperitoneally injected per animal in XID mice 24 h prior to infection.
Flow cytometry
B-1 lymphocytes were identified by double staining with an anti-CD19 monoclonal antibody conjugated to allophycocyanin (APC) and an anti-CD23 antibody conjugated to phycoerythrin (PE) or fluorescein isothiocyanate (FITC) (BD Biosciences). Primary cultures of B-1 lymphocytes and single-cell suspensions of total peritoneal cells from uninfected and infected animals were collected and washed with PBS. Approximately 1 × 10⁶ cells were used for staining. First, the cells were incubated for 20 min with Fc block (anti-CD16/CD32; BD Biosciences). After washing, the anti-CD23 and anti-CD19 antibodies, which were diluted (1:100) in PBS containing 1% bovine serum albumin (BSA; Sigma), were added to each sample. Then, the cells were washed with PBS, and the population was analysed by flow cytometry using a FACSCanto instrument (Becton Dickinson, Mountain View, CA, USA). B-1 cells (CD19+CD23−) were determined after gating lymphocytes in forward scatter vs side scatter dot plots. The gate strategy is shown in online Supplementary Fig. 1.
Parasite burden analysis
To determine the in vivo parasite burden of the infected animals, groups of 5–8 animals were euthanized after 15, 25 and 45 days of intravenous (lateral tail vein) infection with 1 × 10⁷ amastigotes (Ferreira et al. Reference Ferreira, Gentil, Dias, Fedeli, Katz and Barbiéri2008). The parasite load was evaluated in the spleen with the limiting dilution method as previously described (Lima et al. Reference Lima, Bleyenberg and Titus1997). In all experiments, the sequential dilutions were done with factor 2 and were performed three replicates per animal.
Cytokine assay
The levels of IL-10, IFN-γ and TNF-α were measured in the sera and the spleen homogenates of animals infected with L. (L.) chagasi. The spleen homogenates were obtained as previously described (González et al. Reference González, Yáñez, Gozalbo and Gil2008). Each organ was aseptically removed, weighed it and subsequently homogenized it in 1·5 mL sterile PBS. The samples were centrifuged, and the supernatants were collected and stored at −70 °C. All dosages were measured by capture ELISA (R&D Systems, Minneapolis, MN, USA) as described by the manufacturer. First, 96-well plates (Costar, Corning Incorporated, NY, USA) were sensitized with 100 µL well−1 of capture antibody (working concentration of 4·0 µg mL−1 in PBS). After overnight incubation at room temperature, the plates were blocked with 300 µL well−1 of PBS containing 1% BSA for 1 h at room temperature. Then, the wells were washed three times with 400 µL well−1 of wash buffer (PBS containing 0·05% Tween). The samples or standard recombinant proteins (IL-10, IFN-γ and TNF-α) were added following incubation for 2 h at room temperature. After washing, the detection antibody was diluted in PBS containing 1% BSA and added at 400 ng well−1. The plates incubated for 2 h at room temperature. Next, streptavidin (1:200; R&D Systems) was added, and the plate was incubated for 20 min at room temperature in the dark. The reactive wells were detected by the addition of substrate solution (1 mg of o-phenylenediamine [OPD; Sigma] in 5 mL of 0·1 m citrate–phosphate buffer [pH, 5·0] plus 10 µL of 30% H2O2; Merck), and the reaction was stopped by the addition of 50 µL well−1 of 4 N H2SO4. Optical density was measured at 492 nm in an automatic MCC/40 plate reader (Labsystem Multiscan Dynatech, Chantilly, VA, USA). The standards were used to prepare a standard curve, which was used to determine the concentration of each cytokine in the samples.
Parasite burden analysis by quantitative real-time PCR (RT-qPCR)
The parasite load was also determined by RT-qPCR, following the MIQE guidelines (Bustin et al. Reference Bustin, Benes, Garson, Hellemans, Huggett, Kubista, Mueller, Nolan, Pfaffl, Shipley, Vandesompele and Wittwer2009). Briefly, RNA from the spleen or liver of each infected mouse was reverse transcribed using a ProtoScript M-MuLV First Strand cDNA Synthesis Kit (New England Biolabs, Ipswich, MA, USA) according to the manufacturer's instructions. Real-time PCR was conducted using SYBR Green (Applied Biosystems, Thermo Fisher Scientific Brand, Foster City, CA, USA). The primers used to detect the mRNA of the LINJ31 gene, which encodes a hypothetical protein from the parasite kinetoplast, were as follows: forward, 5′CGGCAAAGTCCAAGGAGGAGTT-3′ and reverse, 5′-TACGCAACGTACAGTGCCGCAATCA-3' (Reimão et al. Reference Reimão, Colombo, Pereira-Chioccola and Tempone2011). The reference control primers used to evaluate the mRNA levels of RPLP0, a mouse ribosomal gene, were as follows: forward, 5′-AGCTGAAGCAAAGGAAGAGTCGGA-3′ and reverse, 5′-ACTTGGTTGCTTTGGCGGGATTAG-3′. The reactions were performed using an ABI 7500 real-time PCR System (Applied Biosystems) with equal amounts of each cDNA. A 10-μL total volume was used for each PCR reaction, which consisted of 1 × SYBR Green PCR Master Mix, 250 nmol of the reverse primer, 250 nmol of the forward primer and 2 µL cDNA. The cycling parameters were 50 °C for 10 min, 95 °C for 5 min and 40 cycles at 95 °C for 30 s and 60 °C for 1 min. A non-template control was used to detect any contamination. cDNA from the spleens of non-infected mice was also used as a control.
After evaluating the quality of the reaction using dissociation curves, the results were analysed using Step One Plus software (Applied Biosystems). A threshold cycle value (Ct) was determined as the point at which the fluorescence exceeded the threshold limit. Amplification efficiencies were determined by comparing the dilution series of the reference gene and target gene from a reference cDNA template. The serial dilutions were amplified, and Ct values were obtained and used to construct a standard curve for LINJ31. The amplification efficiency was calculated using the following equation: E = 10(−1/slope)−1, in which ‘E’ is the efficiency and ‘slope’ is the slope of the standard curve. A validation calculation was performed to evaluate if the efficiencies of the target gene and endogenous gene were approximately equal (90% ⩽ E ⩽ 110%). The efficiencies of LINJ31 and endogenous gene were 93·2 and 90·4%, respectively. For LINJ31, the slope and R2 were −3·494 and 0·99, respectively. Relative quantification was determined according to the 2−∆∆Ct method (Vandesompele et al. Reference Vandesompele, De Preter, Pattyn, Poppe, Van Roy, De Paepe and Speleman2002). Each reaction was performed in triplicate and each group contained at least 5 animals. Differences in the relative expression levels of genes were analysed by defining reference cDNA as the reference sample and arbitrarily setting its average value to 1. The results are expressed as the mean ± s.d., and P values were determined using Student's test.
Statistical analysis
Data were presented as the mean ± the standard deviation (s.d.) and were representative of at least two independent experiments. Student's t-test was used to compare the percentage of the peritoneal B-1 cells between uninfected and infected mice. For comparisons between multiple groups of mice, analysis of variance (ANOVA) was performed followed by Tukey's post-test P values <0·05 were considered significant. All statistical tests were performed using Prism version 6.00 for Mac (GraphPad Software, La Jolla, CA, USA; www.graphpad.com).
RESULTS
B-1 cell population increases in the peritoneal cavity after infection with L. (L.) chagasi
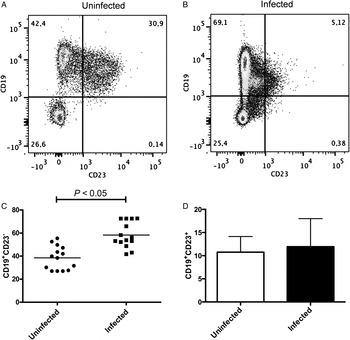
To address the involvement of B-1 cells in visceral leishmaniasis, we first evaluated the changes in the B-1 cell population of the peritoneal cavity of BALB/c mice in response to L. (L.) chagasi infection using flow cytometry. Figure 1A shows the representative dot plots of peritoneal B-1 cells from uninfected and infected BALB/c mice. As shown in Fig. 1B, the percentage of CD19+CD23− cells, which correspond to B-1 cells, significantly increased in the peritoneal cavity after 45 days of infection with L. (L.) chagasi (P < 0·05). In contrast, the mean percentage of CD19+CD23+ cells, corresponding to B-2 cells, had no difference after infection (Fig. 1C).
Leishmania chagasi-infected mice exhibited an increase in CD19+CD23− cells in the peritoneal cavity after 45 days of infection. BALB/c mice were intravenously infected with 1 × 10⁷ amastigotes of L. (L.) chagasi. After 45 days, total peritoneal cells were collected and labelled with anti-CD19-APC and anti-CD23-PE antibodies (n = 14). Uninfected mice were used as a control (n = 14). The analysis was performed by gating lymphocytes in forward scatter vs side scatter dot plots. (A) Representative dot plots of CD19 vs CD23 expression in the peritoneal cavity of uninfected or infected mice. The numbers indicate the percentage of cells in each quadrant. (B) The average percentage of CD19+CD23− cells (n = 14 animals). (C) The mean percentage of CD19+CD23+ cells (n = 14 animals). Abbreviations: APC, allophycocyanin; PE, phycoerythrin. Error bars denote the s.d. Student's t-test (P < 0·05 vs control). Data from three experiments.

B-1 cells contribute to disease susceptibility in mice
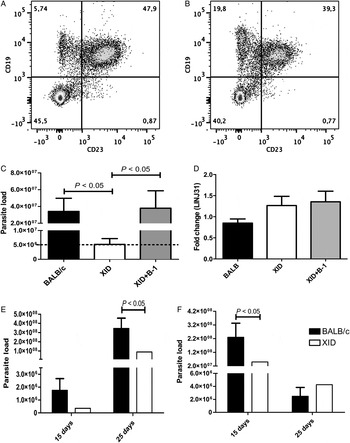
Given the increase in the B-1 cell population in response to L. (L.) chagasi infection, the role of this lymphocyte population on infection was evaluated further. B-1 cell-deficient BALB/XID mice (XID), BALB/c mice (BALB/c) and BALB/XID mice that were previously populated with B-1 cells (XID + B-1) were infected with L. (L.) chagasi. After 45 days, their spleens and livers were used to determine the parasite burden using the limiting dilution method described in the ‘Material and methods’ section. As a control, the B-1 cell deficiency of the BALB/XID mice was confirmed by flow cytometry (Fig. 2A). As demonstrated in Fig. 2B, we observed the presence of peritoneal B-1 cells in the BALB/XID + B-1 mice 45 days after the adoptive transfer.
B-1-deficient mice (XID) exhibited enhanced resistance to Leishmania. (L.) chagasi. Animals were intravenously infected with 1 × 10⁷ amastigotes of L. (L.) chagasi. After 45 days, the parasite burden was determined using the limited dilution method. As controls, the deficiency in B-1 cells in uninfected BALB/XID mice (A) and the presence of peritoneal B-1 cells in uninfected BALB/XID + B-1 (XID + B-1) mice 45 days after adoptive transfer (B) were checked by labelling total peritoneal cells with anti-CD19-APC and anti-CD23-FITC (n = 5 for each group). The analysis was performed by gating lymphocytes in forward scatter vs side scatter dot plots. The dot plots are representative of CD19 vs CD23 expression in total peritoneal cell population. Numbers indicate the percentage of cells in the corresponding quadrant. Data are representative of three independent experiments. (C) Parasite burden in the spleens of BALB/c, XID and XID + B-1 after 45 days of infection with 1 × 10⁷ amastigotes of L. (L.) chagasi. The results were comparable for two independent infections. The results represent the mean of five individual mice per group. We used 24 dilution steps with two replicates per dilution step during the limiting dilution. The dashed line shows the mean value of parasite load in XID mice. (D) The relative mRNA levels for the LINJ31 gene (which encodes a hypothetical protein from the parasite kinetoplast) were evaluated by RT-qPCR in the liver. Relative gene expression was calculated according to 2−ΔΔCt method using the cellular RPLP0 mRNA level as an endogenous control. The results of the RT-qPCR analysis of the target gene expression are shown in the figure. The graph is representative of two independent experiments. Bars denote the average of triplicate experiments, and error bars denote the s.d. One-way ANOVA was performed, followed by the post-hoc Tukey test (P < 0·05 vs control). (E) Parasite burden in the spleens of BALB/c and XID after 15 and 25 days of infection with 1 × 10⁷ amastigotes of L. (L.) chagasi. (F) Parasite burden in the livers of BALB/c and XID after 15 and 25 days of infection. The results represent the mean of eight individual mice per group. We used the same parameters for limiting dilution described above.Abbreviations:XID, X-linked immunodeficient; APC, allophycocyanin; FITC, fluorescein isothiocyanate; RT-qPCR, quantitative real-time PCR; Ct, threshold cycle value; ANOVA, analysis of variance. One-way ANOVA, followed by the Tukey test (P < 0·05 vs BALB/c).

Using the limitant dilution method, the BALB/XID mice had significantly reduced parasite numbers in their spleens after the infection period (P < 0·05), suggesting the important role of B-1 cells in susceptibility to L. (L.) chagasi. In addition, the BALB/XID + B-1 mice showed an increase in spleen parasite burden, supporting the hypothesis of the contribution of B-1 cells to parasite persistence (P < 0·05) (Fig. 2C). Similar results were obtained when the parasite load in the spleen were determined by analysing the expression of the LINJ31 gene as a measure of infection by real-time PCR (data not shown). However, there was no difference in the expression of the LINJ31 gene when the liver was analysed (Fig. 2D). In order to verify the differences in the resistance between BALB/c and XID mice in early infection, we infected those animals (8 animals per group) and checked the parasite load after 15 and 25 days post-infection. After 15 days, the parasite load was higher in the liver in BALB/c mice, as compared with XID mice (P < 0·05). No statistically significant difference was detected between the groups when the spleens were analysed. After 25 days, there was a decrease in the liver parasite burden in both groups but we did not detect statistical significance when we compared BALB/c and XID groups. When the parasite load was analysed in the spleen, we observed an increase in both groups with significantly higher parasite burden in BALB/c mice compared with XID mice (P < 0·05) (Fig. 2E and F).
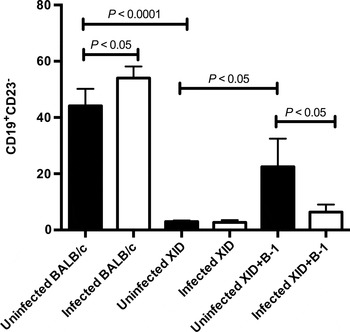
To ascertain the possible differences in the B-1 populations of the peritoneal cavity of the infected mice, flow cytometry analysis was performed. Non-infected mice were used as a control group. As expected, no differences were found when the peritoneal cell populations were analysed for the presence of B-1 lymphocytes in infected and uninfected BALB/XID mice (Fig. 3). Importantly, for these animals, very low labelling was detected when the peritoneal cell populations were stained for B-1 lymphocytes. For the BALB/c group, animals infected with L. (L.) chagasi showed a significant increase in the percentage of B-1 cells in the peritoneum when compared with uninfected mice. Surprisingly, the percentage of peritoneal B-1 cells in the infected BALB/XID + B-1 mice was lower than that in the uninfected BALB/XID + B-1 mice. Taken together, these findings indicate that B-1 cells contribute to the establishment and maintenance of infection in visceral leishmaniasis.
The peritoneal B-1 cell population was modulated in BALB/c and BALB/XID + B-1 mice after infection with Leishmania. (L.) chagasi. BALB/c, BALB/XID (XID) and BALB/XID + B-1 (XID + B-1) animals were intravenously infected with 1 × 10⁷ amastigotes of L. (L.) chagasi for 45 days. Total peritoneal cells were obtained and labelled with anti-CD19-APC and anti-CD23-PE antibodies (n = 5 per group). Uninfected mice were used as a control (n = 5). The analysis was performed by gating lymphocytes in forward scatter vs side scatter dot plots. Graph represents average percentage of the five animals in each group. Abbreviations: XID, X-linked immunodeficient; APC, allophycocyanin; PE, phycoerythrin.Error bars denote the s.d. ANOVA was performed, followed by the post-hoc Tukey test (P < 0·05 vs control). Data are representative of two independent experiments.

Cytokine production
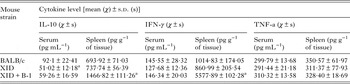
The cytokine levels were evaluated in spleen homogenates or sera (Table 1) from BALB/c, BALB/XID and BALB/XID + B-1 mice that were infected with L. (L.) chagasi for 45 days. The IL-10 and IFN-γ levels were significantly higher in the spleens of the BALB/XID + B-1 mice than in the BALB/c and BALB/XID mice. There was no difference in the TNF-α level between all groups analysed. For the serum samples, the BALB/XID mice showed a statistically significant lower level of IL-10 compared with the BALB/c.
Cytokine determination in spleen homogenates or sera from BALB/c, BALB/XID and BALB/XID + B-1 mice infected with Leishmania. (L.) chagasi for 45 days (n = 5)

a One-way ANOVA was performed, followed by the post-hoc Tukey test (P < 0·05 vs BALB/c).
The results are representative of two independent experiments.
B-1 cells producing IL-10 may contribute to susceptibility to visceral leishmaniasis
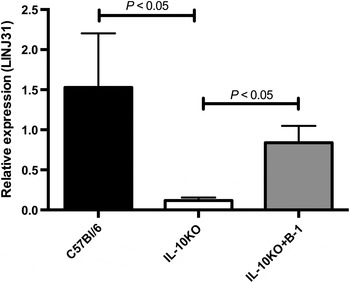
It has been clearly established that B-1 cells are high IL-10 producers (O'Garra et al. Reference O'Garra, Chang, Go, Hastings, Haughton and Howard1992; Griffin and Rothstein, Reference Griffin and Rothstein2012), a potent regulator of immune functions. Thus, to better evaluate whether the IL-10 produced by B-1 cells is involved in susceptibility to L. (L.) chagasi, IL-10KO mice were adoptively transferred with peritoneal B-1 cells (IL-10KO + B-1) from wild type animals (C57BL/6). C57BL/6 mice were used as a control. After 45 days of infection, all the animals were euthanized and parasite load was determined by analysing the expression of the LINJ31 gene (Reimão et al. Reference Reimão, Colombo, Pereira-Chioccola and Tempone2011). Two independent experiments were performed.
As expected, there was a significant decrease in LINJ31 expression in the IL-10KO mice when compared with the control C57BL/6 mice (Fig. 4). However, the transfer of B-1 cells into the IL-10KO animals (IL-10KO + B-1) led to an increase in LINJ31 expression in relation to the IL-10KO group (Fig. 4), which correlates with an increase in parasite load.
B-1 cells contribute to susceptibility to infection with Leishmania. (L.) chagasi in IL-10 knockout mice (IL-10KO). C57BL/6, IL-10KO and IL-10 knockout mice that received an adoptive transfer of peritoneal B-1 cells (IL-10KO + B-1) were infected with 1 × 10⁷ amastigotes of L. (L.) chagasi (n = 3 per group). After 45 days, the mRNA from the spleen of each mouse was extracted, and cDNA was generated. The expression of LINJ31 gene was evaluated by RT-qPCR. Relative gene expression was calculated according to 2−ΔΔCt method, as previously described. The RPLP0 mRNA level was used as an endogenous control. The graph is representative of two independent experiments. Bars denote the average of triplicate experiments, and error bars denote the s.d. Abbreviations: RT-qPCR, quantitative real-time PCR; ANOVA, analysis of variance.One-way ANOVA was performed, followed by the post-hoc Tukey test (P < 0·05 vs control).

DISCUSSION
The results obtained in this study showed that B-1 cells may play an important role in the susceptibility to experimental infection with L. (L.) chagasi. First, we demonstrated an increase in the percentage of B-1 cells in the peritoneal cavity in BALB/c mice after 45 days of infection with this parasite. Moreover, experiments performed with BALB/XID mice showed that these animals were more resistant to infection than wild type (BALB/c) mice and that the transfer of peritoneal B-1 cells into BALB/XID mice restored the susceptibility to infection. This effect may be partially explained by the production of IL-10 by B-1 cells, as the adoptive transfer of these cells from wild-type mice into IL-10KO mice led to an increase in susceptibility in these animals.
The role of B-1 cells in infectious disease is still not clear. Using BALB/XID mice model, it has been shown to be susceptible to various infections, including Strongyloides stercoralis (Herbert et al. Reference Herbert, Nolan, Schad and Abraham2002), Schistosoma mansoni (Gaubert et al. Reference Gaubert, Viana da Costa, Maurage, Lima, Fontaine, Lafitte, Minoprio, Capron and Grzych1999) and Cryptococcus neoformans (Szymczak et al. Reference Szymczak, Davis, Lundy, Dufaud, Olszewski and Pirofski2013). In addition, BALB/XID mice showed transient early susceptibility to pulmonary infection with Mycobacterium tuberculosis characterized by changes in macrophage morphology, decreased activation of lung natural killer cells, IL-10 production and accumulation of macrophages in lung lesions (Junqueira-Kipnis et al. Reference Junqueira-Kipnis, Kipnis, Henao Tamayo, Harton, Gonzalez Juarrero, Basaraba and Orme2005). Nevertheless, BALB/XID mice were resistant to Trypanosoma cruzi (Minoprio et al. Reference Minoprio, el Cheikh, Murphy, Hontebeyrie-Joskowicz, Coffman, Coutinho and O'Garra1993) and Paracoccidioides brasiliensis infection (Popi et al. Reference Popi, Godoy, Xander, Lopes and Mariano2008). The resistance were also observed in BALB/XID mice infected with Francisella tularensis. When compared with controls, BALB/XID mice had enhanced clearance of bacteria from the lung and spleen associated with decreased numbers of IL-10-producing B-1a cells and concomitant increased numbers of IL-12-producing macrophages and IFN-γ producing NK/NKT cells (Crane et al. Reference Crane, Griffin, Wehrly and Bosio2013). Therefore, the participation of B-1 cells in immunity is very complex and appears to depend on the pathogen and time of infection.
Our data suggest that B-1 cells have some participation in the susceptibility to L. (L.) chagasi infection. Although we have not observed differences in parasite burden in the liver of infected animals after 25 and 45 days of infection (Fig. 2D and F), we detected significantly lower parasite load in the liver of BALB/XID mice in the early infection 15 days (Fig. 2F). However, we observed a significantly lower parasite burden in the spleen of BALB/XID mice compared with BALB/c mice and BALB/XID + B-1 (Fig. 2C and E). These results are consistent with previous studies showing that the liver infection in mice is self-resolving, while spleen infection is progressive (Engwerda et al. Reference Engwerda, Ato and Kaye2004).
On the other hand, the role of B-1 cells in cutaneous experimental leishmaniasis is still contradictory. BALB/c and C57Bl/6 mice depleted of peritoneal B220+CD5+ cells (B-1a) and infected with L. major had no differences in the parasite burden in the draining lymph node compared with their respective controls (Babai et al. Reference Babai, Louzir, Cazenave and Dellagi1999), suggesting that B-1a cells do not participate in the experimental infection with L. major. In contrast, experimental subcutaneous infection of BALB/XID mice with L. major allowed a substantially enhance of the Th1 response mediated by IFN-γ (Hoerauf et al. Reference Hoerauf, Solbach, Lohoff and Röllinghoff1994) which is critical for the resolution of leishmaniasis (Stanley and Engwerda, Reference Stanley and Engwerda2007). However, the Th1 response alone do not protect against disease, since the progression is strongly correlated with the production of high amounts of IL-10 (Ansari et al. Reference Ansari, Kumar, Gautam, Nylén, Singh, Sundar and Sacks2011, reviewed in Kumar and Nylén, Reference Kumar and Nylén2012), an immunosuppressive cytokine that inhibits leishmanicidal immune functions (reviewed in Nylén and Sacks, Reference Nylén and Sacks2007). In our model, susceptible mice BALB/c and BALB/XID + B-1 showed higher levels of IFN-γ in spleen compared with BALB/XID group. Some reports have demonstrated that IFN-γ is produced when the parasitic infection still progresses (reviewed in Goto and Prianti, Reference Goto and Prianti2009; McCall et al. Reference McCall, Zhang and Matlashewski2013). Peripheral blood mononuclear cells from patients with active visceral leishmaniasis are able to produce IFN-γ in response to Leishmania antigen (Singh et al. Reference Singh, Gidwani, Kumar, Nylen, Jones, Boelaert, Sacks and Sundar2012).
Interestingly, the IL-10 levels were lower in the sera of BALB/XID mice than in the control mice (BALB/c) (Table 1), which may be related to the increased resistance of the BALB/XID animals to infection (Fig. 2C). Several different populations of cells have been described as IL-10 producers in visceral leishmaniasis including innate cells, NK cells, multiple T cell subtypes and B cells (Nylén et al. Reference Nylén, Khamesipour, Mohammadi, Jafari-Shakib, Eidsmo, Noazin, Modabber and Akuffo2006; Maroof et al. Reference Maroof, Beattie, Zubairi, Svensson, Stager and Kaye2008; Ranatunga et al. Reference Ranatunga, Hedrich, Wang, McVicar, Nowak, Joshi, Feigenbaum, Grant, Stäger and Bream2009). Using L. major as a model, it was demonstrated that the IL-10 produced by B cells is necessary for infection susceptibility in BALB/c mice and for Th2 cell development (Ronet et al. Reference Ronet, Hauyon-La Torre, Revaz-Breton, Mastelic, Tacchini-Cottier, Louis and Launois2010). Our results demonstrated that IL-10KO mice that received B-1 cells from wild type animals showed restored susceptibility to infection when compared with wild type and IL-10KO animals (Fig. 4). These data suggest that the IL-10 produced by B-1 cells contributes, at least in part, to susceptibility to L. (L.) chagasi infection.
It is interesting to note that the population of B-1 cells was altered in response of L. chagasi infection. After 45 days of infection, BALB/c mice had increased populations of peritoneal B-1 cells (CD19+CD23−) (Figs 1A and 3). Nevertheless, the BALB/XID + B-1 group decreased the percentage of B-1 cells in peritoneum after infection (Fig. 3). Several studies have demonstrated that the B-1 cell population are very versatile cells. They may migrate to a non-specific inflammatory focus (Almeida et al. Reference Almeida, Aroeira, Frymuller, Dias, Bogsan, Lopes and Mariano2001) and/or be modulated in response to different stimuli. BCG and L. major inoculated into the footpads of BALB/c (Babai et al. Reference Babai, Louzir, Cazenave and Dellagi1999; Russo and Mariano, Reference Russo and Mariano2010), and Propionibacterium acnes intraperitoneally injected in BALB/c mice (Mussalem et al. Reference Mussalem, Squaiella-Baptistão, Teixeira, Yendo, Thies, Popi, Mariano and Longo-Maugéri2012) increased the percentage of peritoneal B-1 cells. However, animals intraperitoneally infected with T. cruzi revealed a decrease in the percentage of B-1 cells after 15 days of infection, attributed to the differentiation of these cells into IgM-secreting cells (Merino et al. Reference Merino, Montes, Acosta-Rodriguez, Bermejo, Amezcua-Vesely and Gruppi2010). In addition, the treatment of BALB/XID mice with LPS after adoptive transfer of B-1 cells labelled with CFSE leads to the presence of CFSE+ cells in the peritoneal macrophage population (Popi et al. Reference Popi, Osugui, Perez, Longo-Maugéri and Mariano2012), indicating that B-1 cells may differentiate into phagocytes in vivo and most likely contribute to the macrophage population. In our study, we did not determine the fate of the B-1 cells transferred into the peritoneum of the BALB/XID mice, but we found that these cells somehow altered the immune response. When compared with the BALB/XID group, there was a pronounced increase in the IL-10 and IFN-γ levels in the spleen in the BALB/XID + B-1 mice (Table 1), suggesting the importance of these cells in cytokine production.
Our findings indicate that B-1 cells are important in the susceptibility to infection with L. (L.) chagasi. The role of B-1 cells in this process could be the result of the IL-10 produced by these cells. Understanding the role of B-1 cells in visceral leishmaniasis remains an important issue that deserves further study, and new strategies should be developed to manipulate these cells to benefit the host.
SUPPLEMENTARY MATERIAL
To view supplementary material for this article, please visit http://dx.doi.org/10.1017/S0031182015000943
ACKNOWLEDGEMENTS
We are grateful to Professor Clara Lucia Barbieri for her suggestions on improving the manuscript. The authors are indebted to Simone Katz for her technical assistance.
FINANCIAL SUPPORT
This work was supported by the Fundação de Amparo à Pesquisa do Estado de São Paulo (grant number 2012/11837-6 to P.X. and scholarship number 2010/19569-5 to V.X.), the Conselho Nacional de Desenvolvimento Científico e Tecnológico (grant number 475535/2010-3 to P.X.) and the Coordenação de Aperfeiçoamento Pessoal de Ensino Superior.