


1. Scope and introduction
This paper is aimed at reviewing the knowledge of interactions of surfactants with lipid membranes. The term surfactant is used here for surface-active, soluble amphiphiles (Small, Reference Small1970). These are molecules reducing the surface tension of water by forming a monolayer at the air–water interface. They possess an aqueous solubility (critical micelle or aggregation concentration) in the micro- or millimolar range above which they self-associate to micelles, bilayer vesicles or other aggregates. Surfactants include synthetic detergents, physiological compounds such as bile salts, lysolipids and certain amphiphilic peptides and other amphiphiles. ‘Lipids’ here refers to virtually insoluble phospholipids found in biological membranes.
The interactions discussed in this paper play an important role in a vast field, including the regulation of cellular processes, the activity and delivery of drugs, biochemical techniques for membrane studies, digesting food and washing dishes. The main aim of this paper is to provide a general, yet detailed basis of the models and parameters describing such systems, filling also the gap between general physical chemistry textbooks and specific research articles.
Pioneering studies in the field of surfactant–lipid interactions (e.g. Helenius & Simons, Reference Helenius and Simons1975; Ribeiro & Dennis, Reference Ribeiro and Dennis1975; Alonso et al. Reference Alonso, Villena and Goni1981; Kresheck & Nimsgern, Reference Kresheck and Nimsgern1983; Lichtenberg et al. Reference Lichtenberg, Robson and Dennis1983; Lichtenberg, Reference Lichtenberg1985; Schurtenberger et al. Reference Schurtenberger, Mazer and Känzig1985; Small, Reference Small1986; Ollivon et al. Reference Ollivon, Eidelman, Blumenthal and Walter1988) have provided a sound basis.
Details require some careful attention to physical chemistry, but it is amazing how much qualitative and even semi-quantitative insight can already be obtained according to the simple logics of a pizza service: Quasi-triangular slices come from round pizzas; slices from small pizzas are more conical and have a higher proportion of outer crust than large ones. Rectangular slices come from rectangular pizzas. From the effective shape of the surfactant, in particular the lateral area required by the head group and the volume filled by the chain, one can immediately make a qualified guess which aggregate structure it forms (Fig. 1); a quantitative expression is given by Israelachvili's (Reference Israelachvili1991) simple, yet powerful concept of packing parameters. What goes beyond pizza logics is that the effective shape is not always obvious; an example shown in Fig. 1 is SDS, which has a small head group when van der Waals radii are concerned but a large effective head group size in pure SDS micelles because the negatively charged sulphates cannot be fully dehydrated and packed directly together. Hence, the effective shape of SDS depends also on salt concentration and, in mixtures, on the nature of the lipid or co-surfactant. Another problem is that there are effective shapes requiring a mean curvature that cannot be practically realised by any principal aggregate topology because there are gaps between the mean interfacial curvatures for stable spheres, cylinders, lamellae and cubic/inverse phases. Instead, the molecules have to undergo elastic deformations upon association (Helfrich, Reference Helfrich1973; Andelman et al. Reference Andelman, Kozlov and Helfrich1994). This is considered by the concept of real versus spontaneous curvature (Section 3.2).
Semi-schematic representations of the structures and ‘effective shapes’ of a series of surfactants and a lipid, POPC. From the left to the right, molecules have a negative (MO, monoolein), about zero (C12EO3, POPC) and increasingly positive spontaneous curvature at 25°C. In accord with this, they form aggregates with increasingly positive curved surfaces: inverse hexagonal (no example shown), cubic, lamellar, cylindrical micellar and spherical micellar. See list of symbols for full names.

Another key concept of surfactant–lipid systems has been to treat different aggregate structures (and monomers in solution) as separate pseudo-phases. This provides the basis for the famous three-stage model (Helenius & Simons, Reference Helenius and Simons1975; Lichtenberg, Reference Lichtenberg1985) comprising lamellar, lamellar+micellar and micellar ranges (aggregates are in equilibrium with surfactant monomers, respectively). Again, it is surprising how well this simple approximation describes the thermodynamic behaviour of many systems, and again, the challenge is in the detail: Which of the many structural intermediates and components belong to the lamellar and which to the micellar family (see Section 4)?
After Lasch's (Reference Lasch1995) review and the excellent special journal issue edited by Alonso and Goñi (Reference Alonso and Goni2000), the phenomenon of DRMs has arisen as one major new focus in lipid–detergent research. Generally, a major aim of recent and current investigations has been the extension of the established, quantitative models to more complex systems.
Nevertheless, substantial further efforts will be required to understand the functions of surfactant-like biomolecules and to optimise the numerous biomedical, cosmetic and technical applications of surfactants in a rational manner. Section 5 gives a superficial overview of some of these topics, each being a vast field in itself. Considerable progress in these scientifically, medically and economically highly important fields will depend crucially on understanding surfactant effects.
2. Membrane–water partitioning
2.1 Partition coefficients and isotherms: overview
Up to a certain surfactant concentration (for substantial lipid concentrations, this is well above the CMC), there are no micelles but the surfactant molecules partition between the membrane and the aqueous solution. Distinguishing surfactant molecules that are incorporated in a membrane from those in aqueous solution is a key requirement for virtually all surfactant–lipid studies, and data disregarding partitioning are very limited in their applicability. The large number of different definitions and models and different characteristics of pertinent methods might be confusing at first glance; Section 2 aims at shedding light on this issue.
One way to illustrate the membrane–water partitioning of a solute is to plot a partition isotherm showing the mole fraction of the solute in the membrane (X Sb) as a function of the aqueous surfactant concentration (C Saq) that is in equilibrium with this mixed membrane at a given temperature. The isotherm is usually modelled in terms of a partition coefficient (and, if required, an activity coefficient). Let us, for the sake of illustration, consider the spheres in Fig. 2, which represent an artificial but characteristic membrane partitioning isotherm of a surfactant. Nernst's (Reference Nernst1891) partitioning law stated that the ratio of the concentrations of dilute solutions in two equilibrated but macroscopically separated phases (solvents) is a constant, the partition coefficient. Dilute solutions show no solute-induced changes of the phases and virtually no solute–solute contacts; in our example, this regime applies approximately up to X Sb∼0·1. There, the partitioning can be equally well described by all the definitions, K R, K X,  X, K C mentioned here (see the following two sections); see also the lines in Fig. 2 except the red dotted one representing an average X.
Schematic illustration of a partitioning isotherm of a surfactant into lipid vesicles. The spheres represent arbitrary but typical data points, and the lines were generated with different models as follows: thin red line: X=1 mm−1, Eq. (6), identical with K X=55 500, Eq. (5); red dotted line: average X=0·68 mm−1; bold green line: X(X Sb) analogously to Eq. (21) with X(0)=1 mm−1 and ρ0=−0·7RT; dashed blue line: K R=1 mm−1 according to Eq. (10). The partitioning isotherms end at the onset of solubilisation at C Saq, sat=0·68 mm, as implied by the vertical increase of the ‘bound’ mole fraction [that is now X e, Eq. (34), and no longer X Sb] at constant C Saq (see line marked ‘bil+mic’).
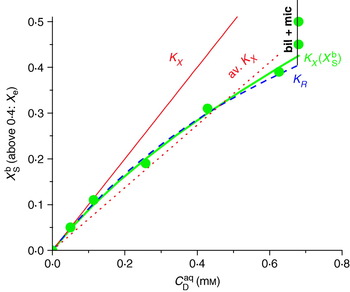
At substantial solute concentration, the law of partitioning applies to the activities of the solute in the two phases, which agree with concentrations [relatively to standard state, such as X Sb and X Saq or C Saq/C Saq(standard)] only if the solute mixes ideally with the solvent. The case of ideal mixing is illustrated by the thin, red solid line which assumes that K X as obtained for dilute solutions applies also to high concentrations. However, this is not true for our example and most real lipid–surfactant systems. Instead, the apparent X in Fig. 2 decreases from 1 mm−1 at low X Sb to 0·62 mm−1 at X Sb=0·4. Above this concentration, X Sb increases almost vertically (with C Saq remaining constant) indicating that solubilisation has started; this range has to be excluded from membrane partitioning analysis. Fitting the whole isotherm (up to X Sb=0·4) with a constant X yields 0·68 mm−1 (red dotted line in Fig. 2), which is a poor fit and fails to provide the thermodynamically interesting value of X for dilute solutions. It is therefore advisable to include a suitable term for a concentration-dependent activity coefficient in the partition model so that it describes the curve properly. This is achieved semi-empirically in many cases by using K R (here, K R=1 mm−1 along the whole dashed curve) or by X(X Sb, ρ0) (bold green curve), which fits the data by two physically meaningful parameters, X(0)=1 mm−1 and the non-ideality parameter ρ0=−0·7RT. Although both models base on different rationales and expressions, they yield practically indistinguishable isotherms up to X Sb∼0·4 (see Section 2.3 for details). The curves deviate at higher X Sb, but most surfactants cannot be incorporated to such high amounts into membranes anyway. That means, for isotherms limited to X Sb<0·4–0·5, mathematical simplicity favours K R over K X(X Sb, −0·7RT). K X(X Sb) may be superior for isotherms reaching high surfactant concentrations and systems exhibiting a different non-ideality. This is clearly the case for isotherms approaching pure surfactant aggregates (for surfactants forming vesicles or, analogously, for partitioning into mixed micelles) because K R is not defined for X Sb=1.
The derivations, detailed properties and conversion rules of the different partition coefficients are given below for ideal mixing (K X, X, K C; Section 2.2) and non-ideal mixing (K R, K X(X Sb; Section 2.3).
2.2 Ideal mixing
Assuming ideal mixing, the chemical potential, μSb, of a surfactant, S, in a membrane bilayer, b, can be written as:

with the activity of the surfactant in the membrane equal to the mole fraction:

The terms n Sb and n Lb denote the mole numbers of surfactant (S) and lipid (L) in the bilayer (b). The reference state with the standard chemical potential  is that of a detergent in a hypothetic, pure detergent bilayer. R and T stand for the general gas constant and the absolute temperature, respectively, and the concentration-dependent term, RTlnX Sb, corresponds to the change in entropy of ideal mixing in the membrane upon addition of surfactant.
Considering membrane and water as two separate phases, equilibrium partitioning is reached when the chemical potential of the surfactant is equal in the bilayer (b) and aqueous (aq) phase, μSb=μSaq. Writing μSaq analogously to μSb [Eq. (1)], we obtain:

and, in turn:

That means that the ratio of the mole fractions in the two phases should be constant for ideal mixing. It represents the concentration gradient that can be caused by a given intrinsic preference of the surfactant for the membrane, given by ΔμS0, aq→b<0, against the entropy of mixing. This ratio is defined as the mole fraction partition coefficient K X (often also referred to as P) (Tanford, Reference Tanford1980):

The concentration of lipid in water is neglected since membrane lipids have an extremely low solubility (typically ⩽10−9 M). The concentration of molecules in the aqueous phase is virtually constant, C W+C Saq≈C W≈55·5 M.
Whether partitioning into a real lipid membrane is spontaneous or favourable depends on whether the current, non-equilibrium ratio X Sb/X Saq is above or below K X. It has nothing to do with Δμ0, which refers to the ‘intrinsic preference’ of the molecule for a certain, often merely hypothetic standard state chosen to eliminate the entropy of mixing. For example, K X=10 implies that the transfer of surfactant from a hypothetic liquid of pure (X Saq=1) yet fully hydrated (a contradiction in itself in practical terms) surfactant into a pure surfactant membrane would be favoured by ΔμS0, aq→b=−5·7 kJ mol−1.
Some authors omit the constant C W in their definition of the partition coefficient (Lichtenberg et al. Reference Lichtenberg, Opatowski and Kozlov2000; Ollivon et al. Reference Ollivon, Lesieur, Grabielle-Madelmont and Paternostre2000), yielding X:

Other authors use a concentration-based partition coefficient, K C, for membrane/water partitioning analogous to bulk phases (Nernst, Reference Nernst1891):

where v aq and v b denote the partial volumes of the water and membrane phases, respectively. A major problem in using this definition for membrane systems is that there is no homogeneous, isotropic membrane volume in which the solute is free to dissolve. Small solutes partition either into the core of the membrane or into the interfacial or head group region, and surfactants distribute two-dimensionally over the membrane interface. Thus, application of Eq. (7) requires a rather ambiguous assumption regarding the effective membrane volume per lipid; and K C data are meaningless if the membrane volume they are based on is not specified. In most cases, the molar volume of the whole lipid, V L, is used as obtained from the specific volume of the lipid, ∼1 ml g−1, and the formula weight of the dry lipid. With molecular volumes reported by Nagle & Tristam-Nagle (Reference Nagle and Tristram-Nagle2000), one obtains V L=0·76 l mol−1 for POPC, 0·78 l mol−1 for DOPC and 0·66 l mol−1 for DMPC. A lipid filling a cylinder with a cross section of 65 Å2 and a length of 2·5 nm corresponds to V L=0·98 l mol−1.
K C can be converted approximately into K X according to:

with C W=55·5 M. Other definitions of partition coefficients are based on volume fractions or contain specific corrections (Sharp et al. Reference Sharp, Nicholls, Fine and Honig1991).
2.3 Non-ideal mixing
In fact, both the aqueous solution and the membrane mix non-ideally in most cases. For non-ideal mixing, we may generally write:

where f(X) is the activity coefficient and μ0 is the standard chemical potential.
Of course, the polar groups of dry surfactants bind water and hence, surfactants do not mix ideally with water in the strict sense. Nevertheless, surfactant monomers in dilute aqueous solution are described by a pseudo-ideal behaviour with f(X)≈1 (as always for dilute systems) and a constant μS0, aq, but the latter refers to the hypothetic standard state, X S→1, of ‘pure but fully hydrated surfactant’ and includes the free energy of hydration.
For surfactants in bilayers, non-ideal mixing gives rise to composition-dependent K X, indicating that f(X)≠1. Two approaches, empirical [Eq. (10)] or based on a statistical model [Eq. (21)], are possible to derive an expression for f(X).
Empirically, it has been found that the free surfactant concentration C saq is often proportional to the mole ratio of surfactant to lipid in the membrane, R b, so that the mole ratio partition coefficient, K R:

is constant (Schurtenberger et al. Reference Schurtenberger, Mazer and Känzig1985; Almog et al. Reference Almog, Kushnir, Nir and Lichtenberg1986; Almog & Lichtenberg, Reference Almog and Lichtenberg1988; Wenk & Seelig, Reference Wenk and Seelig1997b; Wenk et al. Reference Wenk, Alt, Seelig and Seelig1997; Heerklotz & Seelig, Reference Heerklotz and Seelig2000a; Heerklotz, Reference Heerklotz2001; Heerklotz & Seelig, Reference Heerklotz and Seelig2001; Heerklotz et al. Reference Heerklotz, Szadkowska, Anderson and Seelig2003; see Fig. 2 for a schematic representation). Equations (5)–(6) and (10) yield the conversion rules:

The standard chemical potential difference becomes with Eq. (9):

with the second equality taking into account that the term in the rectangular bracket must be constant, including the case where X Sb→0 and, by definition, f(0)=1.
If K R is a constant, we find with (11) and (12) that

and, because K X(0)=K R·C W:

That means, K X decreases with increasing surfactant content in the membrane:

proportionally to the decreasing probability that a neighbouring molecule of the surfactant is a lipid, X Lb. Apparently, the affinity of the surfactant to the membrane is targeted only at the lipids, whereas a membrane-bound surfactant essentially does not attract another surfactant into the membrane. This is in line with the argument that the membrane loses its stability and is converted to the micellar state when surfactant/surfactant contacts become abundant (Ueno, Reference Ueno1989).
An alternative method of describing non-ideal mixing in bilayers is based on a quantitative model treating non-ideal interactions in the membrane by pair-interaction statistics (Heerklotz et al. Reference Heerklotz, Binder, Lantzsch and Klose1994b; Keller et al. Reference Keller, Kerth and Blume1997), an approach used also in the model of regular solutions (Hildebrand, Reference Hildebrand1929; Guggenheim, Reference Guggenheim1952; Cevc & Marsh, Reference Cevc and Marsh1985). To a first approximation, mixing can be described as the formation of lipid/surfactant (L/S) contacts at the expense of lipid/lipid and surfactant/surfactant contacts:

In case of non-ideal mixing, the mixing process is not only accompanied by the entropy of ideal mixing but also by an additional ‘reaction energy’ which contributes an ‘excess free energy’, g E, to the energy of the mixture. The molar excess free energy, G E, is defined as the difference between the true free energy of the mixture, G(X Sb), and the free energy of an ideally mixing system (the weighted sum of the standard chemical potentials plus the contribution from the entropy of ideal mixing):

That means G E is a measure for the effect of mixing the two components on the free energy of the system. To a first approximation, G E can be related to S/L pair interactions by a non-ideality parameter ρ0

The term X Sb(1−X Sb) corresponds to the probability of S/L contacts in a random mixture, because X Sb is the abundance of surfactant molecules and X Lb=1−X Sb that of lipids. G E vanishes by definition for pure phases, X Sb→0 and→1, and reaches a maximum of ρ0/4 for a 1:1 mixture. Since the chemical potential μS is ∂g/∂n S, the term:

appears as another concentration-dependent contribution to the chemical potential of the surfactant in the bilayer [compare with (1)]:

and the derivation of the partition coefficient leads to (Heerklotz et al. Reference Heerklotz, Binder, Lantzsch and Klose1994b; Keller et al. Reference Keller, Kerth and Blume1997)

Partitioning studies of a series of detergents, C12EOn with n=3–8, into POPC vesicles were evaluated according to this model. Although these detergents have different properties and yield quite different partition coefficients K X(0), they share a common non-ideality parameter, ρ0=−1·7 kJ mol−1=−0·7RT (Heerklotz et al. Reference Heerklotz, Binder, Lantzsch and Klose1994b). A similar behaviour but somewhat larger value was reported for C8Gluc/DMPC (Keller et al. Reference Keller, Kerth and Blume1997).
An extension of the formalism to ternary systems comprising two different lipids, such as Chol and PC (at a mole ratio R Chol/PC), and a surfactant (Tsamaloukas et al. Reference Tsamaloukas, Szadkowska and Heerklotz2006):

comprises non-ideality parameters for all three pair interactions. It allowed for determining the substantially unfavourable pair interaction parameter of TX100 and cholesterol (ρ0Chol/S∼10 kJ mol−1) in POPC–cholesterol membranes at 37°C, whereas TX100 mixes essentially ideally with POPC and ESM at this temperature.
The derivation of Eqs. (18) and (21) follows the statistics of pair interactions in a random mixture as used by the model of regular solutions. However, the model of regular solutions was derived for small ‘hard’ solutes the entropy of which arises exclusively from their mixing with the solvent. Then, the assumption of random mixing implies that there is no excess entropy, S E=0, and the non-ideality is of exclusively enthalpic nature, i.e. G E=H E, and thus  :

compare with Eq. (18). This assumption is not generally fulfilled for lipid/surfactant systems. Direct calorimetric measurements yielded endothermic excess enthalpies with ρH0 increasing continuously with the size of the head group [C12EO5: ρH0=+3·9 kJ mol−1; C12EO6: +4·6 kJ mol−1 (Heerklotz et al. Reference Heerklotz, Binder and Schmiedel1998); C12EO8: +10 kJ mol−1 (Heerklotz et al. Reference Heerklotz, Lantzsch, Binder, Klose and Blume1996)]; in contrast to a virtually constant ρ0=−1·7 kJ mol−1. Since the good fit obtained on the basis of a random mixing suggests that the entropy of mixing of the molecules in the membrane is close to that for ideal mixing, there must be a gain in intra-molecular entropy (e.g. conformational and motional freedom of the acyl chains or ‘bound’ water molecules) favouring 2 S/L contacts compared to 1 L/L+1 S/S contact. This effect increases with increasing head group size and overcompensates the increasingly endothermic H E to the constant, slightly negative G E discussed above.
The energy of a mixture can be described by the sum of pair interactions only to a first approximation (Redlich & Kister, Reference Redlich and Kister1948; Guggenheim, Reference Guggenheim1952). The interaction enthalpies may also show effects of multibody interactions. For example, H E of POPC/C12EO3 (a surfactant forming bilayers at room temperature) could be well described according to (Heerklotz et al. Reference Heerklotz, Binder and Schmiedel1998):

illustrated by the green curve in Fig. 6. The parameters suggest that randomly occurring clusters containing one surfactant and two lipids (LLS) are favoured by ρLLS=−2·3 kJ mol−1, whereas LSS clusters are unfavourable by ρLSS=+1·1 kJ mol−1. Modelling the enthalpies of detergents such as C12EOn with n=5, 6 in the membrane required higher-order terms taking into account cooperative interactions in larger clusters.
Finally, it should be noted that non-ideal, composition-dependent partition coefficients might also arise from composition-dependent changes in membrane structure or substantial interactions between the molecules in the aqueous phase. For C8Gluc, Ueno (Reference Ueno, Hirota, Kashiwagi and Sagasaki2003) explained decreasing values of K X with detergent-induced structural changes of the bilayer phase, such as the conversion of large to small vesicles.
2.4 Electrostatic effects
The effects discussed so far apply to non-ionic lipids and detergents, or to charged compounds after correction for electrostatic effects. If the membrane contains charged lipids or surfactants, it possesses a surface charge density σ:

where e 0 is the elementary charge, and X ib, z i and A i denote the mole fraction, signed charge number and lateral area, respectively, which are summed over all i components (lipids and surfactants).
This charge density gives rise to a surface potential, ψ0, which results in a difference between the local concentration of charged molecules close to the surface, C Saq, surf, and the bulk surfactant concentration, C Saq, bulk as described by Boltzmann's law:

It should be noted that a more complex behaviour is observed if the charge z S changes upon membrane binding due to protonation/deprotonation reactions at the membrane surface (Beschiaschvili & Seelig, Reference Beschiaschvili and Seelig1992; Seelig, Reference Seelig1997). The ratio R b/C Saq, bulk corresponds to an apparent partition coefficient,  , whereas the intrinsic mole ratio partition coefficient is K R0≡R b/C Saq, surf. With (26), one obtains

The exponential term vanishes for uncharged surfactants, z S=0, and for uncharged membranes, ψ0=0. It becomes >1 for electrostatic attraction (z S and ψ0 differ in sign) so that K Rapp>K R0, and <1 for electrostatic repulsion. Since the potential ψ0 depends on the amount of membrane-bound, charged surfactant, is a function of R b. For example, of SDS partitioning into (previously uncharged) POPC vesicles in 110 mm salt decreases from K R0=23 mm−1 at R b→0 and ψ0→0 to ≈2 mm−1 in the range used for typical partitioning measurements and further to about 0·5 mm−1 upon membrane saturation, R b≈0·3 (Tan et al. Reference Tan, Ziegler, Steinbauer and Seelig2002). A model to fit R b(C Saq, bulk) must take into account the unknown surface potential ψ0 (Beschiaschvili & Seelig, Reference Beschiaschvili and Seelig1992; Seelig, Reference Seelig1997; Hildebrand et al. Reference Hildebrand, Neubert, Garidel and Blume2002; Tan et al. Reference Tan, Ziegler, Steinbauer and Seelig2002; Keller et al. Reference Keller, Heerklotz, Jahnke and Blume2006b). This can be achieved by a numerical optimisation of the parameters to fulfill two independent relations between R b and ψ0. One is given by Eq. (27) and a second is derived combining the Gouy–Chapman equation:

with Eq. (25) and replacing X Sb by R b/(1+R b). Note that Eq. (28) sums over all j species of ions in solution, thus taking into account the screening of charges by ions. The symbols ε0 and εr denote the permittivity of vacuum and the dielectric constant, respectively.
For key reviews, see McLaughlin (Reference McLaughlin1989) on electrostatics of membrane binding, Seelig (Reference Seelig1997) for the explicit consideration of electrostatics in evaluating titration calorimetry data and Record et al. (Reference Record, Anderson and Lohman1978) for a comprehensive treatment of all possible salt effects on ‘binding’ equilibria.
2.5 Kinetic aspects
Establishing the partitioning equilibrium after addition of surfactant to the aqueous phase proceeds in three steps with sometimes very different kinetics:
1. Part of the added surfactant inserts into the outer membrane leaflet. This is usually fast for practical purposes, e.g. 50–500 ms for lysolecithin (Elamrani & Blume, Reference Elamrani and Blume1982), ∼100 ms for TX100 (Alonso et al. Reference Alonso, Urbaneja, Goni, Carmona, Cánovas and Gómez-Fernández1987) and 10–30 s for SDS into PC vesicles containing no, 5% of positively or 5% of negatively charged lipids (Cocera et al. Reference Cocera, Lopez, Pons, Amenitsch and De La Maza2004).
2. In a second step, the surfactant has to equilibrate between the outer and inner leaflet of the vesicles (or analogously, cell membrane). To this end, its polar head group has to cross the hydrophobic core by a flip-flop or another mechanism of permeation. C12EO8 (le Maire et al. Reference le Maire, Moller and Champeil1987), C12EO7 (Heerklotz et al. Reference Heerklotz, Binder and Epand1999), Triton X100 (Heerklotz et al. Reference Heerklotz, Szadkowska, Anderson and Seelig2003; Tsamaloukas et al. Reference Tsamaloukas, Szadkowska and Heerklotz2006) and C8Gluc (Wenk et al. Reference Wenk, Alt, Seelig and Seelig1997) equilibrate with both leaflets of the membrane within a time window from milliseconds to some tens of seconds. Surfactants with larger or charged head groups may, however, require hours or days to cross the membrane, as shown for SDS at room temperature (Cocera et al. Reference Cocera, Lopez, Coderch, Parra and de la Maza1999; Keller et al. Reference Keller, Heerklotz and Blume2006a), C12Malt (Kragh-Hansen et al. Reference Kragh-Hansen, le Maire and Moller1998), CnMalt with n=12, 13 and 14 (Heerklotz, Reference Heerklotz2001), C16lyso-PC (Bhamidipati & Hamilton, Reference Bhamidipati and Hamilton1995) and others. Note that weak acids and bases can translocate across membranes via their no-charged form followed by re-establishing the equilibrium on the trans side, an effect that can also be used for active loading of liposomes with drugs driven by a pH gradient (Cullis et al. Reference Cullis, Hope, Bally, Madden, Mayer and Fenske1997). This transport mechanism applies, at least under certain conditions, to fatty acids (half-time for many species was shown to be <1 s), deoxycholate (t½½<1 s) and cholate (∼20 s) but not to their taurine conjugates (t½½ >1 h, pK a∼1) at pH 7·4 (Kamp et al. Reference Kamp, Westerhoff and Hamilton1993). It should, however, be kept in mind that flip-flop is not a property of the surfactant species alone; the dynamics and barrier properties of membranes may depend substantially on lipid composition, surfactant content, membrane curvature, temperature, etc. For example, permeation of SDS through membranes is strongly enhanced by increasing temperature and occurs within some minutes at 65°C (Keller et al. Reference Keller, Heerklotz and Blume2006a).
The surfactant leaving the outer leaflet by flipping to the inner is partially replaced by further uptake from the aqueous phase.
3. In a last step, the inner leaflet equilibrates with the trans aqueous compartment, e.g. the interior of the vesicle. In vesicle systems, the enclosed volume is usually so small that the surfactant fraction in the interior is negligible (Keller et al. Reference Keller, Heerklotz and Blume2006a).
Systems with fast uptake but slow translocation across the bilayer can often be studied and described, approximately, in terms of an equilibrium of the surfactant between aqueous phase and outer lipid monolayer, with the lipid in the inner monolayer being not accessible and disregarded upon data evaluation. Seelig and co-workers (see, e.g. Seelig, Reference Seelig1997) have, to this end, introduced a factor γ which will be referred to here as the accessibility factor (for permeable membranes, γ=1; for impermeable membranes, γ=0·5 for LUV, 0·6 for SUV, ≪0·5 for MLV); it corrects the lipid concentration to represent only the fraction that actually equilibrates with the aqueous phase within the available time. If the inner leaflet contains surfactant as in the release protocol, γ applies also to membrane-bound surfactant (Heerklotz & Seelig, Reference Heerklotz and Seelig2000b; Keller et al. Reference Keller, Heerklotz and Blume2006a; Tsamaloukas et al. Reference Tsamaloukas, Keller and Heerklotz2007). It should, however, be noted that the asymmetric insertion or extraction may in certain cases give rise to bilayer couple effects (see Section 3.1), which change the thermodynamic parameters of binding (Heerklotz, Reference Heerklotz2001).
2.6 Methods for measuring partition coefficients
The most direct method to measure partition coefficients is a macroscopic separation of at least part of the water phase from the mixed vesicles by, e.g. equilibrium dialysis (Kragh-Hansen et al. Reference Kragh-Hansen, le Maire and Moller1998) or centrifugation. Then, the free surfactant concentration must be measured to determine the partition coefficient. This can utilise radio-labelled (le Maire et al. Reference le Maire, Moller and Champeil1987) or fluorescent surfactants, surfactant-selective electrodes (Kadi et al. Reference Kadi, Hansson and Almgren2004) or surface tension measurements (Kaufmann et al. Reference Kaufmann, Engel and Remigy2006).
A very potent technique to study membrane partitioning of solutes is ITC (cf. Heerklotz & Seelig, Reference Heerklotz and Seelig2000b for a review). One major advantage of this method is that it yields not only the partition coefficient but also the enthalpy and entropy of binding by a single, automated run. Different assays to measure uptake (1) or release (2, 3) of surfactant into or from membranes are based on injections:
1. of lipid vesicles into a surfactant solution (uptake protocol, cf. e.g. Seelig & Ganz, Reference Seelig and Ganz1991; Wenk et al. Reference Wenk, Alt, Seelig and Seelig1997 for cumulative model and Heerklotz et al. Reference Heerklotz, Lantzsch, Binder, Klose and Blume1996; Keller et al. Reference Keller, Kerth and Blume1997; Heerklotz & Seelig, Reference Heerklotz and Seelig2000b for differential model);
2. of mixed vesicles into buffer (release protocol) (Heerklotz et al. Reference Heerklotz, Binder and Epand1999; Heerklotz, Reference Heerklotz2001);
3. of buffer into mixed vesicles (Opatowski et al. Reference Opatowski, Kozlov and Lichtenberg1997a); or
4. of mixed vesicles into surfactant solutions (Rowe et al. Reference Rowe, Zhang, Leung, Parr and Guy1998; Tsamaloukas et al. Reference Tsamaloukas, Szadkowska and Heerklotz2006).
The instrument measures the heat associated with surfactant transfer assuming that the lipid is insoluble in the aqueous phase and, thus, not transferred. A combination of uptake and release protocols refines the results and establishes whether the system equilibrates completely during the experiment, thus providing an independent measurement of membrane permeability and accessibility, γ (see previous section). The protocol and fit routine for the ITC-based uptake and release assay are given by Tsamaloukas et al. (Reference Tsamaloukas, Keller and Heerklotz2007) ; the analogous fluorescence spectroscopic assay is described by Keller et al. (Reference Keller, Bothe, Bienert, Dathe and Blume2007). Rowe's protocol (4) allows for a partitioning measurement at specific, defined membrane composition(s).
Another widely used approach is the partitioning assay based on the recognition of at least one characteristic membrane composition, R b*, in samples with different lipid and total surfactant concentrations (Encinas & Lissi, Reference Encinas and Lissi1982). The evaluation uses the relationship:

representing the fact that the total surfactant concentration C S comprises the membrane-bound surfactant, C Sb=R bC L, and the free surfactant, C Saq. Let us consider vesicle suspensions of different lipid concentrations, C L, that share the same R b* as indicated by a characteristic, R b-dependent property or phenomenon (indicated by *) such as a spectroscopic signal of a membrane probe, a certain leakage, etc. A characteristic, constant R b* implies also a constant aqueous concentration C Saq* (determined by the partition coefficient) so that (29) corresponds to a straight line. That means, if the total concentrations leading to this phenomenon, C S*, are plotted versus C L, the corresponding membrane composition R b* and free concentration C Saq* are obtained as the slope and intercept of a linear regression. The partition coefficient at this membrane composition is K R*=R b*/C Saq*. Lichtenberg et al. (Reference Lichtenberg1985) and Schurtenberger et al. (Reference Schurtenberger, Mazer and Känzig1985) established the evaluation of the onset of solubilisation, C Ssat, to determine R bsat, C Saq, sat and K(R bsat) according to (29) as one of the most frequently used approaches in the field. The same approach has been used on the basis of detergent-induced changes in the fluorescence spectra of a membrane probe (Heerklotz et al. Reference Heerklotz, Binder and Lantzsch1994a, Reference Epandb; Paternostre et al. Reference Paternostre, Meyer, Grabielle-Madelmont, Lesieur, Ghanam and Ollivon1995), characteristic degrees of dye efflux from vesicles (de la Maza & Parra, Reference de la Maza and Parra1994b, Reference de la Maza and Parra1997; de la Maza et al. Reference de la Maza, Coderch, Gonzalez and Parra1998a; Heerklotz & Seelig, Reference Heerklotz and Seelig2007) and other parameters.
Surfactants showing a membrane-sensitive, intrinsic fluorescence or those quenching membrane probes (such as SDBS and TX100 quenching anthroyloxy-FA; Marcelino et al. Reference Marcelino, Lima, Reis and Matos2007) can be monitored quantitatively by fluorescence spectroscopy. An estimate of K can also be derived from the ‘melting point depression’ analogously to dilute solutions, but this approach is limited to certain lipids and assumptions (cf. Section 3.4 and Inoue et al. Reference Inoue, Miyakawa and Shimozawa1986).
2.7 Experimental values of partition coefficients
Membrane partitioning and self association of surfactants are both governed by the hydrophobic effect. Therefore, the respective gains in chemical potential differ by

of a few kJ mol−1 only. That implies that

(Heerklotz & Seelig, Reference Heerklotz and Seelig2000a). Data of K R for homologous series (see Fig. 3, left) imply that each methylene group contributes ΔΔμs0, aq→b=−(3·4±0·5) kJ mol−1 CH2 to the chemical potential of membrane partitioning, a value close to −2·8 to −3·1 kJ mol−1 CH2 reported for micelle formation (Israelachvili, Reference Israelachvili1991; Heerklotz & Epand, Reference Heerklotz and Epand2001). The slightly larger incremental value for membranes, if significant at all, could arise from chain length-dependent changes in membrane curvature strain (cf. Section 3.2).
Dependence of membrane/water partition coefficients (cf. Tables 1a–1c, typically for POPC at 25°C) on the length of the alkyl chain (carbon number n C, left panel) and on the length of the EO chain (detergent head group) (right panel). The slopes allow the estimation of group contributions of CH2 and EO groups to the apparent standard free energy of transfer,  .

Let us consider the differences between self association and membrane partitioning that may render K R somewhat different from 1/CMC. Trivially, mixed systems are favoured compared to pure ones by the entropy of mixing; this effect tends to increase K R×CMC.
If surfactant or lipid is charged, electrostatic interactions have a major influence on partitioning, particularly at low salt. Partitioning of charged surfactants into neutral membranes is favoured over self-association by a reduction of unfavourable surfactant–surfactant interactions. Analogously, partitioning of neutral surfactants reduces repulsive interactions in a membrane made of charged lipids. And, of course, surfactant partitioning into membranes of oppositely charged lipid is enhanced. What applies to charges applies similarly, but with weaker influence on K R, also to dipole–dipole interactions. Isolating lipid dipoles with non-dipolar detergents and vice versa as well as inserting detergents with reverse dipole orientations into membranes is favourable.
Another significant difference is that micelles show virtually no curvature strain (see Sections 0 and 0), since they can adapt their size and shape over a wide range of average interfacial curvatures. If already small amounts of a non-ionic surfactant induce curvature strain in a membrane (these were referred to as strong detergents), the strain diminishes K R compared to 1/CMC so that K R×CMC<1 (Heerklotz & Seelig, Reference Heerklotz and Seelig2000a). These surfactants induce also membrane solubilisation at relatively low membrane content [see Eq. (41)]. Other surfactants, however, relax existing strains and favour membrane insertion over self-association, at least at low membrane contents (weak detergents; Heerklotz & Seelig, Reference Heerklotz and Seelig2000a). They require high contents of more than one detergent per lipid in the membrane for solubilisation or form vesicles themselves (and do not solubilise membranes at all). Thermodynamic and structural origins and consequences of curvature strain are discussed below (Sections 3.1 and 3.2). The effect of curvature strain (or ‘effective molecular shape’ or packing parameter) is illustrated by comparing surfactants with different head groups sharing the same hydrophobic part and vice versa (Fig. 3). For example, K R of surfactants C12EOn with n=3–8 decreases by a factor of ≈0·6 per EO group, i.e. the free energy gain is reduced by ≈+1·3 kJ mol−1 EO. The fact that this arises from monolayer curvature strain and not, for example from solubility or hydrophilic–hydrophobic balance changes, is illustrated by the finding that this behaviour is not paralleled by the CMC so that K R×CMC decreases continuously with n. The curvature model also explains that partition coefficients of strong detergents are, as a rule, higher into membranes of more unsaturated (more negative spontaneous curvature) lipids.
Let us compare pure lipid vesicles with biomembranes. Quantifying the partitioning of surfactants into, e.g. erythrocyte membranes requires a somewhat ambiguous definition of the effective lipid concentration of a cell suspension. Binford and Palm (Reference Binford and Palm1994) estimated the phospholipid concentration by a phosphate assay and assumed that the total lipid concentration (including cholesterol and glycolipids) is twice the phospholipid concentration. Pantaler et al. (Reference Pantaler, Kamp and Haest2000) applied K C [cf. Eq. (7)] to surfactant partitioning into erythrocytes, using the cell count of the suspension and a membrane volume of 0·72 μm3 cell−1 (as computed from an area of ∼140 μm2 and a membrane thickness of ∼5 nm). Generally, the resulting partition coefficients seem to be close to those for liquid–crystalline model vesicles (Tables 1a–1c), suggesting that there is no strong interference of the membrane proteins with surfactant uptake into the membrane.
The curvature of the bilayer seems to have only minor effects on the mean partition coefficient of amphiphiles although the thermodynamic effects governing membrane insertion are often substantially different between small and larger vesicles. The enthalpy of insertion of peptides and certain surfactants into small vesicles differs by a large, negative contribution from that obtained upon insertion into large vesicles (Seelig & Ganz, Reference Seelig and Ganz1991). This exothermic contribution is temperature-independent (so that ΔC p is virtually conserved) and almost perfectly compensated by a loss in entropy (so that ΔμS0, aq→b is also essentially unchanged) (Wieprecht et al. Reference Wieprecht, Beyermann and Seelig2002). The interpretation of this finding in terms of improved chain packing in the outer, positively curved lipid leaflet is supported by findings that the enthalpy of partitioning (but hardly ΔμS0, aq→b and ΔC p) depends crucially on chain alignment and ordering and differ, therefore, between bulk hydrocarbon and the core of micelles (Heerklotz & Epand, Reference Heerklotz and Epand2001) or bilayers (Wimley & White, Reference Wimley and White1993).
Lipids in the gel phase usually show a reduced affinity to surfactants. This is observed, for example for Triton partitioning into sphingomyelins and 1,2-dipalmitoyl-sn-glycero-3-phosphocholine (DPPC) (Nyholm & Slotte, Reference Nyholm and Slotte2001; Ollila & Slotte, Reference Ollila and Slotte2002; Arnulphi et al. Reference Arnulphi, Sot, García-Pacios, Arrondo, Alonso and Goñi2007; cf. Tables 1a–1c) or for various lyso-PCs into DPPC (Hoyrup et al. Reference Hoyrup, Davidsen and Jorgensen2001). Given that the approximate validity of the general equation for freezing point depression suggests the detergents to be virtually immiscible with a gel phase (see Section 3.4), one would, however, expect even lower membrane–water partition coefficients below the melting temperature, T m. A possible explanation is that a major part of the detergent sequesters into (and thus expands) relatively fluid defect regions between quasi-crystalline gel clusters rather than inserting into them directly (Patra et al. Reference Patra, Alonso and Goni1998, Reference Patra, Alonso, Arrondo and Goni1999; Sot et al. Reference Sot, Collado, Arrondo, Alonso and Goni2002). Interestingly, a much weaker reduction of K upon freezing is observed for fatty acids (C10 to C16), which seem to fit into the gel lattice and show similar or slightly larger partition coefficients into DPPC at 20°C compared to 50°C (Hoyrup et al. Reference Hoyrup, Davidsen and Jorgensen2001).
The temperature dependence of membrane partitioning can be described analogously to that of other ‘equilibrium constants’, K, in terms of van't Hoff's law:

Membrane insertion, as a process driven by the hydrophobic effect, typically shows a virtually constant, negative heat capacity change. As a consequence, K exhibits a maximum at a characteristic isenthalpic temperature T 0 (there, ΔH=0). Non-ionic surfactants seem to show values of T 0 somewhat above room temperature, so that at room temperature, ΔH Saq→b is endothermic and K(T) increases (e.g. by ≈10–30% per 10 K for ΔH Saq→b≈+10 to +20 kJ mol−1). This is found for C8Gluc partitioning into egg PC, with K R increasing from ≈0·08 mm−1 (5°C) to 0·12 mm−1 (35°C) (da Graca-Miguel et al. Reference da Graca-Miguel, Eidelman, Ollivon and Walter1989). The heat capacity changes of binding and association were empirically related to changes in (apolar and polar) water accessible surface area (ASA) (Spolar et al. Reference Spolar, Ha and Record1989; Baker & Murphy, Reference Baker and Murphy1998), but membrane binding often shows anomalously weak negative (or even positive) ΔC p. This cannot be explained in terms of ASA, but implies effects of lipid chain packing on ΔC p (Rowe et al. Reference Rowe, Zhang, Leung, Parr and Guy1998; Heerklotz & Epand, Reference Heerklotz and Epand2001; Tsamaloukas et al. Reference Tsamaloukas, Szadkowska, Slotte and Heerklotz2005). The T 0 of charged surfactants such as SDS (Tan et al. Reference Tan, Ziegler, Steinbauer and Seelig2002; Keller et al. Reference Keller, Heerklotz and Blume2006a) and cholates (Hildebrand et al. Reference Hildebrand, Beyer, Neubert, Garidel and Blume2003) is below room temperature so that experimental data refer usually to temperatures above T 0. Then, ΔH Saq→b is exothermic and K R decreases with increasing T.
Salt concentrations up to ≈0·1 M seem to have no strong effect on the K R of non-ionic surfactants and on the intrinsic K R0 of charged surfactants. Partition coefficients of detergents C12EOn into POPC vesicles from water (Heerklotz et al. Reference Heerklotz, Binder, Lantzsch and Klose1994b) and from 10 mm Tris (pH 7·4), 100 mm NaCl (Heerklotz & Seelig, Reference Heerklotz and Seelig2000a) show no systematic difference (cf. Table 1a–1c). High concentrations of co-solutes show the typical kosmotropic or chaotropic effect; NaCl and sucrose increase the energy of hydrophobic surfaces exposed to water and promote surfactant incorporation into membranes; urea has the opposite effect (cf. Table 2 for C8Gluc; Walter et al. Reference Walter, Kuehl, Barnes and VanderWaerdt2000). Of course, apparent partition coefficients [cf. Eq. (27)] of charged surfactants are greatly changed by salts (cf. data of Hildebrand et al. Reference Hildebrand, Neubert, Garidel and Blume2002 on cholate; Table 2), an effect that is even more pronounced for divalent ions (such as Ca2+; Almog & Lichtenberg, Reference Almog and Lichtenberg1988).
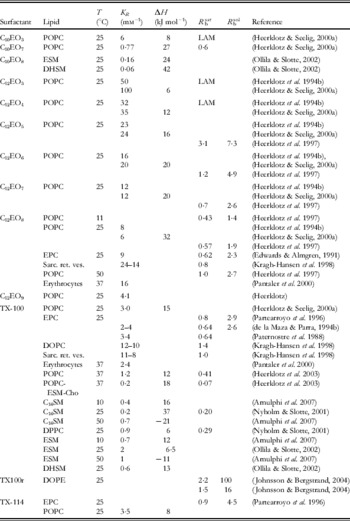
Ethylene oxide detergents
Other nonionic surfactants
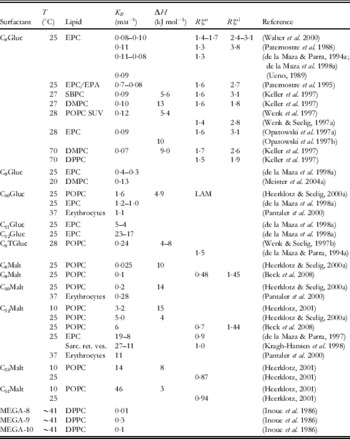
Zwitterionic surfactants

For T-dependent CMC data of short-chain and lysolipids, cf. also Heerklotz & Epand (Reference Heerklotz and Epand2001).
Properties of charged surfactants and salt effects on C8Gluc

Rounded partition coefficients were obtained from references directly, by conversion of published values of K X or K C (in some cases, the corresponding R b and v L required for conversion into K R had to be estimated) or on the basis of pairs of R b and C Sw according to (10). Please refer to original literature for detailed values and conditions and for information on additional systems.
Meister et al. (Reference Meister, Kerth and Blume2004a, Reference Meister, Kerth and Blumeb) have measured the partition coefficients of detergents into a lipid monolayer on the air/water interface by infrared reflection absorption spectroscopy; the results at the ‘bilayer–monolayer equivalence pressure’ of ∼32×10−3 N m−1 agreed with those for vesicles.
Finally, it should be noted that many commercial surfactant brands (Triton, Lubrol, Tween, etc.) are, in fact, mixtures of surfactants with similar chemical structures. The apparent K R of such a mixture may depend, in fundamental contrast to that for a pure system, strongly on lipid concentration (see Beck et al. Reference Beck, Tsamaloukas, Jurcevic and Heerklotz2008).
3. Surfactant-induced changes in membrane properties
3.1 Bilayer couple concept of asymmetric bilayer expansion
Surfactants that insert, after addition to the external aqueous phase, quickly into the outer membrane monolayer but do not translocate to the inner monolayer (see Section 2.5) expand the bilayer asymmetrically. Sheetz and Singer (Reference Sheetz and Singer1974) compared this case to a bimetallic couple which tends to bend if the two leaflets expand differently (bilayer couple concept). Such effects may contribute to shape changes of vesicles (Mui et al. Reference Mui, Dobereiner, Madden and Cullis1995) and erythrocytes as well as budding, ex- and invaginations, and endo- and exocytosis (see Section 5.1). If the bilayer is unable to bend to assume its spontaneous bilayer curvature, it develops a bilayer curvature strain by compressing the molecules in the overpopulated leaflet and/or expanding those in the underpopulated leaflet (Fig. 4). As a result, the partition coefficient from water into the overpopulated side of the vesicle (outside upon addition of surfactant to the suspension) decreases, whereas that into the under populated leaflet (outside upon surfactant extraction from pre-equilibrated vesicles) increases; the enthalpy of transfer depends also on the leaflet (Heerklotz, Reference Heerklotz2001). At a threshold value, bilayer curvature strain may also induce the transient rupture of the bilayer which anneals after translocation of some molecules to the underpopulated side (Heerklotz, Reference Heerklotz2001); see Section 3.6 on membrane leakage.
Schematic representation of the bilayer couple concept. Insertion of molecules into a bilayer leads to an imbalance in area requirement between the two coupled lipid leaflets. If this cannot be relaxed via flip-flop of the molecules between the leaflets, it gives rise to a spontaneous bilayer curvature. In turn, the bilayer tends to bend locally (budding, shape transformations) and/or it develops a bilayer curvature strain which causes disorder (particularly in the low-pressure leaflet) and stores elastic energy.

It should be noted that, in contrast to the bilayer couple effect, membrane permeant molecules can reduce the bending stiffness by moving to the stretched leaflet of a bent membrane.
3.2 Monolayer curvature strain
The previous section discussed that an imbalance between the optimum surface areas of the outer and the inner monolayer of a bilayer vesicle give rise to a bilayer curvature strain. The analogous effect occurs additionally within each monolayer.
In a relaxed, planar monolayer, the chains have to fill the volume determined by the lateral area needed by the head group and the thickness of the hydrophobic core. If the head group of a surfactant is too large or its hydrophobic part too small to fulfill this criterion, the ideal structure of the monolayer would be to assume a certain, convex (positive), so-called spontaneous or intrinsic curvature. However, this is impossible if the monolayer is part of a bilayer and competes with the opposite spontaneous curvature of the other leaflet (Fig. 5), because both are coupled with each other. Instead, the monolayers are ‘bent straight’ by an elastic deformation giving rise to a monolayer curvature strain (Andelman et al. Reference Andelman, Kozlov and Helfrich1994; Epand & Epand, Reference Epand and Epand1994).
Schematic representation of monolayer curvature effects. A relaxed lamellar packing requires that the hydrophobic part of the molecule fills the space that is determined by the area requirement of the head group and the thickness of the hydrophobic core. If the hydrophobic part is too small, the monolayer tends to bend outward (positive spontaneous curvature). Because such bending is incompatible with the other leaflet, it is compensated for by a disordering of the core, accompanied by a shrinking of its thickness.

Curvature strain can also be seen as the first moment of the lateral pressure profile of a membrane leaflet (Cantor, Reference Cantor1999; Van Den Brink-Van Der Laan et al. Reference Van Den Brink-Van Der Laan, Antoinette Killian and De Kruijff2004).
It should be noted that the optimum lateral area of a head group depends not only on the molecular dimensions but also on order and mobility of moieties, hydration, hydrogen bonds, dipole- and electrostatic interactions. As a consequence, mixtures do not necessarily exhibit the average spontaneous curvature of their components. This is impressively illustrated by the fact that a mixture of anionic and cationic, micelle-forming surfactants can adopt a lamellar structure since head groups with different charge pack much closer together than equally charged ones in separate micelles (Meagher & Hatton, Reference Meagher and Hatton1998). Equimolar mixtures of lysolipids and fatty acids (both micelle forming) can also form lamellar structures (Lemmich et al. Reference Lemmich, Richter and Callisen1998).
The major structural consequence of the curvature strain is a disordering of the chains. In turn, the membrane becomes thinner and more flexible. This is seen via deuterium NMR (Goni et al. Reference Goni, Urbaneja, Arrondo, Alonso, Durrani and Chapman1986; Thurmond et al. Reference Thurmond, Otten, Brown and Beyer1994; Konig et al. Reference Konig, Dietrich and Klose1997; Wenk et al. Reference Wenk, Alt, Seelig and Seelig1997; Heerklotz et al. Reference Heerklotz, Wieprecht and Seelig2004b), NMR relaxation studies (Otten et al. Reference Otten, Brown and Beyer2000), infrared spectroscopy (Goni et al. Reference Goni, Urbaneja, Arrondo, Alonso, Durrani and Chapman1986; Binder & Klose, Reference Binder and Klose2002; Meister & Blume, Reference Meister and Blume2004), fluorescence spectroscopy (Lasch et al. Reference Lasch, Hoffmann, Omelyanenko, Klibanov, Torchilin, Binder and Gawrisch1990; Yegutkin, Reference Yegutkin1997), electron spin resonance (ESR) (Gallova et al. Reference Gallova, Devinsky and Balgavy1990), X-ray and neutron diffraction (Klose et al. Reference Klose, Islamov, Konig and Cherezov1996). The area per lipid increases. Data published by Karlovska et al. (Reference Karlovska, Lohner, Degovics, Lacko, Devinsky and Balgavy2004) suggest that addition of, e.g. 10 mol% of CnNO to EYPC increases the area per lipid by ∼4% (n=18) up to ∼6% (n=8).
Chain disordering is accompanied by changes in the interfacial and head group region of the membrane. These lead to spectral changes of probes (Gonzales-Manas et al. Reference Gonzales-Manas, Kaschny and Goni1994; Heerklotz et al. Reference Heerklotz, Binder, Lantzsch and Klose1994b) and tryptophan (Valpuesta et al. Reference Valpuesta, Arrondo, Barbero, Pons and Goni1986) and altered affinity to 1-anilinonaphthalene-8-sulfonic acid binding (Alonso et al. Reference Alonso, Saez and Goni1982; Lasch et al. Reference Lasch, Hoffmann, Omelyanenko, Klibanov, Torchilin, Binder and Gawrisch1990). Strong detergents may also change the average orientation of the lipid head group to a slightly more ‘upright’ position (reducing the surface area requirement) (Otten et al. Reference Otten, Lobbecke and Beyer1995; Heerklotz et al. Reference Heerklotz, Wieprecht and Seelig2004b) but no such effect was observed for C8Gluc, a weak detergent (Wenk et al. Reference Wenk, Alt, Seelig and Seelig1997; Heerklotz et al. Reference Heerklotz, Wieprecht and Seelig2004b). The lateral area expansion of the membrane by detergents could be quantified by fluorescence resonance energy transfer (FRET) measurements (Lantzsch et al. Reference Lantzsch, Binder, Heerklotz, Wendling and Klose1996).
Surfactants with a positive spontaneous curvature tend to be enriched in membrane environments with positive real curvature, for example in the outer leaflet of small unilamellar vesicles (enrichment of 3:1 for lyso-PC; Bhamidipati & Hamilton, Reference Bhamidipati and Hamilton1995) or at the caps or the equator of prolate or oblate ellipsoid-shaped vesicles, respectively. This reduces the bending modulus of the membrane, can induce local shape changes that cannot be explained by bilayer couple effects (Hagerstrand et al. Reference Hagerstrand, Kralj-Iglic, Fosnaric, Bobrowska-Hagerstrand, Wrobel, Mrowczynska, Soderstrom and Iglic2004) and can contribute to the formation of ultra-flexible liposomes (see applications discussed in Section 5.2).
Thermodynamically, monolayer curvature strain is governed by strong enthalpy–entropy compensation. The disturbance of intra- and intermolecular interactions causes a considerable endothermic excess enthalpy, H E, but, at the same time, a gain in entropy due to increased motional and conformational freedom of the groups and molecules (Heerklotz et al. Reference Heerklotz, Binder and Schmiedel1998). Figure 6 shows the excess enthalpies of surfactants C12EOn and POPC, respectively, in the mixed membrane (i.e. sublytic) range (except for the dotted curve illustrating the effect of solubilisation). The excess enthalpies at a given X e are the more positive the larger n becomes, i.e. the more positive the spontaneous curvature of the surfactant.
Excess enthalpy functions of systems of POPC with detergents C12EOn (n as indicated in the plot) at 25°C. Bold solid lines correspond to exclusively lamellar phase ranges (i.e. the curves end at X bsat, in this range, X e=X Sb), the dotted line illustrates the typical behaviour of H E(X e) in the coexistence and micellar phase ranges. The plot is compiled on the basis of data reported by Heerklotz et al. (Reference Heerklotz, Binder, Lantzsch, Klose and Blume1997, Reference Heerklotz, Binder and Schmiedel1998). See discussion in Sections 3.2 and 4.3.

As outlined in Section 2.7, the free energy of curvature strain was discussed as the major reason rendering the product of K R×CMC of non-ionic systems below 1. The lower this product, the stronger the membrane strains induced by a non-ionic surfactant appear to be (Heerklotz & Seelig, Reference Heerklotz and Seelig2000a).
The intrinsic curvature of molecules is determined from lattice parameters of curvature-relaxed inverse hexagonal and other non-lamellar phases (Rand et al. Reference Rand, Fuller and Chen1998; Fuller & Rand, Reference Fuller and Rand2001). When it comes to curvature strain in a mixed membrane, it must, however, be kept in mind that the intrinsic curvature of a mixture is not necessarily the average of those of its components (cf. above). Other parameters that are related to the effect of membrane additives on monolayer curvature strain are shifts in the lamellar-to-inverse hexagonal transition temperature of a suitable lipid (e.g. POPE or DiPoPE) (Epand et al. Reference Epand, Epand and Lancaster1988; Matsuzaki et al. Reference Matsuzaki, Sugishita, Ishibe, Ueha, Nakata, Miyajima and Epand1998), the critical composition for the onset of solubilisation (R bsat) (Andelman et al. Reference Andelman, Kozlov and Helfrich1994) and changes in membrane area and thickness (Lantzsch et al. Reference Lantzsch, Binder, Heerklotz, Wendling and Klose1996).
3.3 Surfactants forming complexes and mixing favourably with lipids
There are various effects by which surfactants may interact favourably with membrane lipids, such as the relaxation of a pre-existing curvature strain, direct interactions by hydrogen bonds or water bridges, electrostatic or dipole interactions. Mixtures of C12EO3 with fluid POPC show an exothermic enthalpy of mixing, H E at low X Sb (Heerklotz et al. Reference Heerklotz, Binder and Schmiedel1998) (see Fig. 6). The composition dependence, H E(X Sb), implies exothermic multibody interactions in statistically occurring arrangements of one lipid with two detergents in a largely random mixture [see Eq. (24)]. This enthalpic interaction, however, is largely compensated by an accompanying loss of entropy so that the free energy of formation of the arrangement is small compared to thermal energy. Similar effects but weaker and requiring larger multibodies were also found for C12EOn with n=4–6. A detailed MD study of a POPC/C12EO4 mixture (Schneider & Feller, Reference Schneider and Feller2001) revealed, in agreement with experimental data (Volke & Pampel, Reference Volke and Pampel1995; Klose et al. Reference Klose, Madler, Schafer and Schneider1999) and Monte Carlo simulations (Klose & Levine, Reference Klose and Levine2000), that the detergent is ordered upon insertion into the bilayer, the membrane becomes more densely packed and the lipid head group is gradually dehydrated. Both the chain length mismatch and the effective size of the head group are reduced. This means that there is a specific, well detectable interaction, but it does not seem to be appropriate to refer to it as a complex since its stability is marginal.
If inserted into a gel phase of DMPC or DPPC, C12EO4 and C12EO5 can form compound complexes with the lipid as implied by its phase behaviour (Madler et al. Reference Madler, Klose, Mops, Richter and Tschierske1994, Reference Madler, Binder and Klose1998; Pfeiffer et al. Reference Pfeiffer, Klose, Heremans and Glorieux2006). A de-mixing in the gel phase is also indicated by the splitting of DSC peaks of ESM mixed with TX100, C10EO8 and deoxycholate into a peak at ∼T m of the lipid and a second peak at ∼3–8 K lower temperature (Ollila & Slotte, Reference Ollila and Slotte2002). The cubic and inverse hexagonal phase-forming surfactant C12EO2 (Funari et al. Reference Funari, Madler and Rapp1996) can stabilise the lipid gel phase (Binder & Klose, Reference Binder and Klose2002), fatty acids with saturated chains form complexes with lipids in the gel phase and increase the melting temperature (Inoue et al. Reference Inoue, Yanagihara, Misono and Suzuki2001). Some of these effects show some resemblance to the interactions of cholesterol with lipid membranes.
3.4 Surfactant-induced ‘melting’ of gel and ℓo phases
Most surfactants tend to shift the gel-to-liquid crystalline ‘melting’ transition temperature of lipids to lower values (Goni et al. Reference Goni, Urbaneja, Arrondo, Alonso, Durrani and Chapman1986), i.e. their addition to a gel membrane may ‘melt’ lipids (depending on concentration and temperature). Interestingly, this effect is (in contrast to many others) not proportional to the spontaneous curvature. Instead, the interaction of surfactants with gel and liquid ordered (ℓo) phases (Ipsen et al. Reference Ipsen, Karlstrom, Mouritsen, Wennerstrom and Zuckermann1987, Reference Ipsen, Mouritsen and Zuckermann1989) is widely governed by the very weak miscibility of surfactants with the tightly packed, ordered phase. The presence of the surfactant renders a phase more favourable for the lipid because it reduces its activity, approximately expressed by the mole fraction X L, and hence its chemical potential, μL=μL0+RTlnX L, in this phase. This is equivalent with the statement that the addition of surfactant stabilises a membrane phase by RTlnX L due to the entropy of mixing. Hence, preferential insertion into the fluid phase shifts the gel–fluid equilibrium in favour of the fluid phase. The effect of a certain preference of a surfactant for the fluid over an ordered phase was modelled by Keller et al. (Reference Keller, Tsamaloukas and Heerklotz2005b). In the extreme case, when the detergent mixes ideally with the fluid phase but is completely excluded from the gel, the T m shift would be described by the general equation for the freezing point depression (Inoue et al. Reference Inoue, Miyakawa and Shimozawa1986):

Equation (33) implies that the shift in the melting temperature, T m, is independent of the specific properties of the surfactant (as long as the ΔH of melting is not strongly affected) and proportional to its mole fraction in the membrane, X Sb, with a proportionality constant corresponding to ∼−24 K (i.e. 10 mol% of surfactant decrease T m by 2·4 K) for DPPC (ΔH=34 kJ mol−1, T m∼314 K) and ∼−33 K for DMPC (ΔH=25 kJ mol−1, T m∼297 K).
This is essentially in line with experimental data on DMPC–C12EO4 (Madler et al. Reference Madler, Binder and Klose1998), DPPC–C12EO5 and DMPC–C12EO5 (Pfeiffer et al. Reference Pfeiffer, Klose, Heremans and Glorieux2006) and DPPC–C12Gluc (Carion-Taravella et al. Reference Carion-Taravella, Lesieur, Chopineau, Lesieur and Ollivon2002). For DPPC–C12Malt (Carion-Taravella et al. Reference Carion-Taravella, Lesieur, Chopineau, Lesieur and Ollivon2002) and DPPC–C12EO4 (Madler et al. Reference Madler, Klose, Mops, Richter and Tschierske1994), the range of surfactant-induced melting is limited by gel phase complexes/demixing and peritectics and the initial slope dT m/dX Sb seems slightly less steep.
The range of linear T m shifts with increasing X Sb is typically limited by the occurrence of eutectic or peritectic points and, finally, membrane solubilisation at higher X Sb (cf. also Fig. 7). However, the minimum T m (at any X Sb) seems to increase with increasing spontaneous curvature of the detergent, reflecting the lower capacity of stronger perturbants to be incorporated. For DPPC (T m corresponds to 41°C), it reaches down to below 25°C for the lamellar phase-forming C12Gluc (Carion-Taravella et al. Reference Carion-Taravella, Lesieur, Chopineau, Lesieur and Ollivon2002), ∼25°C for C12EO5 (Madler et al. Reference Madler, Binder and Klose1998) and to ∼29°C for C10EO5, to ∼35°C for C10EO6 (Inoue et al. Reference Inoue, Motoyama, Totoki, Miyakawa and Shimozawa1994b) and C12Malt (Carion-Taravella et al. Reference Carion-Taravella, Lesieur, Chopineau, Lesieur and Ollivon2002), and 38°C for C10EO7 (Inoue et al. Reference Inoue, Motoyama, Totoki, Miyakawa and Shimozawa1994b).
Pseudo-binary phase diagram of DPPC–C12EO5 reported by Pfeiffer et al. (Reference Pfeiffer, Klose, Heremans and Glorieux2006) and reproduced with permission, copyright Elsevier (2006). It comprises the following phases: liquid–crystalline (Lα), different, not fully characterised gel phases (Gel, Lβ), gel complex (V), ripple (Pβ′), micellar (L1) and micellar ‘clouded’ (L1+W) and a eutectic (E) and a peritectic (P) point.

As discussed above, even low amounts of perturbants in a gel phase may be sequestered from ordered clusters into lattice defects surrounding them, as shown for pyrene by Galla and Sackmann (Reference Galla and Sackmann1974) and discussed also for surfactants (Inoue et al. Reference Inoue, Kawamura, Okukado and Shimozawa1994a; Arnulphi et al. Reference Arnulphi, Sot, García-Pacios, Arrondo, Alonso and Goñi2007). The partitioning of lipids into the fluid clusters may play a role in kinetic and mechanistic aspects of surfactant-induced melting. Ultrasonic measurements have shown that the addition of C12EO5 increased the relaxation time of the melting transition of DPPC (Pfeiffer et al. Reference Pfeiffer, Klose, Heremans and Glorieux2006).
3.5 Detergent-induced formation or promotion of ℓo domains
Taking into account the phenomenon of surfactant-induced melting as discussed in the previous section, it may be surprising that the phase behaviour of a so-called ‘lipid raft’ mixture (POPC/ESM/Chol 1:1:1 mol with varying concentrations of TX100) implied that the addition of TX100 promotes ordered domains rather than dissolving them (Heerklotz, Reference Heerklotz2002) (see Fig. 8).
Pseudo-binary phase diagram of a lipid mixture capable of forming a ℓo phase, POPC–ESM–Chol (ratio fixed at 1:1:1 mol) interacting with TX100. With increasing mole fraction of TX100, X TX (∼X TXb in this case) and decreasing temperature, the system forms fluid, ordered and micellar phases. The range shaded in grey was not investigated. Plotted based on data from Heerklotz (Reference Heerklotz2002).
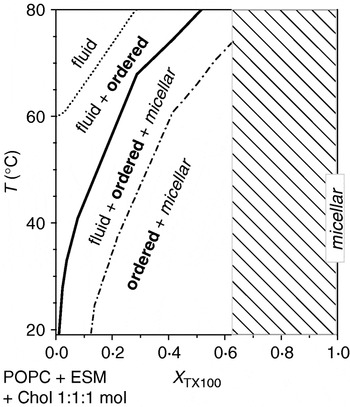
Thermodynamic equilibrium simulations revealed that the induction of ordered domains by a membrane-disordering surfactant requires a mixture of two or more lipids and a non-ideal, unfavourable interaction of the surfactant with one of these lipids (Keller et al. Reference Keller, Tsamaloukas and Heerklotz2005b). Measurements of such pair-interaction energies in the quaternary system have indeed revealed a strong ‘repulsive’ interaction between TX100 and Chol in fluid membranes (Tsamaloukas et al. Reference Tsamaloukas, Szadkowska and Heerklotz2006) (and a favourable interaction between ESM and Chol). If the free energy penalty from Chol–TX100 contacts in a mixed fluid phase overcompensates for the effect of the entropy of mixing, the system tends to avoid these contacts by partially separating Chol (along with ESM) and TX100 (along with POPC) into different domains.
This concept of detergent-induced domain formation is similar to the promotion of ordered domains by addition of highly flexible lipids with highly unsaturated chains (Wassall et al. Reference Wassall, Brzustowicz, Shaikh, Cherezov, Caffrey and Stillwell2004; Bakht et al. Reference Bakht, Pathak and London2007).
Nicolini et al. (Reference Nicolini, Thiyagarajan and Winter2004) concluded from SANS experiments that TX100 reduces the abundance of small domains in a POPC/SM/Chol (1:1:1 mol) mixture; this finding alone could be explained either by a growth or coalescence of small (ordered) domains or by their disintegration. Garner et al. (Reference Garner, Smith and Hooper2008) (see their Fig. S4, supplement) showed via atomic force microscopy that different detergents differ in their suitability to selectively solubilise ℓd domains in supported bilayers with pre-formed domains. Starting, however, with a homogeneous ℓd lipid mixture, the addition of Triton was monitored to induce the formation of ℓo domains prior to selective solubilisation of the ℓd phase. Detergent-induced domain formation was also detected in vivo (van Rheenen et al. Reference van Rheenen, Mulugeta Achame, Janssen, Calafat and Jalink2005). These findings challenge the assumption that DRM fractions resemble in vivo membrane domains (rafts); see Section 5.4.
3.6 Membrane permeabilisation
Surfactants may enhance the flip-flop of lipids and amphiphilic compounds and the passive diffusion of solutes across the membrane. Pantaler et al. (Reference Pantaler, Kamp and Haest2000) studied the surfactant-induced flip-flop of a NBD-labelled lipid across erythrocyte membranes and observed that strong detergents undergoing a fast flip-flop themselves (such as Triton or C12EO8) are most active, reaching, e.g. a lipid flip rate of 0·002 min−1 at R b≈0·01. The same effect seems to require larger amounts of weak detergents (e.g. R b≈0·2 for C12Gluc, 0·1 for C12EO3) or detergents with a slow flip-flop (e.g. R b≈0·07–0·3 for C12Malt, C12TAB, SDS and C11FA). Demina et al. (Reference Demina, Grozdova, Krylova, Zhirnov, Istratov, Frey, Kautz and Melik-Nubarov2005) measured a relative increase of the flip rates of NBD-PE proportional to the concentration of Brij30 (main component C12EO4) with a slope of 0·01 μM−1. Hagerstrand et al. (Reference Hagerstrand, Holmstrom, Bobrowska-Hagerstrand, Eriksson and Isomaa1998) studied the effect of surfactants of different charge on the translocation of PS across erythrocyte membranes by monitoring FITC–annexin V binding. Surfactants may enhance both flip-flop and passive diffusion by chain disordering (increasing diffusion and possibly partition coefficients) and membrane thinning.
At higher concentration, surfactants may induce membrane leakage. This is usually detected by entrapping water-soluble probes of a certain size within vesicles, where their fluorescence is quenched (Ruiz et al. Reference Ruiz, Goni and Alonso1988). Examples for self-quenching probes are carboxyfluorescein (CF) (de la Maza & Parra, Reference de la Maza and Parra1994b), calcein (Wieprecht et al. Reference Wieprecht, Beyermann and Seelig1999) and fluorescent dextran (Ladokhin & White, Reference Ladokhin and White2001), and a frequently used dye-quencher pair is ANTS–DPX (Duzgunes et al. Reference Duzgunes, Straubinger, Baldwin, Friend and Papahadjopoulos1985; Ladokhin et al. Reference Ladokhin, Wimley and White1995). Probe molecules that can pass through the membrane via a leak are greatly diluted in the solution outside the vesicle and show fluorescence. Leakage is easily detected but the fluorescence intensity is not proportional to the released fraction of dye and a detailed quantitative evaluation is not trivial (Ladokhin et al. Reference Ladokhin, Wimley and White1995). An alternative approach has been described entrapping solid particles of γ-Fe2O3 with a size of 8 nm within vesicles (Lesieur et al. Reference Lesieur, Grabielle-Madelmont, Menager, Cabuil, Dadhi, Pierrot and Edwards2003). The entrapped iron particles are visible on cryo-TEM pictures. The results of leakage experiments are best expressed in terms of the partition coefficient of the surfactant and the surfactant content in the membrane, e.g. R b, causing a certain percentage of de-quenching after a certain time (or a characteristic rate by which dequenching increases); such results require considering data collected at varying lipid concentration, C L (e.g. de la Maza et al. Reference de la Maza, Coderch, Gonzalez and Parra1998a; Heerklotz & Seelig, Reference Heerklotz and Seelig2007). Results obtained at a single C L are valid only at this C L.
Surfactants can increase the membrane permeability to aqueous solutes by a variety of mechanisms. Bilayer curvature strain caused by asymmetric insertion of, e.g. surfactants or peptides into a bilayer (cf. Section 3.1) may lead to mechanical failure of the membrane, allowing for the relaxation of the imbalance followed by the annealing of the membrane. This is a possible explanation for transient leakage that stops after reaching a characteristic, partial release of entrapped dye; see Lesieur et al. (Reference Lesieur, Grabielle-Madelmont, Menager, Cabuil, Dadhi, Pierrot and Edwards2003) and Heerklotz & Seelig (Reference Heerklotz and Seelig2007) and peptide studies discussed in Section 5.1.
Monolayer curvature strain is another possible reason for membrane leakage, since it can be partially relaxed by the sequestering of surfactants into highly curved rims covering the hydrophobic edges of toroidal pores or leaks (cf. Fig. 9). Karatekin et al. (Reference Karatekin, Sandre and Brochard-Wyart2003) measured line tensions of tension-induced pores in giant liposomes in viscous medium; 0·6 mm of Tween reduced the line tension along pore edges in DOPC from 8 to 0·2 pN, giving rise to long lifetimes of the pores. The same effect may account for the observation that non-cytotoxic concentrations of C12EO8 render cell membranes more sensitive to electroporation (Kanduser et al. Reference Kanduser, Fosnaric, Sentjurc, Kralj-Iglic, Hagerstrand, Iglic and Miklavcic2003). Above critical surfactant content, leaks appear spontaneously so that de-quenching tends toward 100% after a sufficient period.
Schematic representation of a toroidal membrane pore induced by a surfactant. The hydrophobic edges of the pore are covered with a highly curved, surfactant-rich rim.

The size of the pores as illustrated by Fig. 9 must be considered to depend on concentration of the surfactant, the spontaneous curvatures of the molecules and the bending and splay elasticity of the membrane. Note that the molecules in the pore experience a positive curvature in one dimension (normal to the membrane) but a negative one in the other (top view of the pore). The threshold concentration of forming such pores is thus expected to correspond to their minimum size, which might account for channel-like quantisation of the conductivity and a selectivity regarding the size of permeants. Hence, such findings alone should not be interpreted as compelling evidence of the formation of specific channel-forming oligomers (see Section 5.1). Whether these pores increase in size or in number with increasing surfactant concentration should depend on the interplay between line tension and mixing entropy. A growth in pore size may give rise to cup-shaped vesicles (Saitoh et al. Reference Saitoh, Takiguchi, Tanaka and Hotani1998) or even essentially flat bilayer sheets (see also next section).
Octyl glucoside (C8Gluc) induces a strong increase in membrane permeability for chloride above R b⩾0·4, which is explained in terms of locally destabilising detergent-detergent contacts in the membrane that become abundant at this concentration (Ueno, Reference Ueno1989). The detergent-per-lipid mole ratio in the membrane giving rise to 50% dequenching of entrapped carboxyfluorescein after 30 min is R b(50% CF)≈1·0 for C8- and C10Gluc (de la Maza et al. Reference de la Maza, Coderch, Gonzalez and Parra1998a). Strongly curvature-active detergents are far more active in membrane permeabilisation. C12EO8 and TX100 cause a practically instantaneous, complete leakage of EPC vesicles at R b≈0·4; smaller detergent concentrations cause leakage at slower, measurable rates (Edwards & Almgren, Reference Edwards and Almgren1990) for TX100, R b(50% CF)≈0·15 (de la Maza & Parra, Reference de la Maza and Parra1994b). The permeabilisation of vesicles of stratum corneum lipids by SDS decreases continuously with increasing ceramide concentration from R b(50% CF)≈0·1 (30% ceramide) to ≈0·4 (50%) (Cocera et al. Reference Cocera, Lopez, Coderch, Parra and de la Maza1999). Permeabilisation of EYPC vesicles by C12Malt requires R b(50% CF)≈0·53, showing slower and more complex kinetics since this detergent shows a slow flip-flop across the membrane (de la Maza & Parra, Reference de la Maza and Parra1997).
The permeabilising activity of certain antimicrobial peptides (Prenner et al. Reference Prenner, Lewis, Jelokhani-Niaraki, Hodges and McElhaney2001) and surfactants (e.g. SDS; Apel-Paz et al. Reference Apel-Paz, Doncel and Vanderlick2005) is reduced or inhibited by cholesterol. Cholesterol acts both by reducing the partition coefficient and by mechanically stabilising the membrane, thus increasing the R b causing a certain leakage signal (Cocera et al. Reference Cocera, Lopez, Coderch, Parra and De La Maza2003). Vesicles in the ℓo phase are more resistant against permeabilisation by Triton but not by C8Gluc (Tamba et al. Reference Tamba, Tanaka, Yahagi, Yamashita and Yamazaki2004), a fact that is in line with the resistance of membrane fragments against solubilisation by TX100 but not C8Gluc (see Section 5.4).
4. Solubilisation, reconstitution, non-lamellar phases
4.1 The three-stage model
An excellent, still almost generally used description of membrane solubilisation is the ‘three-stage model’ proposed by Helenius and Simons (Reference Helenius and Simons1975) in their legendary review. They denote stage I as ‘detergent binding’; micelles dissolve and surfactants partition into the membrane. Stage II is ‘lamellar–micellar phase transition’; it starts when the membrane is saturated with surfactant and lipid-saturated micelles appear in coexistence. In stage II, only the proportions between lamellae and micelles change but their internal compositions (e.g. expressed as the surfactant-to-lipid mole ratios R bsat and R msol, respectively) are constant. When only micelles are left, the system enters stage III, denoted ‘size decrease of mixed micelles’. In this stage, no lamellar structures are left and the size of the mixed micelles decreases, typically with decreasing relative lipid content.
Hence, the three-stage model explicitly distinguishes three characteristic types of aggregates, lamellar, large micellar and small micellar, plus surfactant monomers in solution. The transition from lamellar structures to large micelles often resembles, to a good approximation, a first-order phase transition as indicated by the coexistence of lamellae and micelles of fixed composition (Section 4.3). The discussion of structural pathways given below (Section 4.2), however, will show that such a pseudo-phase may comprise a number of structurally diverse yet thermodynamically similar types of aggregates or local molecular arrangements.
The transition from large (typically cylindrical, see Section 4.2) to small spherical micelles may, in general, also involve a coexistence but it cannot usually be described reasonably well as a true phase transition (see Section 4.11).
4.2 Aggregate structures observed upon solubilisation and reconstitution of fluid membranes
The fact that the three-stage model distinguishes between three characteristic states does not rule out that each of these ‘states’ may comprise a variety of specific local and principal structures and does not provide a specific description of intermediates or kinetic pathways. Let us discuss three pathways that show some similarity but differ from each other in some respects.
(i) Coexistence of extended lamellae and cylindrical micelles. One solubilisation pathway describes the solubilisation to cylindrical micelles involving a series of stages and possible intermediate structures encountered with increasing surfactant concentration as explained in the following (cf. Fig. 10). At low concentrations, the surfactant molecules partition between the vesicles and the aqueous phase. They perturb membrane packing gradually and may lead to a growth of small vesicles to sizes of the order of 100 nm. At higher concentrations, the surfactant starts to form membrane leaks or pores by stabilising the hydrophobic edges with a surfactant-rich rim (cf. Fig. 9). These pores may grow in size and/or number with increasing R b and lead to open, cup-shaped vesicles or quasi-planar bilayer sheets. When the membrane is saturated with surfactant (R b=R bsat), long, flexible cylindrical micelles (also referred to as worm-, rod- or thread-like) appear in coexistence. The proportion of the lamellar structures decreases until only cylindrical micelles are left. With increasing surfactant concentration, these decrease in length and are ultimately transformed into spherical micelles. Comparing this sequence with the three-stage model, lamellar sheets seem to still belong to stage 1 (although their edges may also show some micelle-like properties) and the ‘large micelles’ are cylindrical.
Cryo-TEM images of mixtures of sodium cholate and EPC with increasing R e from left to right. Adapted from Walter et al. (Reference Walter, Vinson, Kaplun and Talmon1991), courtesy of the American Biophysical Society.

This solubilisation scenario via cylindrical micelles applies to cholate (Walter et al. Reference Walter, Vinson, Kaplun and Talmon1991) and other bile salts (Hjelm et al. Reference Hjelm, Thiyagarajan and Alkanonyuksel1992; Long et al. Reference Long, Kaler and Lee1994; Moschetta et al. Reference Moschetta, Frederik, Portincasa, VanBerge-Henegouwen and Van Erpecum2002), C12EO8 (Edwards & Almgren, Reference Edwards and Almgren1991; Gutberlet et al. Reference Gutberlet, Kiselev, Heerklotz and Klose2000), C8Gluc (Vinson et al. Reference Vinson, Talmon and Walter1989), C12EO6 (Gutberlet et al. Reference Gutberlet, Kiselev, Heerklotz and Klose2000) and TX100 (Edwards et al. Reference Edwards, Almgren, Bellare and Brown1989). Similar structures were also found in systems of bile salts with EYPC, sphingomyelin and cholesterol (Nibbering et al. Reference Nibbering, Frederik, Van Berge-Henegouwen, Van Veen, Van Marle and Van Erpecum2002).
(i) Coexistence of micellar and lamellar microenvironments in perforated vesicles. A second pathway involving networks of cylindrical micelles arising from perforations was described particularly for charged surfactants. Addition of surfactant gives rise to perforated vesicles or stomatosomes. The detergent-rich rims covering the edges of the perforations resemble ‘half-cylindrical micelles’. Increasing detergent concentration increases the number of pores until the pores touch each other and only the rims are left as a network of entangled, branched, interconnected cylindrical micelles. Addition of further surfactant leads to rather linear cylindrical, then (potentially) oblate discoidal and finally to spherical micelles (Gustafsson et al. Reference Gustafsson, Oradd and Almgren1997; Almgren, Reference Almgren2007). Kadi et al. (Reference Kadi, Hansson and Almgren2004) describe such a behaviour for glycerol monooleate vesicles upon addition of C16TAC. Although this pathway involves the same principal topologies, lamellar, cylindrical, spherical, it differs from pathway (i) in a number of respects.
(ii) Solubilisation by continuous shrinking of lamellar sheets to disc micelles. A third, at least formally possible pathway proceeds via leaky to open vesicles, and further to lamellar sheets which shrink to discoidal or oblate-shaped micelles and transform, finally, into spherical micelles. The concept goes back to the mixed disc model by Mazer et al. (Reference Mazer, Benedek and Carey1980). Originally, this pathway was believed to apply generally, but this suggestion was ruled out by cryo-TEM and neutron scattering results for many (if not all) systems. Walter et al. (Reference Walter, Vinson, Kaplun and Talmon1991) have reviewed the observations of cylinders and discs in detail, and Kozlov et al. (Reference Kozlov, Lichtenberg and Andelman1997) provided a theoretical analysis of the two alternative structures.
Mixtures that form discoidal micelles are, for example, those of DMPC with short-chain lipids such as dihexanoyl-PC (D7PC) (so-called bicelles; cf. below) (Luchette et al. Reference Luchette, Vetman, Prosser, Hancock, Nieh, Glinka, Krueger and Katsaras2001) and with PEG-grafted lipids (Johnsson & Edwards, Reference Johnsson and Edwards2003). The mere existence of discs, however, is no proof for pathway (iii) to apply; Van Dam et al. (Reference Van Dam, Karlsson and Edwards2004) also show cylindrical micelles for DMPC–D7PC and suggest that discoidal micelles are formed at intermediate D7PC concentrations between cylinders and small spheres. Furthermore, discs may also play a role as metastable intermediates, particularly upon reconstitution (see next section).
Addition of substantial but still sub-solubilising amounts of C8Gluc to LUV was shown to induce the formation of small vesicles termed SUV* (Ueno et al. Reference Ueno, Hirota, Kashiwagi and Sagasaki2003).
4.3 Thermodynamics of fluid membrane solubilisation
The key to the understanding of solubilisation is monolayer curvature strain as explained in Section 3.2. The dotted line in Fig. 6 illustrates that curvature strain as represented by the excess enthalpy H E reaches its maximum at X bsat, and is then relaxed upon solubilisation to rod-like (cylindrical) micelles and further by the rod-to-sphere transition. Note that here H E is defined analogously to (17) but as a function of X e [see Eq. (34) below], and is thus not specific to bilayers but as a mean value for all existing aggregates. The figure also implies a critical value of H E that is related to the maximum curvature strain that can be accommodated by a POPC membrane. All systems shown in the figure start solubilisation when H E reaches ∼4 kJ mol−1; the larger the head group, the steeper is the H E curve and the less detergent is needed to reach the critical value.
The state of a lipid–surfactant–water system at a given composition, temperature (T) and pressure (p) is represented by a phase diagram. A ternary system at constant T, p is usually represented by a phase triangle with the pure components at the corners (see Section 4.10); taking into account the effect of temperature expands the triangle to a prism. Different strategies lead to a much more convenient, two-dimensional plot depending on the aim of the study. A way to eliminate monomers and partitioning effects is to introduce an effective mole fraction X e:

or, analogously, the mole ratio (Lichtenberg, Reference Lichtenberg1985; Lichtenberg et al. Reference Lichtenberg, Opatowski and Kozlov2000)

When virtually all surfactant resides in aggregates (lamellae, micelles or others), the total X S=X e. Hence, a pseudo-binary, T(X e), phase diagram refers to the average surfactant content of all coexisting aggregates and assumes the surfactant to be fully hydrated but excludes surfactant monomers. The state of the surfactant–lipid phases is fully determined by X e (abscissa) and T (ordinate) for a given pressure (see, for example Figs 7 and 8).
If the total lipid and surfactant concentrations (not explicitly specified) are not large enough to render aqueous monomers negligible, additional information on partitioning is required to calculate X e and read the corresponding phase state from the diagram. The latter problem is avoided by a rectangular, pseudo-binary C S(C L) diagram sacrificing the temperature axis (Fig. 11) (Lichtenberg, Reference Lichtenberg1985; Lichtenberg et al. Reference Lichtenberg, Opatowski and Kozlov2000).
Models for surfactant–lipid phase diagrams. Schematic illustration of ideal phase diagrams for a surfactant mixture (no ‘lipid’, a) and a binary lipid/surfactant mixture (CAC of lipid≈0, b).

It should be emphasised that phases in the strict sense are macroscopically separate volume ranges, such as those formed by octanol/water or oil/water. To a certain approximation, coexisting types of microenvironments in a colloidal dispersion can, however, be treated as pseudo-phases. Two different pseudo-phases must show a different topology so that a transition proceeds via phase coexistence and cannot be realised as a gradual transformation. For the solubilisation pathway involving cylindrical micelles, there is only one transition that fulfills this requirement well: the step from a lamellar to a cylindrical geometry. Hence, in spite of the complexity of the structures involved, a corresponding lipid/surfactant phase diagram distinguishes only three pseudo-phases: the aqueous solution of monomers (mon), the lamellar or bilayer (bil) phase (regardless of whether vesicles or lamellar sheets are concerned) and the micellar (mic) phase (cylindrical or spherical, see Section 4.11). For the solubilisation pathways via discoidal micelles or via networks of cylindrical micelles, there is no principal discontinuity in topology from one type of particle to another, and one may expect no pseudo-phase transition to occur. There is, however, a topological step between lamellar membrane patches and the curved rims of pores or discs. Since the rims are also enriched in detergent compared to the bulk bilayer, perforated bilayers, lamellar sheets and discs may actually resemble a coexistence of two phases, rim and planar, although these structures are combined in one type of particle (Kadi et al. Reference Kadi, Hansson and Almgren2004). Then, thermodynamics may refer to the onset of membrane perforation as the beginning of solubilisation, whereas most structural methods (including light scattering) would assign the onset of solubilisation to the situation when the gradually shrinking sheets, discs or networks reach a certain size.
Let us illustrate the principal features of a C S(C L) diagram by first considering the ideal phase behaviour of a mixture of a micelle-forming surfactant (S1) and a bilayer-forming surfactant (S2) in dilute solution (Fig. 11a). At very low concentrations, monomers of S1 and S2 are dissolved in water. Pure S1 starts to self-associate to micelles at the CMC(1), and pure S2 aggregates to bilayers at the critical aggregation concentration, CAC(2). Small amounts of S1 promote the aggregation of S2 and vice versa, so that the phase boundary to the micellar phase decreases with increasing concentration of S2. A transition from the monomer range to a coexistence of monomers, micelles and bilayers is possible only at a single point with the coordinates C S1=C S1aq, sat and C S2=C S2aq, sat, since the monomer concentrations in the whole three-phase range are constant, C S1aq, sat and C S2aq, sat. This is a requirement of Gibbs' phase rule (Cevc & Marsh, Reference Cevc and Marsh1985), which implies that there is no degree of freedom for a three-phase coexistence of a three-component system at a given p and T. The constant slopes of the sat and sol boundaries represent the mole ratios of the surfactants in the micelles and bilayers, which must also be constant within the three-phase range, R b=R bsat and R m=R msol.
Membrane lipids show an extremely low solubility, so that CAC≈0 and the ideal phase diagram in the experimentally accessible concentration range is simplified as illustrated in Fig. 11b (Lichtenberg, Reference Lichtenberg1985; Lichtenberg et al. Reference Lichtenberg, Opatowski and Kozlov2000). The point of intersection of the boundaries shifts to the ordinate but remains below the CMC. The boundaries obey Eq. (29) with the slopes R bsat and R msol, respectively, and a common intercept of C Saq, sat=C Saq, sol.
Hence, the ‘extent of solubilisation’, α, can be written as:

and runs from 0 at the onset to 1 at the completion of solubilisation. If detergent or lipid is added to the mixture so that the system crosses the coexistence range, only α varies but the composition of the mixed membranes and micelles remains constant. Experimental parameters representing the state of the system should be a linear function of α within the coexistence range (Ollivon et al. Reference Ollivon, Lesieur, Grabielle-Madelmont and Paternostre2000), and partial molar enthalpies of a titrant (lipid or surfactant) measured by ITC correspond to the derivative of the state function and should therefore be constant in the three-phase range (Heerklotz et al. Reference Heerklotz, Lantzsch, Binder, Klose and Blume1996). As mentioned, the aqueous surfactant concentration should be constant as well (Heerklotz et al. Reference Heerklotz, Binder, Lantzsch and Klose1994b; Paternostre et al. Reference Paternostre, Meyer, Grabielle-Madelmont, Lesieur, Ghanam and Ollivon1995; le Maire et al. Reference le Maire, Champeil and Moller2000), see also vertical increase of the partitioning isotherm (Fig. 2).
This ideal behaviour is only approximately found for the pseudo-phase transition in colloidal systems. Micelles differ from a real, macroscopically separate phase by (1) a large interface between micelles and water, (2) the entropy of mixing of the micelles with water and (3) inter-micellar interactions. Then, the chemical potential no longer depends only on the composition of the micelles (R msol) but also on their abundance, which increases in the course of solubilisation. The same applies to bilayer particles. It has been shown (Roth et al. Reference Roth, Opatowski, Lichtenberg and Kozlov2000) that such effects account for the fact that the phase boundaries do not exactly share the same intercept with the ordinate, C Saq, sat≠C Saq, sol (Lichtenberg, Reference Lichtenberg and Shinitzky1993; Paternostre et al. Reference Paternostre, Meyer, Grabielle-Madelmont, Lesieur, Ghanam and Ollivon1995; Keller et al. Reference Keller, Kerth and Blume1997; Lichtenberg et al. Reference Lichtenberg, Opatowski and Kozlov2000) and that the phase boundaries become non-linear in very dilute systems (R bsat≠const. for C L→0).
Major deviations from the three-stage model were found for CHAPS (Viriyaroj et al. Reference Viriyaroj, Kashiwagi and Ueno2005), which shows a binding isotherm with two subsequent transitions indicated by steep increases of X e(C Saq) (cf. Fig. 2) at X e∼0·1 and 0·21. As a result, literature values on R bsat and K depend strongly on the method and specific sample conditions used (see comparison in Beck et al. Reference Beck, Tsamaloukas, Jurcevic and Heerklotz2008). Lipid–cholate mixtures in pure water show a very unusual behaviour. The limiting compositions of coexisting bilayers and micelles are virtually the same (R bsat≈R msol) so that surfactant molecules added to the bilayer–micelle system partition almost exclusively into the aqueous phase (C Saq, sat<C Saq, sol) (Hildebrand et al. Reference Hildebrand, Neubert, Garidel and Blume2002). Note that this system shows comparatively strong, electrostatic inter-micellar interactions since the micelles are small (and thus many) and the charges are not screened by extra salt. Solubilisation, i.e. an increasing number of micelles, will increase this unfavourable contribution to μS0, m. If R m is unchanged, μSm increases and, to retain equilibrium, μSaq and thus C Saq (and possibly R b) will increase as well.
4.4 Solubilisation in systems comprising multiple lipids or surfactants
Homogeneous fluid mixed lipid membranes such as those of egg, brain or soy bean PC seem to behave very similar to one-component membranes and were not found to exhibit any qualitatively different solubilisation behaviour from one-component membranes. In fact, the values of K, R bsat and R msol of egg yolk PC are very close to those reported for its major component, POPC (see Tables 1a–1c and 2). A much more complex behaviour, however, is encountered if the different lipids are capable of forming different membrane phases or domains. Even if the membrane is homogeneous and fluid at the onset of solubilisation (the other case is discussed in Section 4.5), the lipids will partition between coexisting membranes and micelles differently, so that those that are more compatible with a disordered environment are selectively solubilised whereas order-preferring lipids become enriched in the membrane. This effect was predicted to induce, under suitable conditions, a (re)appearance of ordered domains in membranes upon solubilisation (Keller et al. Reference Keller, Tsamaloukas and Heerklotz2005b). Apel-Paz et al. (Reference Apel-Paz, Doncel and Vanderlick2005) showed that high surfactant concentrations (leading to the presence of micelles) rendered cholesterol-rich vesicles resistant against surfactant-induced leakage by selective solubilisation, whereas lower concentrations caused leakage. Their result also implies that, in contrast to what has been described for gel or fluid phases, ℓo phases can form stable, non-leaky vesicles in coexistence with mixed micelles. The local enhancement of sterol concentrations by selective solubilisation of PC from PC–sterol vesicles was also shown by FRET and discussed in relation to gallstone formation (Wrenn et al. Reference Wrenn, Gudheti, Veleva, Kaler and Lee2001).
Systems of a lipid interacting with a mixture of surfactants (at fixed ratio) show pseudo-binary phase diagrams with curved boundaries. If the surfactants mix ideally, the reciprocal of the total surfactant concentration required for the onset of solubilisation in this case, C Ssat, is the weighted sum of the reciprocals of the concentrations of the individual detergents alone that would be needed for solubilisation, C Sisat (Beck et al. Reference Beck, Tsamaloukas, Jurcevic and Heerklotz2008). The weighting is given in terms of the fraction of surfactant i, referred to as the sum of all surfactant concentrations, ξi:

The solubilising concentration of a single surfactant (C Sisat) can be expressed in terms of the lipid concentration (C L) and the mole-ratio partition coefficient of surfactant i (K i) and its critical mole ratio in the membrane, R bisat, yielding the second equality in Eq. (37). The ‘sat’ phase boundary, C Ssat(CL), for a system of two surfactants and one lipid is obtained from Eq. (37) as:

Analogously, the ‘sol’ phase boundary obeys for ideal mixing:

yielding for a two-surfactant system:

The phase boundaries in such a system become non-linear and the compositions of the membranes and micelles are not constant throughout the coexistence range. The apparent (overall) partition coefficient and the critical mole ratio of all surfactant to lipid within the membrane for saturation, R bsat, of a surfactant mixture vary as a function of the lipid concentration. It should be noted at this point that many industrial (e.g. Triton, Lubrol, Tween series) as well as biological (e.g. surfactin) surfactants are actually mixtures of chemically related, but not identical, substances and may, under certain conditions, show such lipid-dependent variations of their key parameters.
4.5 Direct solubilisation of gel and ℓo membranes
Not too far below the melting temperature of the lipid, gel phases are typically molten by added detergent (Section 3.4) before, at higher surfactant concentration, the fluid membrane is solubilised. However, below a certain temperature (∼25°C in Fig. 7), the gel phase is converted directly into micelles without an intermediate fluid membrane.
If the surfactant-rich defects in a gel membrane do not acquire sufficient lipid, they will ultimately turn into a strongly curved, micelle-like state. Hence, the gel clusters break apart forming gel-like, surfactant-depleted (or virtually surfactant-free) lamellar sheets or discs surrounded by a surfactant-rich rim (Inoue et al. Reference Inoue, Kawamura, Okukado and Shimozawa1994a; Funari et al. Reference Funari, Nuscher, Rapp and Beyer2001; Carion-Taravella et al. Reference Carion-Taravella, Lesieur, Chopineau, Lesieur and Ollivon2002). The sequestering of the surfactant to high local concentrations in defects accounts for the very low average values of R bsat observed for ordered phase membranes (Patra et al. Reference Patra, Alonso and Goni1998, Reference Patra, Alonso, Arrondo and Goni1999; Nyholm & Slotte, Reference Nyholm and Slotte2001; Heerklotz, Reference Heerklotz2002; Ollila & Slotte, Reference Ollila and Slotte2002; Sot et al. Reference Sot, Collado, Arrondo, Alonso and Goni2002). With increasing surfactant concentration, the sheets may shrink (increasing the rim-to-core ratio) or coexisting, detergent-rich micelles might form. Carion-Taravella et al. (Reference Carion-Taravella, Lesieur, Chopineau, Lesieur and Ollivon2002) distinguish between liquid and solid micelles. The surfactant content that is required to convert the whole system into a liquid micellar state, where all chains are disordered and the molecules mix, is governed by the affinity of the lipid to these micelles (Keller et al. Reference Keller, Tsamaloukas and Heerklotz2005b).
It is not straightforward to define and detect the phase ranges in such a system. The core and perimeter of gel-like membrane particles with their characteristic compositions and packing properties may be well approximated as two coexisting phases, although they are combined within one type of particle (see also Section 4.3). Techniques revealing the molecular structure such as ESR (Inoue et al. Reference Inoue, Kawamura, Okukado and Shimozawa1994a), wide angle X-ray diffraction or other methods (Funari et al. Reference Funari, Nuscher, Rapp and Beyer2001; Carion-Taravella et al. Reference Carion-Taravella, Lesieur, Chopineau, Lesieur and Ollivon2002) allow operators to distinguish gel particles from regular micelles. However, methods detecting the size of the particles such as turbidity and centrifugation assays fail to distinguish ‘solid micelles’ (small gel particles) from regular, ‘liquid’ micelles.
Galla and Sackmann's (Reference Galla and Sackmann1974) finding that cholesterol anneals defect structures between gel clusters in membranes suggest a different scenario for cholesterol-rich, ℓo phases. Indeed, cholesterol-rich membranes differ from both gel and fluid (Chol-free) membranes in requiring higher surfactant concentrations and more time to reduce turbidity to low values characteristic of small particles (Saez-Cirion et al. Reference Saez-Cirion, Alonso, Goni, McMullen, McElhaney and Rivas2000). In contrast to gel membranes, they do not break apart into very small pieces upon addition of surfactant, but form much larger ‘resistant’ particles and can even form leakage- and solubilisation-resistant vesicles coexisting with detergent micelles (Apel-Paz et al. Reference Apel-Paz, Doncel and Vanderlick2005).
4.6 Kinetics of solubilisation and reconstitution
Different kinetic mechanisms have been described for solubilisation and reconstitution processes (for a review, see Gradzielski, Reference Gradzielski2004). Reconstitution of vesicles from mixed micelles with bile salts was shown to proceed via the formation of metastable, discoidal structures that close themselves to vesicles driven by the line tension along the perimeter (Leng et al. Reference Leng, Egelhaaf and Cates2003). The size of the vesicles is determined by the kinetics of their formation rather than the equilibrium state. Mechanistic aspects of the transition between bicelles and (perforated) lamellae were studied by time-resolved SANS (Wang et al. Reference Wang, Nieh, Hobbie, Glinka and Katsaras2003).
Solubilisation could proceed via the reverse process, as described for a sequence of equilibrium structures in Section 4.2, pathway (iii), or involving metastable discoidal intermediates. However, Vinson et al. (Reference Vinson, Talmon and Walter1989) saw ‘strings’, most probably cylindrical OG/PC micelles, emerging directly from vesicles in cryo-TEM images. The ‘in situ’ formation of micelles in the membrane followed by their separation from the vesicle was also described by Lopez et al. (Reference Lopez, de la Maza, Coderch, Lopez-Iglesias, Wehrli and Parra1998). Cocera et al. (Reference Cocera, Lopez, Pons, Amenitsch and De La Maza2004) measured fast relaxation times of 2 s or less for the desorption of mixed micelles from neutral or somewhat negatively charged vesicles super-saturated with SDS. The disintegration of pure detergent micelles is also relatively fast; pure SDS micelles were detected only for 10–30 s after (super-saturating) addition to vesicles (Cocera et al. Reference Cocera, Lopez, Pons, Amenitsch and De La Maza2004). However, since this ‘in situ micellisation’ process requires the localisation of the detergent in both membrane leaflets, membrane permeation may become the rate-limiting step and the completion of solubilisation primarily by ‘impermeant’ detergents may require many hours or days as shown for SDS at room temperature (Cocera et al. Reference Cocera, Lopez, Pons, Amenitsch and De La Maza2004). Solubilisation is also slowed down by low temperatures (Schnitzer et al. Reference Schnitzer, Kozlov and Lichtenberg2005; Keller et al. Reference Keller, Heerklotz, Jahnke and Blume2006b) and highly ordered membranes such as purple membrane (Viguera et al. Reference Viguera, Gonzalezmanas, Taneva and Goni1994) and vesicles of lipids containing saturated chains and/or substantial amounts of cholesterol (Schnitzer et al. Reference Schnitzer, Kozlov and Lichtenberg2005). It should be noted that the application of standard protocols to isolate DRM fractions (cf. Section 5.4) does not distinguish between thermodynamic and kinetic resistance.
4.7 Methods of detecting solubilisation
A variety of methods has been used to detect surfactant-induced transitions of lipid vesicles. An excellent method to detect phase boundaries or critical R e values for transformations is ITC (Heerklotz et al. Reference Heerklotz, Lantzsch, Binder, Klose and Blume1995, Reference Heerklotz, Lantzsch, Binder, Klose and Blume1996, Reference Heerklotz, Binder, Lantzsch, Klose and Blume1997; Keller et al. Reference Keller, Kerth and Blume1997; Wenk & Seelig, Reference Wenk and Seelig1997a; Heerklotz, Reference Heerklotz2001, Reference Heerklotz2002; cf. Heerklotz & Seelig, Reference Heerklotz and Seelig2000b for a review). To explore the composition-dependent mixing behaviour, vesicles can be titrated with surfactant micelles (solubilisation experiment) or vice versa (reconstitution experiment). The great sensitivity for transitions arises from the fact that the heat of injection does not primarily report on the state of the system (the existence of the first few micelles is hardly detectable) but on the process induced by the injection (the formation of micelles). Therefore, the heat usually changes its sign at the ‘sat’ boundary when injected surfactant is no longer transferred from micelles into the membrane but additional surfactant (and lipid) is solubilised from membranes to micelles.
For non-ionic detergents with high partition coefficients, the ITC experiments also yield a complete set of transfer enthalpies of detergent and lipid between membranes and micelles (Heerklotz et al. Reference Heerklotz, Lantzsch, Binder, Klose and Blume1996) as well as the composition-dependent excess enthalpy function of the mixed aggregates (Heerklotz et al. Reference Heerklotz, Binder and Schmiedel1998) in a rather straightforward manner. In the general case, a complete modelling of ITC solubilisation and reconstitution curves has to further take into account effects of membrane–water (re)partitioning and, for ionics, electrostatic interactions and composition-dependent changes in counter ion binding (see Keller et al. Reference Keller, Heerklotz, Jahnke and Blume2006b).
Micelles and lamellar structures in highly concentrated samples (typically 50 wt% of water) give rise to different solid-state 31P NMR spectra (Jackson et al. Reference Jackson, Schmidt, Lichtenberg, Litman and Albert1982; Goni et al. Reference Goni, Urbaneja, Arrondo, Alonso, Durrani and Chapman1986; Paternostre et al. Reference Paternostre, Roux and Rigaud1988; Otten et al. Reference Otten, Lobbecke and Beyer1995; Wenk & Seelig, Reference Wenk and Seelig1997a; Heerklotz, Reference Heerklotz2002). This technique is particularly sensitive for lipids in micelles with their narrow, quasi-isotropic signal and thus for identifying R msol (Lichtenberg et al. Reference Lichtenberg, Opatowski and Kozlov2000).
Static light scattering and turbidity experiments reveal the value of R e above which only small ellipsoidal or spherical micelles are present (Vinson et al. Reference Vinson, Talmon and Walter1989), but do not allow a reliable differentiation between vesicles, lamellar sheets and cylindrical micelles, which may all scatter light to a considerable extent so that micelles may be present already at concentrations below that, giving rise to the maximum turbidity of the sample (Vinson et al. Reference Vinson, Talmon and Walter1989; Walter et al. Reference Walter, Vinson, Kaplun and Talmon1991; Long et al. Reference Long, Kaler and Lee1994). Cylindrical micelles may also show hydrodynamic radii that cannot clearly be distinguished from vesicles or bilayer particles by dynamic light scattering (e.g. Garidel et al. Reference Garidel, Hildebrand, Knauf and Blume2007). This must be taken into account when R bsat or R msol are to be estimated on the basis of light scattering measurements.
FRET between donor and acceptor probes attached to the lipids (Ollivon et al. Reference Ollivon, Eidelman, Blumenthal and Walter1988; da Graca-Miguel et al. Reference da Graca-Miguel, Eidelman, Ollivon and Walter1989; Walter et al. Reference Walter, Kuehl, Barnes and VanderWaerdt2000) or dehydroergosterol (as a donor to dansyl) (Wrenn et al. Reference Wrenn, Gudheti, Veleva, Kaler and Lee2001) can be used to detect solubilisation. It is reduced in micelles since fewer lipids (potentially carrying an acceptor) are close to a donor in a cylindrical (one-dimensional) than in a lamellar (two-dimensional) geometry. Separation of donors from acceptors into different small micelles makes FRET impossible. Excimer formation of pyrene is enhanced right above R bsat (Ceu Rei et al. Reference Ceu Rei, Coutinho, Castanheira and Real Oliveira2004), obviously due to a tendency of the dye to sequester in the (small fraction of) micelles. Fourier transform infrared measurements revealed the changes in chain order of surfactants and lipids upon solubilisation (Meister & Blume, Reference Meister and Blume2004).
Partitioning isotherms, i.e. plots of R e or X e as a function of the aqueous concentration, C Saq, depend on the free energy of the surfactant in the membrane. Structural transitions may give rise to break points in the isotherm; a pseudo-phase coexistence can be identified as a range in R e that corresponds to an almost constant C Saq (cf. Fig. 2) (Heerklotz et al. Reference Heerklotz, Binder, Lantzsch and Klose1994b; Paternostre et al. Reference Paternostre, Meyer, Grabielle-Madelmont, Lesieur, Ghanam and Ollivon1995; Kragh-Hansen et al. Reference Kragh-Hansen, le Maire and Moller1998).
Cryo-TEM (Vinson et al. Reference Vinson, Talmon and Walter1989; Walter et al. Reference Walter, Vinson and Talmon1990; Edwards & Almgren, Reference Edwards and Almgren1991; Almgren, Reference Almgren2000) (cf. Fig. 10) and SANS (Hjelm et al. Reference Hjelm, Thiyagarajan and Alkanonyuksel1992) are superior methods of identifying abundant aggregate structures within a certain range, but considerable expertise is essential to avoid artefacts. Suggestions from light and X-ray scattering and negative-staining electron microscopy have led to misinterpretations in the past.
4.8 Effects governing the solubilisation of fluid membranes
The fact that C Saq, sat is usually only somewhat smaller than the CMC (since micelles are slightly stabilised by small available amounts of lipid) shows a direct relationship between membrane perturbation at low concentration (quantified in terms of K R×CMC; cf. Section 2.7) and the onset of solubilisation:

derived with (10) and C Saq, sat≈CMC (Heerklotz & Seelig, Reference Heerklotz and Seelig2000a, Reference Heerklotz and Seelig2001).
The lowest R bsat published seems to be 0·012 for the synthetic lipopeptide P2A2 (R msol=0·13, both values for POPC at 25°C; Keller et al. Reference Keller, Sauer, Strauss, Gast, Dathe and Bienert2005a); very strong membrane solubilisers also include the lipopeptide surfactin (Rbsat=0·2; Heerklotz & Seelig, Reference Heerklotz and Seelig2001, Reference Heerklotz and Seelig2007), steroid-like surfactants such as bile salts (e.g. Hildebrand et al. Reference Hildebrand, Neubert, Garidel and Blume2002) and the short-chain diacyl lipid D7PC. All these compounds share a common trait in that they are anchored by more than a single alkyl chain to the membrane so that they can impose strong perturbations without being ‘squeezed out’ to a less perturbing position (see Heerklotz et al. Reference Heerklotz, Wieprecht and Seelig2004b). Strong ‘polar head and alkyl tail’ detergents exhibit typical R bsat values of ∼0·5; weak detergents initiate solubilisation only at concentrations when more than half of the molecules in the membrane are detergents (R bsat>1), and others do not solubilise the membrane at all but form lamellar aggregates themselves (see Tables 1a–1c and 2).
Since solubilisation is governed by the net spontaneous curvature of the lipid/surfactant system, it is promoted with increasing positive spontaneous curvature of the surfactant and with less negative/more positive spontaneous curvature of the lipid. This is observed for surfactants with larger head groups or smaller hydrophobic parts (Partearroyo et al. Reference Partearroyo, Alonso, Goni, Tribout and Paredes1996; Heerklotz et al. Reference Heerklotz, Binder, Lantzsch, Klose and Blume1997) or for lipids with longer chains (increasing the mismatch) (Keller et al. Reference Keller, Kerth and Blume1997) (cf. Table 1a). The total concentration of TX100 required for solubilisation (at 1 mm lipid) was found to increase for lipids with lower order (probably related to more negative spontaneous curvature), caused by the addition of cis double bonds or changing the position of these cis bonds; ether and ester lipids showed no major difference (Ahyayauch et al. Reference Ahyayauch, Larijani, Alonso and Goni2006). Solubilisation of DOPE, a lipid with a strong negative spontaneous curvature, requires extremely high amounts of detergent to be solubilised (e.g. R bsat=2·2 of reduced TX100; Johnsson & Bergstrand, Reference Johnsson and Bergstrand2004).
An increase in temperature tends to render spontaneous curvature less positive or more negative and increases R bsat typically (Otten et al. Reference Otten, Lobbecke and Beyer1995; Heerklotz et al. Reference Heerklotz, Binder, Lantzsch, Klose and Blume1997; Keller et al. Reference Keller, Kerth and Blume1997; Heerklotz, Reference Heerklotz2002). If this effect is not (over)compensated by a stronger partitioning of the surfactant into the membrane with increasing temperature (da Graca-Miguel et al. Reference da Graca-Miguel, Eidelman, Ollivon and Walter1989), membrane reconstitution can also be observed as a thermotropic transition (Majhi & Blume, Reference Majhi and Blume2001, Reference Majhi and Blume2002; Heerklotz, Reference Heerklotz2002).
4.9 Transitions involving type II phases
Surfactants with a positive spontaneous curvature can convert cubic or hexagonal phases formed by type II lipids into lamellar (vesicle) systems. This has been demonstrated, for example, for the addition of reduced Triton (Johnsson & Bergstrand, Reference Johnsson and Bergstrand2004) and C8Gluc (Angelov et al. Reference Angelov, Ollivon and Angelova1999) to DOPE. Surfactants with a negative spontaneous curvature (such as C12EO2, Funari et al. Reference Funari, Madler and Rapp1996; and fatty acids, Winter et al. Reference Winter, Erbes, Templer, Seddon, Syrykh, Warrender and Rapp1999) can convert lipid membranes into different cubic or inverse phases. The transition to inverse phases is promoted by reduced hydration (see next section) and increased temperature (Gutberlet et al. Reference Gutberlet, Dietrich, Klose and Rapp1998).
4.10 Lyotropic phase behaviour
So far, lipid–surfactant systems have been treated as pseudo-binary systems, assuming that there is an excess of water and all exposed groups are fully hydrated. It is important to note that the dispersion in water is the reason that lipids and surfactants self-assemble to membranes and micelles in the first place. A complete description of the ternary system (surfactant, lipid, water) at a given temperature and pressure is possible by a triangular phase diagram. Published examples are the system C12EO4–POPC–D2O (Klose et al. Reference Klose, Eisenblatter and Konig1995), TX100–lecithin–water (Sadaghiani et al. Reference Sadaghiani, Khan and Lindman1989) and EPC–C16TAC–brine and EPC–C12TAC–brine (Gustafsson et al. Reference Gustafsson, Oradd and Almgren1997). Very detailed studies on water sorption to C12EOn detergents are available; at 97% relative humidity, the number of water molecules adsorbed from vapour increases linearly with a slope of ∼2·3 water per EO unit between at least n=2 and 7 and over a broad range of detergent contents in the membrane (Konig et al. Reference Konig, Dietrich and Klose1997). The fact that the intercept (n→0) of ∼8 waters/lipid is well below the value for pure POPC under these conditions, 13 water molecules per lipid, implies that the detergent causes a lower hydration of the lipid.
A number of lyotropic transitions typically occur upon dehydration. The lack of excess water tends to pack previously dispersed aggregates closer together, such as vesicles to multilamellar systems, rod-like micelles to hexagonal phases and spherical micelles to isotropic phases. Furthermore, dehydration reduces the size of the polar head groups and renders the spontaneous curvature of the molecules less positive/more negative. As a result, dehydration may freeze a fluid membrane into a gel phase, shift the boundaries of the lamellar-to-micelle transition in favour of the lamellar phase and promote inverse (type II) phases (with a negative real curvature). For example, at 97% relative humidity, POPC containing R e=2 of, e.g. C12EO7 and C12EO8 was found to be exclusively lamellar (Konig et al. Reference Konig, Dietrich and Klose1997), whereas at excess water these systems would start forming micelles already at R esat=0·43 and 0·35, respectively.
Even in an excess of water, the insertion of detergents into the membrane may partially dehydrate lipid head group region (Volke & Pampel, Reference Volke and Pampel1995; Rieber et al. Reference Rieber, Sykora, Olzynska, Jelinek, Cevc and Hof2007). This may be due to the increased lateral pressure in the head group region accompanying positive curvature strain (see Section 3.2) or the formation of hydrogen bonds between lipid and surfactant that replace bonds to water. Furthermore, experimental data (Volke & Pampel, Reference Volke and Pampel1995) and MD simulations (Schneider & Feller, Reference Schneider and Feller2001) implied that the EO units of C12EO4 in POPC membranes are partially dehydrated and localised in the hydrocarbon core. Dehydration phenomena may also contribute to the excess enthalpy of lipid–surfactant systems (Heerklotz et al. Reference Heerklotz, Binder and Schmiedel1998; Schneider & Feller, Reference Schneider and Feller2001; Barriocanal et al. Reference Barriocanal, Taylor and Buckton2005) and the formation of compound complexes (Madler et al. Reference Madler, Klose, Mops, Richter and Tschierske1994, Reference Madler, Binder and Klose1998) (see Section 3.3). It is noteworthy that all these references deal with detergents including EO units.
4.11 Lipid-induced transitions of micellar structures
Because the cylinder-to-sphere transition of mixed micelles is also governed by curvature effects, lipid-saturated mixed micelles are also typically cylindrical if the pure surfactant forms spherical micelles (see Sections 0 and 0). For example, C12EO8 forms spherical micelles that transform to cylinders at a lipid content of about 24 mol% (Heerklotz et al. Reference Heerklotz, Lantzsch, Binder, Klose and Blume1996). For C12EO7, 12 mol% of POPC suffice for forming cylinders (Heerklotz et al. Reference Heerklotz, Binder and Schmiedel1998) and C12EO5 forms cylindrical micelles at room temperature even in the absence of lipid (Nilsson et al. Reference Nilsson, Wennerstrom and Lindman1983). The cylinder-to-sphere transition relaxes curvature strain as indicated by the quasi-sigmoidal decrease of H E (Fig. 6, see dotted curve at X e∼0·88). Cylindrical micelles of lipid and bile salt were shown to decrease in length with increasing detergent content (thus increasing the proportion of the detergent-rich end caps) but keep their radius (and local composition in the body) constant (Long et al. Reference Long, Kaler and Lee1994). It should be noted that cylindrical micelles may exhibit a minimum length so that they cannot shrink gradually to prolates and spheres but show a transition involving a cylinder–sphere coexistence. This seems to be in conflict with the traditional model of a cylinder with half-spherical end caps, but could be explained by a peanut-like shape so that end caps (and coexisting spheres) have a larger radius than the quasi-cylindrical part; for data and theory on one-component micelles, see Heerklotz et al. (Reference Heerklotz, Tsamaloukas, Kita-Tokarczyk, Strunz and Gutberlet2004a) and May & Ben-Shaul (Reference May and Ben-Shaul2001).
There are also systems involving no cylindrical micelles, for example DOPE/reduced TX100; this might result from the fact that only extremely low amounts (1–6 mol% depending on pH) of DOPE can be accommodated in micelles (Johnsson & Bergstrand, Reference Johnsson and Bergstrand2004). The agreement of the lamellar–micellar phase boundaries detected by ITC with the break points of the light scattering curve for SDS–POPC mixtures suggested that ‘large’ (cylindrical) micelles seem to play no significant role in this system also (Keller et al. Reference Keller, Heerklotz, Jahnke and Blume2006b).
Finally, it should be noted that insertion of lipids into surfactant micelles may reduce the cloud point, i.e. the temperature above which the micellar dispersion splits into two separate phases. In Fig. 7, this is depicted by open diamonds separating L1 and L1+W at about 25–30°C and high X. For a detailed study, cf. Kresheck and Mihelich (Reference Kresheck and Mihelich2003). The formation of small droplets of the second phase leads to a strong, transient increase in turbidity (clouding) but, typically after some hours, these droplets coalesce to form a macroscopically separate, transparent phase.
5. Applications and biological relevance of surfactant–membrane interactions
5.1 Biological effects of surfactants on membranes
Surfactants and molecules with surfactant-like properties play a role in an enormous variety of biological systems and processes, and this review can only mention a few particularly prominent examples. Classical biosurfactants are saponins (sapo is latin for soap; for a review, see Francis et al. Reference Francis, Kerem, Makkar and Becker2002); they are produced by many plants and considered, possibly among other functions, part of their defence system against microbes, insects etc. They impose a variety of effects on cells and organisms, including membrane permeabilisation and complexation of cholesterol; these biological activities of saponins (e.g. digitonin) are also utilised for technical and pharmaceutical applications.
Nibbering et al. (Reference Nibbering, Frederik, Van Berge-Henegouwen, Van Veen, Van Marle and Van Erpecum2002) and references therein have discussed the relevance of mixed vesicle and micelle formation of bile salts with glycerolipids, sphingomyelins and cholesterol for proper digestion and for gallstone formation. Cholesterol nucleation for gallstone formation was related to the selective solubilisation of lecithin from lecithin–cholesterol vesicles by bile salts (Wrenn et al. Reference Wrenn, Gudheti, Veleva, Kaler and Lee2001). Emulsification of lipids by bile salts may be followed by their hydrolysis by pancreatic lipase which is inhibited by lysolecithin (Tsuzuki et al. Reference Tsuzuki, Ue, Nagao, Endo and Abe2004), another biological surfactant. For recent reviews on bile salts, see Garidel et al. (Reference Garidel, Hildebrand, Knauf and Blume2007) and the other articles in this special issue of ‘molecules’.
Pulmonary surfactant forms highly flexible monolayers on the surface of alveoli which are a prerequisite for their surface area changes upon breathing (see Seifert et al. Reference Seifert, Breitenstein, Klenz, Meyer and Galla2007 and references therein). Micro-organisms synthesise a variety of surfactants, such as glycolipids, lipopeptides and others. Such molecules could act as bioemulsifiers, increasing the bioavailability of water-insoluble substrates or regulating the attachment–detachment of micro-organisms to and from surfaces (Rosenberg & Ron, Reference Rosenberg and Ron1999).
Most antimicrobial peptides are commonly believed to act by permeabilising the membrane of the target organism. The specific mechanisms are still debated, but a detergent-like behaviour must be taken into account as one, possibly crucial effect in certain cases (Ladokhin & White, Reference Ladokhin and White2001; Hallock et al. Reference Hallock, Lee and Ramamoorthy2003; Bechinger & Lohner, Reference Bechinger and Lohner2006; Heerklotz & Seelig, Reference Heerklotz and Seelig2007). Graded leakage followed by an annealing of the membranes can be explained in terms of being induced by an asymmetric localisation of the peptide (causing, e.g. bilayer curvature strain). This has been found, for example, for transportan (Yandek et al. Reference Yandek, Pokorny, Floren, Knoelke, Langel and Almeida2007), PGLa (Wieprecht et al. Reference Wieprecht, Apostolov, Beyermann and Seelig2000) or surfactin (Heerklotz & Seelig, Reference Heerklotz and Seelig2007), whereas cecropin was shown to exhibit an all-or-none leakage (Gregory et al. Reference Gregory, Cavenaugh, Journigan, Pokorny and Almeida2008). Magainin induces dye efflux from vesicles that seems to be proportional to R b, suggesting a non-cooperative mode of action (Wieprecht et al. Reference Wieprecht, Beyermann and Seelig1999). A magainin analogue, MSI-78, has been suggested to perturb membranes by inducing positive curvature strain (Hallock et al. Reference Hallock, Lee and Ramamoorthy2003). Mellitin causes vesicle leakage at R b≈0·02 (Ladokhin et al. Reference Ladokhin, Selsted and White1997; Ladokhin & White, Reference Ladokhin and White2001). Experiments using entrapped dyes of different size revealed that mellitin forms small pores in POPC membranes (Ladokhin et al. Reference Ladokhin, Selsted and White1997) but larger or unspecific leaks are formed in POPC/POPG mixtures (Ladokhin & White, Reference Ladokhin and White2001).
Some ambiguity is caused in the literature by the fact that the term detergent-like effects of antibiotic activity is not clearly defined. Detergents are not known to form supermolecular arrangements with a fixed three-dimensional structure as expected for the barrel-stave model (Matsuzaki et al. Reference Matsuzaki, Murase, Fujii and Miyajima1996). A toroidal pore formed by peptides (Yang et al. Reference Yang, Harroun, Weiss, Ding and Huang2001) may be formed by a specific number of peptide molecules and thus be more specific than a detergent-induced pore; both agree, however, in the topology of the pore and its formation by a molecule covering and stabilising, along with lipid, the hydrophobic edges. Virtually all other phenomena of membrane permeabilisation can possibly be induced by detergents. This includes membrane thinning and decreased mechanical stability (making the membrane vulnerable to other perturbations), bilayer couple effects, toroidal pores (line tension and monolayer curvature effects) and membrane lysis (micellisation). These phenomena may give rise to transient or steady, graded or all-or-none leakage, and possibly size selectivity and channel-like behaviour (see Section 3.6).
Some bacterial lipopeptide surfactants such as surfactin or polymyxin show also inhibitory activity against parasitic mollicutes (Beven & Wroblewski, Reference Beven and Wroblewski1997). Surfactin forms micelles, partitions into lipid vesicles and destabilises them strongly (Heerklotz & Seelig, Reference Heerklotz and Seelig2001); unlike typical detergents, however, its peptide ‘head group’ is also partially hydrophobic so that it inserts partially into the hydrophobic core of the membrane, which may be the reason for its high activity and specific, chain-tilting effects on membrane order (Heerklotz et al. Reference Heerklotz, Wieprecht and Seelig2004b). A detergent-like mechanism was also proposed for the catalytic endotoxin Cyt1A (Manceva et al. Reference Manceva, Pusztai-Carey, Russo and Butko2005).
Whereas high concentrations of surfactants are haemolytic, low concentrations may be anti-haemolytic, i.e. they inhibit hypotonic haemolysis (Isomaa et al. Reference Isomaa, Hagerstrand, Paatero and Engblom1986; Sanchez et al. Reference Sanchez, Martinez, Infante, Mitjans and Vinardell2007).
Examples of other biologically relevant surfactants include lysolipids, fatty acids and acyl glycerols. An unspecific mechanism by which these and other surfactants may interfere with membrane function is the alteration of the spontaneous monolayer curvature. Biological membranes contain a variety of non-bilayer (negative spontaneous curvature) lipids that may have a variety of biological functions (for classical reviews, see Cullis & de Kruijff, Reference Cullis and de Kruijff1979; Epand, Reference Epand1998a, Reference Epandb). It was shown that different organisms regulate the spontaneous curvature of their membrane leaflets to a characteristic, negative value (Wieslander et al. Reference Wieslander, Christiansson, Rilfors and Lindblom1980; Gruner, Reference Gruner1985; Bhakoo & McElhaney, Reference Bhakoo and McElhaney1988; Rietveld et al. Reference Rietveld, Chupin, Koorengevel, Wienk, Dowhan and De Kruijff1994). Proteins such as protein kinase C (Giorgione et al. Reference Giorgione, Epand, Buda and Farkas1995) and cytidyl transferase (Davies et al. Reference Davies, Epand, Kraayenhof and Cornell2001) are activated by membranes with a negative spontaneous curvature. Kluge et al. (Reference Kluge, Gawrisch and Nuhn1987) showed that lysolecithin inhibits the infectivity of red clover mottle virus. LysoPC arrests exocytosis and membrane fusion (Vogel et al. Reference Vogel, Leikina and Chernomordik1993). Chernomordik et al. (Reference Chernomordik, Leikina, Frolov, Bronk and Zimmerberg1997, Reference Chernomordik, Vogel, Sokoloff, Onaran, Leikina and Zimmerberg1993) used and explained the effects of lysolipid and oleic acid on specific fusion intermediates in detail in terms of spontaneous monolayer curvature. Lysolipids also modify the mode of fusion peptide insertion into the membrane (Martin et al. Reference Martin, Dubois, Saermark, Epand and Ruysschaert1993). Farge (Reference Farge1994) and Rauch & Farge (Reference Rauch and Farge2000) suggested that endocytosis can be biologically regulated via the creation of a bilayer curvature strain by lipid flipases. Shape changes and vesiculation from erythrocytes upon addition of surfactants can also often be interpreted in terms of the bilayer couple model and curvature-inducing inclusions in the monolayers (Hagerstrand et al. Reference Hagerstrand, Holmstrom, Bobrowska-Hagerstrand, Eriksson and Isomaa1998; Schwarz et al. Reference Schwarz, Haest and Deuticke1999; Pantaler et al. Reference Pantaler, Kamp and Haest2000). Finally, curvature strains can facilitate or inhibit conformational changes in membrane proteins that change the ‘effective shape’ of the protein; examples are the photoactivation (Alves et al. Reference Alves, Salgado, Salamon, Brown, Tollin and Hruby2005) and oligomerisation (Botelho et al. Reference Botelho, Huber, Sakmar and Brown2006) of rhodopsin.
Given all these biological functions that are facilitated by curvature strains and thus regulated or at least affected by biological surfactants, one should expect that organisms tend to counteract curvature effects imposed by extrinsic surfactants. This has indeed been shown impressively already by Wieslander et al. (Reference Wieslander, Rilfors and Lindblom1986), who demonstrated in Acholeplasma laidlawii that the ratio between the main negative curvature lipid, MGDG, to the positive curvature lipid, DGDG, systematically increases with increasing positive curvature of detergents (CmEOn with m=12, 16 and n=3−12) added to their medium. Lactobacilli grown in bile salt containing medium showed a strongly enhanced content of lipids with unsaturated acyl chains (Taranto et al. Reference Taranto, Fernandez Murga, Lorca and De Valdez2003), another way of relaxing positive curvature strain.
5.2 Medical and cosmetic applications of surfactants
The surfactant-like properties of antibiotic peptides were discussed in the previous section. The membrane-permeabilising activity of synthetic detergents such as nonoxynol-9, BZK and SDS are used in spermicides and topical microbicides for preventing sexually transmitted diseases (Apel-Paz et al. Reference Apel-Paz, Doncel and Vanderlick2005). Cationic surfactants, including arginine-based lipoamino acids, show antimicrobial activity in the micromolar range which was found to be correlated with their activity to insert into lipid membranes (Castillo et al. Reference Castillo, Pinazo, Carilla, Infante, Alsina, Haro and Clapés2004). Alkylphosphatidylcholines are anti-cancer agents and oral medication with C16PC (brand name, Miltefosine) was shown to cure leishmaniasis (see Rakotomanga et al. Reference Rakotomanga, Loiseau and Saint-Pierre-Chazalet2004 and references therein). Other drugs such as the antipsychotic chlorpromazine or the antidepressant imipramine show surfactant-like behaviour including, for instance membrane permeabilisation (see Ahyayauch et al. Reference Ahyayauch, Requero, Alonso, Bennouna and Goni2002 and references therein).
Of course, topical applications of surfactants have to consider the potential toxic effects of surfactants on the skin. Wei et al. (Reference Wei, Geijer, Lindberg, Berne and Torma2006) determined the inhibitory concentrations of several technically relevant surfactants on keratinocytes. They also showed that the application of surfactants may alter the expression levels for enzymes involved in the biosynthesis of membrane components such as cholesterol, ceramides and fatty acids. A number of studies have addressed the specific properties of stratum corneum lipids interacting with surfactants (see, e.g. Cocera et al. Reference Cocera, Lopez, Coderch, Parra and de la Maza1999).
Reconstitution from mixed micelles has been a standard method for producing unilamellar vesicles of a desired size (Schubert, Reference Schubert2003), now primarily competing with extrusion techniques. The size of the vesicles may be chosen by adjusting the speed of detergent removal. This technique has also been used for entrapping compounds in liposomes. Lipid vesicles with a sub-solubilising content of bile salts were shown to retain an enzyme, Micrococcus luteus polynucleotide phosphorylase, but proved to be permeable to nucleotides (Treyer et al. Reference Treyer, Walde and Oberholzer2002). Bile salts were used to facilitate the loading of drugs into pre-formed liposomes (Schubert et al. Reference Schubert, Wolburg, Schmidt and Roth1991).
Surfactants are also directly used in drug formulations to solubilise the drug and aid its transport across barriers. Like other membrane-active compounds, surfactants may act unspecifically as transdermal penetration enhancers (Williams & Barry, Reference Williams and Barry2004). Furthermore, surfactants are an essential component of ultra-deformable liposomes (Transfersomes™) that overcome permeability barriers (such as human skin) driven by hydration energy and allow the administration of drugs into sub-dermal tissue or blood (for a review, see Cevc, Reference Cevc2004). Surfactants can also facilitate the transport of drugs or DNA across cell membranes. Aside from unspecific membrane permeabilisation, they may also enhance the net uptake of drugs by inhibiting multidrug resistance proteins (Alqawi & Georges, Reference Alqawi and Georges2003; Seelig & Gerebtzoff, Reference Seelig and Gerebtzoff2006). Positively charged surfactants form complexes with DNA which have lamellar or inverse hexagonal structures and can be used as vectors in gene therapy (Radler et al. Reference Radler, Koltover, Salditt and Safinya1997; Koltover et al. Reference Koltover, Salditt, Radler and Safinya1998). The dipalmitylated cationic peptide P2A2 is a specifically tailored surfactant comprising an arginine-rich, cell-penetrating peptide as a head group; it forms micellar aggregates which are internalised into living cells and solubilises lipid membranes extremely efficiently (Keller et al. Reference Keller, Sauer, Strauss, Gast, Dathe and Bienert2005a).
5.3 Use of surfactants for the isolation and investigation of membrane proteins
The isolation and investigation of membrane proteins is an extremely complex task that requires optimisation of the protocol to the protein, to the source membrane and to the method that is to be used to study the protein. So far, only relatively few, rather empirically optimised solutions were found for specific systems.
Membrane protein studies constitute a vast field and much of it is outside the scope of this review (see instead Gohon & Popot, Reference Gohon and Popot2003; Rigaud & Levy, Reference Rigaud and Levy2003; Prive, Reference Prive2007). Understanding the interactions of surfactants with lipid membranes, however, is one of the prerequisites for a more rational approach. Given the complexity of the task, typical solubilisation buffers often contain not only a single surfactant but co-surfactants, co-solvents and other components that stabilise the protein. For instance, neurotensin (Grisshammer et al. Reference Grisshammer, White, Trinh and Shiloach2005) and cannabinoid (Yeliseev et al. Reference Yeliseev, Wong, Soubias and Gawrisch2005) receptors can be isolated from Escherichia coli membranes by a buffer containing specific amounts of C12Malt, CHAPS, glycerol, Tris, NaCl and cholesteryl hemisuccinate. Other approaches are based on completely new types of surfactants. McGregor et al. (Reference McGregor, Chen, Pomroy, Hwang, Go, Chakrabartty and Prive2003) introduced lipopeptides comprising an alpha helix with two alkyl chains grafted to its ends. These specifically tailored ‘surfactants’ mimic quite closely the conditions of a protein in a membrane: the peptides form an oligomeric bundle surrounding the relatively ordered hydrocarbon chains (Kelly et al. Reference Kelly, Prive and Tieleman2005) (and, if present, the protein), the thickness of the hydrophobic part is well defined and the overall geometry is cylindrical with a minimum concentration of ‘surfactant’ and minimum size of the protein ‘micelle’ (Fig. 12). Gohon and Popot (Reference Gohon and Popot2003) provide a brief, yet impressive overview over the concepts of using amphipathic peptides (peptidergents), polymers (amphipols), tripod detergents and hemifluorinated surfactants. PEG-grafted cholesterol acts as a detergent but can be enzymatically cleaved into cholesterol, a physiological membrane component, and water-soluble ethylene glycol, thus inducing reconstitution (Chopineau et al. Reference Chopineau, Lesieur, Carion-Taravella and Ollivon1998).
Lipopeptides comprising an alpha helix with two alkyl chains attached to its ends as designed for membrane protein isolation by Privé and co-workers. Reproduced with permission from Macmillan Publishers Ltd, Nature Biotechnology (McGregor et al.), copyright 2003.

A number of the interactions of surfactants with lipid membranes discussed here belong, further to surfactant–protein interactions, to the criteria relevant to membrane protein studies (see also Lichtenberg et al. Reference Lichtenberg, Opatowski and Kozlov2000; Ollivon et al. Reference Ollivon, Lesieur, Grabielle-Madelmont and Paternostre2000). Partition coefficients and kinetics (usually governed by membrane permeability) are critical for surfactant removal. R bsat and R msol affect the amount of surfactant needed and the amount of lipid retained in the micelles. Reconstitution of the protein into proteoliposomes can, for example be achieved by surfactant extraction (bio beads, dialysis, gel filtration), dilution or temperature changes. Membrane leakage induced by a membrane permeant co-surfactant can facilitate the complete removal of an impermeant surfactant from vesicles. Both kinetics and the affinity of the protein for micelles versus membranes control the homogeneity of the distribution of proteins between liposomes formed upon reconstitution. The speed of reconstitution also controls the size of the vesicles. The crystallisation of membrane proteins that are highly enriched in a certain membrane can be induced by selective solubilisation of other membrane components (Vanderkooi et al. Reference Vanderkooi, Senior, Capaldi and Hayashi1972; Corless et al. Reference Corless, McCaslin and Scott1982). Bacteriorhodopsin was crystallised upon expulsion from a cubic phase (Landau & Rosenbusch, Reference Landau and Rosenbusch1996).
NMR studies suffer from the problem that the distribution of molecular orientations causes a broadening of the signals. There are two strategies to overcome this problem, isotropic averaging and macroscopic orientation, and both have been pursued using detergents. Membrane proteins that are solubilised in small micelles rotate much faster, thus giving rise to a narrower signal. A specific, macroscopic orientation is possible using so-called bicelle systems (Sanders & Landis, Reference Sanders and Landis1995; Sanders & Oxenoid, Reference Sanders and Oxenoid2000), which are dispersions of discoidal micelles or detergent-stabilised bilayer fragments. They are made of a mixture of a bilayer-forming lipid, such as DMPC, and a detergent, typically the micelle-forming, short-chain lipid D7PC. The surfactant forms a rim around the edge of the bilayer fragment, thus screening the hydrophobic part of the bilayer from water. Comprehensive studies using a large variety of methods have supported and refined this picture (Glover et al. Reference Glover, Whiles, Wu, Yu, Deems, Struppe, Stark, Komives and Vold2001; Luchette et al. Reference Luchette, Vetman, Prosser, Hancock, Nieh, Glinka, Krueger and Katsaras2001). What makes bicelles so useful is their property to align in a magnetic field (mostly with the bilayer normal preferentially perpendicular to the field). By choosing another composition (Loudet et al. Reference Loudet, Khemtemourian, Aussenac, Gineste, Achard and Dufourc2005) or by addition of lanthanides, bicelles can be oriented with their bilayer normal parallel to the field. Membrane proteins inserted into such bicelles will share essentially the same orientation with respect to the field, thus yielding rather well-resolved NMR signals.
5.4 Study of detergent-resistant membrane fractions
Yu et al. (Reference Yu, Fishman and Steck1973) have described already that membrane constituents could be selectively solubilised using cold TX100. Later, the hypothesis (Simons & Ikonen, Reference Simons and Ikonen1997) that biological membranes contain lipid-based, cholesterol-dependent functional domains (referred to as ‘lipid rafts’) that could be isolated as the DRM fraction by cold Triton has stimulated enormous interest and research efforts. The results and models on rafts are still not fully consistent and partially controversial; they are reviewed in detail by many authors (Edidin, Reference Edidin2003; Munro, Reference Munro2003; McMullen et al. Reference McMullen, Lewis and McElhaney2004; Simons & Vaz, Reference Simons and Vaz2004; Lichtenberg et al. Reference Lichtenberg, Goni and Heerklotz2005; London, Reference London2005; Jacobson et al. Reference Jacobson, Mouritsen and Anderson2007) and shall not be discussed here.
A thermodynamic background of ‘detergent resistance’ is that lipids preferring gel or ordered phases show a very weak partitioning into micelles so that extremely high surfactant concentrations are required to solubilise them (see Section 3.5). Whether DRMs are really obtained from a certain membrane, however, also depends on kinetic and technical aspects. Gel-like particles obtained from pure gel phases are too small to be recognised as ‘resistant’ by centrifugation or turbidity assays; these membranes are therefore referred to as ‘not resistant’. One may hypothesise that the specific role of cholesterol (or, alternatively, ceramide; Sot et al. Reference Sot, Bagatolli, Goni and Alonso2006) for DRM formation is not primarily to induce resistance but to render the resistant particles large enough for their detection and separation (Keller et al. Reference Keller, Tsamaloukas and Heerklotz2005b).
It seems widely accepted now that detergent resistance should not be considered a definition or strict evidence for in vivo rafts (see, e.g. the new definition published by Pike, Reference Pike2006) for a number of reasons. (1) It has been shown that detergents and other membrane-disordering molecules or moieties may induce domain formation in model membranes (see Section 3.5) which has also been observed in life cells (van Rheenen et al. Reference van Rheenen, Mulugeta Achame, Janssen, Calafat and Jalink2005). The latter authors showed that the addition of 0·0025% of TX100 to HEK cells did not kill or solubilise the cells but induced the clustering of previously randomly distributed PIP2, which has been considered a raft marker. (2) Preferential solubilisation of fluid phase-preferring lipids enhances the concentration of order-preferring lipids in the remaining unsolubilised membrane, which can induce domain formation (see Section 4.4). (3) Domains are altered if the temperature of isolation differs from the physiologically relevant temperature. (4) Lipids that are separated into different leaflets and membranes in vivo become mixed upon solubilisation, thus changing the structural preferences. (5) Surfactant-induced changes in line tension may induce the stabilisation and growth of critical membrane density fluctuations (which may be too short-lived to function as rafts) to macroscopic domains or ‘phases’.
Some of these problems upon isolating pre-existing domains could be avoided technically if a sudden addition of detergent at high concentration separates the domains so fast that there is no time for equilibration involving a re-sorting of molecules between domains and their reorganisation (London, Reference London2005; Staneva et al. Reference Staneva, Seigneuret, Koumanov, Trugnan and Angelova2005). This may be approximately achieved where pre-existing, macroscopic domains are concerned (as in certain model systems), but does not apply to the case when no or only nanoscopic domains are present in the respective membrane in vivo.
Hence, DRM isolation cannot detect the existence, size and dynamics of domains in vivo. It can, however, yield important information on the preferences of membrane constituents for (artificial) ordered, cholesterol-rich (cholesterol has many more effects than just ordering lipid chains) versus disordered domains. This means that if there are rafts in biological membranes that are governed by similar parameters and show similar behaviour as liquid ordered domains in model membranes, then DRM extraction is a method for estimating their possible contents.
6. Prospects
In spite of all the progress made in the past decades, there are many issues that remain unsolved today. New surfactants have become available that are not characterised yet. Dynamics may be crucial for applications but has been rather neglected compared to structural or thermodynamic studies so far. Thus, there is a need for ongoing fundamental work.
A major focus will be on functions and applications. After solving minor issues such as the human genome and the structure of about a thousand soluble proteins, a key task for bio-medical research has become to understand the structure, dynamics and function of membrane proteins. A broad, systematic and reasonably efficient tackling of this problem, however, suffers from the lack of rules for a rational choice of the optimum detergents, co-solutes and conditions for isolating a specific protein from a specific membrane environment to study the subject by a specific method. In other words, the field of surfactant–membrane interactions (which includes surfactant–lipid interactions and much more) is just turning from an exercise for pioneers and specialists into a rate-limiting step of biomedical and pharmacological progress.
Other challenges are applications of surfactant-like compounds as antimicrobial agents for topical and systemic application or the delivery of hydrophobic drugs to their target tissue. The regulation of proteins and biological processes by surfactant-induced changes in membrane properties will very likely become a much more acknowledged topic in the future, when biomembrane studies become more feasible.
All these promising goals will warrant and stimulate substantial research efforts in the future and will require new approaches, techniques and theories. They will have to consider complex systems of surfactants, lipids, proteins and other components, and their success may depend on being truly interdisciplinary. We will learn many new things; knowing the basics might be useful anyway.
7. Symbols and abbreviations
- A
area per molecule
- ANS
1-anilinonaphthalene-8-sulfonic acid
- ANTS
8-aminonaphthalene-1,3,6-trisulfonic acid
- ASA
(water-) accessible surface area
- Bet
betaine
- BZK
benzalkonium chloride
- C
molar concentration
- C10
decyl
- C11
undecyl
- C12
dodecyl
- C12TAB
dodecyl trimethylammoniumbromide
- C16SM
palmitoyl sphingomyelin
- C8-
octyl-
- CAC
critical association concentration
- Cer
ceramide
- CF
carboxyfluorescein
- Chol
cholesterol
- CMC
critical micelle concentration
- CnEOm
Oligo ethylene oxide alkyl ether, CH3(CH2)m−1 (O-CH2-CH2)nOH
- CnNO
alkyl dimethylaminoxides
- C p
heat capacity at constant p
- cryo-TEM
cryo transmission electron microscopy
- D7PC
diheptanoylphosphatidyl-choline
- DC
deoxycholate
- DHSM
dihydrosphingomyelin
- DiPoPE
dipalmitoleoyl PC
- DMPC
1,2-dimyristoyl-sn-glycero-3-phosphocholine
- DOPC
1,2-dioleoyl-sn-glycero-3-phosphocholine
- DOPE
1,2-dioleoyl-sn-glycero-3-phosphoethanolamine
- DPPC
1,2-dipalmitoyl-sn-glycero-3-phosphocholine
- DPX
p-xylene-bis-pyridinium bromide
- DRM
detergent-resistant membrane
- DSC
differential scanning calorimetry
- e 0
elementary charge
- EO
ethylene oxide
- EPC
egg yolk phosphatidylcholine
- ESM
egg sphingomyelin
- f
activity coefficient, see Eq. (Reference Alonso, Urbaneja, Goni, Carmona, Cánovas and Gómez-Fernández9)
- FA
fatty acid
- FOSMEA
dodecyl phospho-n-methylethanolamine
- G
molar Gibbs free energy
- g
Gibbs free energy
- GC
glycocholate
- Gluc
β-glycopyranoside
- H
molar enthalpy
- ITC
isothermal titration calorimetry
- K
partition coefficient or equilibrium constant in general
- K C
concentration-based partition coefficient, cf. Eq. (7)
- K R
mole ratio partition coefficient, Eq. (10)
- K Rapp
apparent partition coefficient, Eq. (27)
- K X
mole fraction partition coefficient, Eq. (5)
- LAM
forms lamellar phase
- LUV
large unilamellar vesicles
- lyso-PC
lysophosphatidylcholine
- Malt
maltopyranoside
- MD
molecular dynamics
- n
mole number
- n
number of groups such as EO, CH2
- N A
Avogadro's constant
- NaC
sodium cholate
- NBD-PE
(N-(7-nitrobenz-2-oxa-1,3-diazol-4-yl)-1,2-dihexadecanoyl-sn-glycero-3-phosphoethanolamine
- NMR
nuclear magnetic resonance
- p
pressure
- PC
(diacyl)phosphatidylcholine
- PEG-DSPC
polyethyleneglycol-distearoylphosphatidylcholine
- POPC
1-palmitoyl-2-oleoyl-sn-glycero-3-phosphocholine
- POPE
1-palmitoyl-2-oleoyl-sn-glycero-3-phosphoethanolamine
- POPG
1-palmitoyl-2-oleoyl-sn-glycero-3-[phospho-rac-(1-glycerol)]
- PS
(diacyl) phosphatidylserine
- PyrC
pyridinium chloride
- R
general gas constant, 8·31 J/(mol K)
- R m, R b, R e
mole ratio of surfactant to lipid in micelles (m), bilayers (b) or aggregates in general [e, cf. Eq. (34)]
- S
in acronyms for detergents: sulphate
- SANS
small-angle neutron scattering
- sarc. ret. ves.
sarcoplasmatic reticulum vesicles
- SBPC
soy bean phosphatidylcholine
- SDS
sodium dodecyl sulphate
- SDBS
dodecyl benzene sulfonate
- strat. corn.
mixture of typical stratum corneum lipids
- SUV
small unilamellar vesicles
- T
temperature
- TAC
trimethyl ammonium chloride
- TGluc
Thioglycopyranoside
- TX100
Triton X-100
- TX114
Triton X-114
- v
volume
- V
molar volume
- X
mole fraction
- z
signed charge number
- Ψ0
surface potential
- Δ
difference
- α
degree of solubilisation, Eq. (36)
- γ
accessibility parameter (see Section 2.5)
- ε0
permittivity of vacuum
- εr
dielectric constant
- μ
chemical potential
- μ0
standard chemical potential
- ρ0
non-ideality parameter, cf. Eq. (18)
- ρH0
non-ideality parameter for enthalpy, Eq. (23)
- σ
surface charge density
Indices and superscripts
- aq
in aqueous phase
- b
in the bilayer
- cyl
cylindrical micelles
- E
excess
- L
lipid
- m
in micelles
- S
surfactant
- sat
at the onset of solubilisation, boundary between bilayer and bil+mic range
- sol
at completion of solubilisation, boundary between bil+mic coexistence and micellar range
- sph
spherical micelles
- W
of water
- →
of transfer, e.g. ΔH Sw→b is the molar enthalpy of transfer of surfactant from the water into the bilayer
Acknowledgements
I dedicate this publication to the memory of Michel Ollivon, a great expert in lipid–detergent systems and most pleasant colleague who passed away much too soon. For valuable comments on the science and style of this manuscript, I am very much indebted to Felix Goñi, Sandro Keller, Gil Prive, Nardin Samuel and Alekos Tsamaloukas.



