

1 Introduction: the BRICS as an intriguing set for comparison
In the last 20 years or more, political scientists and sociologists have claimed that the Western world is suffering a crisis of political confidence (Pharr et al., Reference Pharr2000). Many believe that the crisis largely resulted from the declining economic prosperity of advanced nations after the 1970s (Lipset and Schneider, Reference Lipset and Schneider1983; Klingemann, Reference Klingemann and Norris1999; Newton, Reference Newton1999). If this is true, then the questions for scholars like me, who come from fast-growing economies, are: How do people in these countries respond to political institutions? Do people in the new emerging economies show the same pattern of political confidence? If not, how do we explain such variety?
In an attempt to answer these questions, I studied the BRICS. The acronym BRIC was coined by Jim O’Neill, an economist at Goldman Sachs, in a 2001 paper entitled ‘Building Better Global Economic BRICs’. First used by journalists as a trendy buzzword, some Western observers have tended to treat BRICS as a ‘mirage’ (Armijo, Reference Armijo2007); the BRICS did not gather at a summit within the first eight years after the term had been coined. Things changed in 2009, when a global financial crisis affected advanced Western economies. The ‘Big Four’, Brazil, Russia, India, and China, met in Yekaterinburg in 2009 and in Brasília in 2010. South Africa officially became a member nation on 24 December 2010, and the group was renamed BRICS – with the “S” standing for South Africa. These five nations have their first full member meeting in April 2011 in Sanya, China. The BRICS continues to be held: in India in 2012, South Africa in 2013, and Brazil in 2014. Observers believe that it will become a regular, rotating meeting. Political leaders in these five countries seem to have decided to use this catchy label, to launch a campaign to convince people that multipolar international politics is becoming unstoppable, as evidenced by the proposed BRICS development bank.
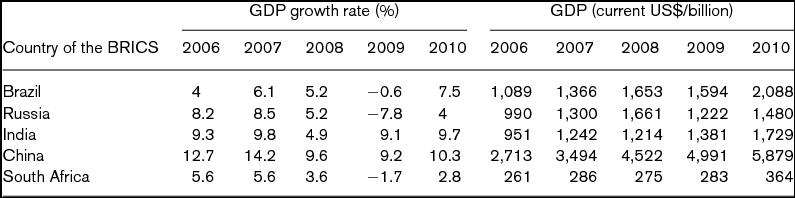
Confidence in this campaign comes from the growing economic might of its constituent members. In fact, the acronym BRICS has come into widespread use as a symbol of the shift in global economic power away from the developed G7 economies toward the developing world, though some commentators have been debating which country is more ‘qualified’ for membership.Footnote 1 Nevertheless, it is undeniable that these countries encompass over 25% of the world's land coverage and 40% of the world's population, holding a combined GDP of US$11.539 trillion in 2010. Furthermore, these countries are among the fastest-growing emerging markets in terms of the growth rate in GDP. Table 1 shows the 2006–10 growth rate for GDP and the GDP for the BRICS countries. Only data for 2006–10 are presented on account of the fact that two survey data sets from 2006 to 2008 are employed in the subsequent empirical analysis.
GDP growth rate and GDP of BRICS countries (2006–10)

Source: World Bank, World Development Indicators (http://data.worldbank.org/indicator/).
Nevertheless, a large number of commentators view the BRICS as a compelling set within a rigorous classical economic or a political science framework (Armijo, Reference Armijo2007). Indeed, from Table 1 we can see that their 2006–10 growth rates vary widely,Footnote 2 ranging from South Africa's modest rate, to the approximately 6% logged by both Brazil and Russia, to China and India's steadily astonishing rate above 9% even under the shadow of the world economic downturn. Other critics have suggested that, even before South Africa's join to the group, ‘BRIC’ is nothing more than a neat acronym for the four largest emerging market economics. Two are manufacturing-based economies and big importers (China and India), but two are huge exporters of natural resources (Brazil and Russia).
As far as political institutions are concerned, within the BRICS there is a deep cleavage between two subgroups: some are large emerging powers likely to remain authoritarian, and some others are so-called democracies. Although all are federal states, India, Brazil, and South Africa are representative democracies, either parliamentary or presidential. Russia is considered a ‘managed democracy’ under Putin's long-term rule, while China is described as having a ‘resilient authoritarianism’ (Nathan, Reference Nathan2003) or ‘politicized capitalism’ (Nee and Opper, Reference Nee, Opper, Nee and Swedberg2007).
The diversity within the BRICS, however, ironically provides justification for comparison – a conceptual homogenization of a heterogeneous domain for comparative study (Dogan, Reference Dogan2002). In other words, the similarities and differences among the BRICS nations lead to comparison among them. Obviously, largely due to their booming economies since 2006, political leaders in the BRICS nations show great confidence in playing roles as leading powers in the world. It is then natural to ask to what extent common people in these nations have confidence in their political institutions. More specifically, is there any difference between countries with better economic development (China and India, ‘Chindia‘) and those with a relatively weaker growth rate (Russia, Brazil, and South Africa), or between democratic countries (India, Brazil, and South Africa) and authoritarian countries (Russia and China). It would also be intriguing to explore whether some similarities in political confidence can be found from all these five countries.
After the release of data from relevant surveys (such as the World Value Survey) for 2010–11, a comparison of the political confidence of the people of the BRICS nations before and after the global financial crisis may be a more interesting topic. But due to data limitations, this paper does not aim to track the political confidence of the people of the BRICS nations on a long-term multiyear basis. In the next section of this paper, literature on political confidence, especially that related to emerging market economies, will be reviewed through two approaches, one sociocultural and the other micropolitical. I will deal with the concept and measurement issues of political confidence in the third section. Two sets of cross-sectional data, the Asia Barometer 2008 and the World Value Survey 2006–7, will be employed to describe and analyze variations in people's confidence in political institutions in the BRICS. The theoretical and practical significance of this research will be discussed in the last section.
2 Sociocultural and micropolitical: two complementary approaches
I have borrowed the distinction between the ‘sociocultural approach’ and the ‘micropolitical approach’ from Denters et al.'s (Reference Denters, van Deth, Montero and Westholm2006) summary of existing literature on confidence in political institutions. They argue that these two approaches are complementary. Certainly, other researchers have also suggested similar dual approaches. For example, to explain the decline of political support for state institutions in many Western democracies, Newton (Reference Newton2006) suggested two approaches: one is society centered, building on the concepts of social capital, trust, and civil society; the other is politics centered, focusing on the performance of the government and economy. In the next section, I will test the validity of these two approaches. In my article as an empirical question, some other variables will be introduced into this paper for either theoretical or practical reasons, which are not exactly the same as those discussed by Denters et al.
2.1 Sociocultural explanations
Comparatists increasingly rely on individual-level data to test theories. I will take into account some of the many recent attempts to provide empirical explanations of political confidence or trust.
Many scholars believe that sociocultural factors have a significant impact on political confidence. Many are members of the so-called social capital school, exemplified by Robert Putnam (Pharr et al., Reference Pharr2000; Pharr and Putnam, Reference Pharr and Putnam2000). The core argument of this school believes that political trust is a reflection of social trust. This alleged relationship, however, has not yet been shown in empirical research. Some scholars insist that the more people tend to trust others in general, the less they distrust politics (Schyns and Koop, Reference Schyns and Koop2010); conversely, the socially distrusting citizen is also suspicious of political institutions (Norris, Reference Norris1999; Pharr and Putnam, Reference Pharr and Putnam2000). On the other hand, there is a substantial body of research finding that generalized trust is not consistently or strongly associated with confidence in political institutions. For example, in a study of six Asian countries, Tan and Tambyah (Reference Tan and Tambyah2010) claimed that generalized social trust only has a positive but weak relationship with some political institutions, and with others, no relationship at all. Some scholars even doubt the general efficacy of the concept ‘social capital’ in recognizing trends for democracy in Asian countries (Inoguchi, Reference Inoguchi2004). As Kaase (Reference Kaase1999: 3) wrote, ‘The statistical relationship between interpersonal trust and political trust is small indeed.’
The factors that the social capital school takes into account, however, are not limited to social trust; rather, other factors are believed to influence individuals’ politicalization or socialization, especially age, gender, and educational level. A study of Norwegians shows that females, as well as seniors, are more likely to trust public institutions (Christensen and Lægreid, Reference Christensen and Lægreid2005). Other scholars believe that the consequences of early socialization persist over the life cycle, having a pervasive effect on the political attitudes and behavior of adults, including political confidence. In other words, the political confidence of the people will not grow stronger with age (Langton, Reference Langton1984). Nevertheless, I accept Newton's opinion (Reference Newton1999) that, in groups with different educational levels, ages, and genders, the distribution of people's trust is more or less random, because all individuals, regardless of their particular personality or social type, are influenced by political institutions. I will test whether differences exist in the political confidence of different age groups (the young, the middle-aged, and the senior) in the BRICS.
In addition, research in Western democratic countries show that the more education people receive, the more likely they are to believe their governments (Christensen and Lægreid, Reference Christensen and Lægreid2005). However, the validity of this argument can be questioned, for higher education may also cause more critical thinking or a ‘culture of critical discourse’, as put forth by Gouldner (Reference Gouldner1979). This is especially true when it comes to China and Russia, countries with strong communist legacies (Konrád and Szelényi, Reference Konrád and Szelényi1979). Therefore, I will test whether people with college degrees demonstrate greater trust or distrust in politics.
All the variables discussed above have received much attention from the theories of socialization or social capital. Some other sociocultural factors, however, should be included in the analysis as well: for example, people's happiness and satisfaction with their living standards. Some scholars have found that people's life satisfaction has a positive effect on their political trust, but these scholars consider such satisfaction to be an institutional factor (Wong et al., Reference Wong, Michael Hsiao and Wan2009). In my view, despite the influence of the institutional factors, the extent to which people feel happy or satisfied with their lives is still a subjective, cultural experience, so I classify this fact as sociocultural. Moreover, existing findings on the relationship between happiness and political confidence are contradictory. For example, in the view of Lipset and Schneider (Reference Lipset and Schneider1983), the decline of political confidence in the West is due to people's dissatisfaction with their lives, but other scholars claim that people in the United States and the EU countries with greater confidence levels also enjoy higher happiness levels (Baltatescu, Reference Baltatescu2005). Brehm and Rahn (Reference Brehm and Rahn1997) conclude that Americans transfer unhappiness with their own lives into confidence in the federal institution. Logically, these two opinions from Baltatescu and Brehm and Rahn are both reasonable. On the one hand, it is a logical idea that there is a significant correlation between trust in governmental institutions and happiness or life satisfaction. On the other hand, field research I conducted in the past in a rust belt city in China shows that those who think their lives are unfortunate tend to pin their hopes on a strong state. Thus, I will use empirical data to systematically test the relationship between happiness or life satisfaction and political trust.
Finally, I will examine the impact of people's occupations on political trust. As one of the most important indicators of social-class identities, occupation also reflects people's economic status. Some studies show that people working in public institutions have more confidence in the government (Christensen and Lægreid, Reference Christensen and Lægreid2005), but, due to data limitations, I was not able to verify this contention. What will be tested in this paper is the impact of occupational status, such as being unemployed, employed, a student, retired, or homemaker, on political confidence. According to one perspective, the development of the welfare state offsets the negative impact of unemployment on confidence in the government – some even claim that class-based politics has disappeared (Gorz, Reference Gorz1997; Eley and Nield, Reference Eley and Nield2000). However, through data from the Eurobarometer survey, Bay and Blekesaune (Reference Bay and Blekesaune2002) point out that the unemployed youth express less confidence in politics. Unemployed teenagers less often discuss politics and more frequently support politically radical ideas, compared with employed youth. Another study also shows that British class-based politics is not dead, and, on the contrary, people's occupations are closely tied to their support of particular political positions (Hibbs and Vasilatos, Reference Hibbs and Vasilatos1982). Compared with Western advanced industrial countries, the BRICS countries have not established sound social welfare systems. The unemployed, retired people, and homemakers are more vulnerable. Thus one of my concerns in this paper is to test these arguments.
2.2 Micropolitical explanations
Some scholars have argued that political variables, rather than sociocultural variables, are most important for explaining political confidence (Anderson and LoTempio, Reference Anderson and LoTempio2002). This argument needs to be further tested to see whether it applies to the BRICS.
There are two kinds of political origins for confidence: macropolitics and micropolitics. Macropolitical factors are typically about the ‘objective’ characteristics of politics. Employing macropolitical factors in comparative studies in principle is similar to contextualized comparison in qualitative analysis (Locke and Thelen, Reference Locke and Thelen1995), but in quantitative analysis, researchers often adopt a more straightforward approach by using the actual economic performance indicators of governments (McAllister, Reference McAllister and Norris1999) or the degrees of political freedom (Norris, Reference Norris1999) to explain the difference in people's confidence in politics. Yet, the possible problem with this approach, as put forth by Denters and his colleagues, is that the validity of the macroexplanation is subject to the number of countries to be explained (small N) (Denters et al., Reference Denters, van Deth, Montero and Westholm2006: 82). Thus, in this article the analysis will focus on the microlevel.
Most scholars deem personal political orientation to be the most important element of a micropolitical factor. In this paper, political orientation is measured with three variables. These are political spectrum, level of pride in nationality, and subjective assessment of the importance of party membership in one's own life. Some scholars have pointed out that the left wing has maintained its tradition of supporting a stronger state for public institutions; that is, the more people land on the left end of the spectrum, the more confident they feel in political institutions. In fact, a number of empirical studies have proved that people's leftward or rightward inclinations constitute a consistent and important variable that influences people's confidence in political institutions (Christensen and Lægreid, Reference Christensen and Lægreid2005; Rudolph and Evans, Reference Rudolph and Evans2005).
In addition, I also argue that the more proud people are of their nationalities, the more confident they are in their governments. This proud-of-nationality variable (patriotism) has been used in some research (Newton, Reference Newton2006), but not as a frequently used variable in other research. What pushes me to employ this variable is the emigration wave among China's wealthy; many are not satisfied with their nationality, and instead move elsewhere (mostly United States and Western European countries). I believe that this is actually the result of a lack of confidence in political institutions of their country, a hypothesis that will be tested within all the BRICS nations.
In addition, in this article I will examine the subjective assessment of the importance of party membership in one's own life, a less common variable in previous research. Uslaner and Brown (Reference Uslaner and Brown2005) claim that trust is not important for most forms of civic engagement across a wide variety of surveys. However, political parties are not an ordinary civic engagement as NGOs or trade unions. In fact, the so-called ‘democracy crisis’ in the Western world has been caused to a great extent by people's dissatisfaction with party politics. Some scholars have pointed out that a negative rejection of political parties as undesirable institutions may spill over to citizen evaluations of government more generally (Miller and Listhaug, Reference Miller and Listhaug1990). In the democratic BRICS (such as India, Brazil, and South Africa as well as the allegedly ‘managed democratic’ Russia), it is subject to considerations of political awareness rather than an obligation or economic pragmatism. People who have more sympathetic attitudes toward a political party may more actively take part in political activities, but empirical materials are needed in order to test whether those people have more confidence in political institutions. In addition, in a country like China, the membership of a political party may also be linked to the nature of its political system. Many observers believe that pragmatic considerations are causing more and more people to join the party, rather than trust in the political system. I will also test this opinion in my research.
3 Research design
3.1 Merging the data sets
An ideal data set for this paper would be panel data or several cross section data sets with comprehensive items for all the BRICS countries for consecutive years. However, this kind of data, to my knowledge, does not exist. I have therefore constructed an alternative data set for the BRICS countries by combining two widely used data sets, the Asia Barometer Survey (ABS) and the World Value Survey (WVS).
The ABS is currently the largest regional opinion survey conducted in East, Southeast, South, Central, and some Pacific Asian countries (Inoguchi, Reference Inoguchi2005). To date, six consecutive annual surveys (from 2003 to 2008) have been completed in 27 countries and two regions. The ABS primarily employs a multistaged stratified random methodology for all of its surveys. Typically, face-to-face interviewing is used. The respondents in the ABS have been reported to be fairly representative of their respective national populations (more details can be found at http://www.asiabarometer.org).
The WVS is a global research project that explores people's values and beliefs. It is carried out by a worldwide network of social scientists who, since 1981, have conducted representative national surveys in almost 100 countries. The WVS uses the sample survey as its mode of data collection, a systematic and standardized approach to collecting information through interviewing representative national samples of individuals (more details can be found at http://www.worldvaluessurvey.org).
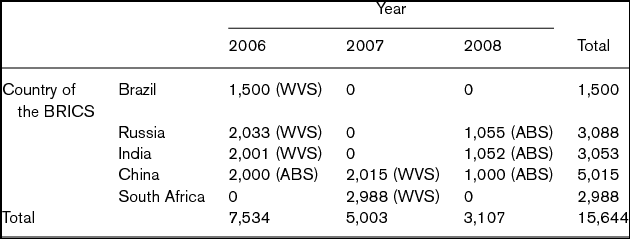
From the ABS, I adopt data from Russia, India, and China in the 2008 survey.Footnote 3 Sample sizes in these three countries were 1,055, 1,052, and 1,000, respectively; in addition, Chinese data from the 2006 survey (with a sample size of 2,000) are introduced, making a total of 3,000 Chinese respondents. In the WVS, I adopt the 2005–07 wave data, including those of Brazil in 2006 (with a sample size of 1,500), Russia in 2006 (with a sample size of 2,033), India in 2006 (with a sample size of 2,001), China in 2007 (with a sample size of 2,015), and South Africa in 2007 (with a sample size of 2,988). As a result, sample size of the final database is 15,644 in total (see Table 1). This database has the advantage of a large-enough sample size, though the sample size for Brazil is relatively small.
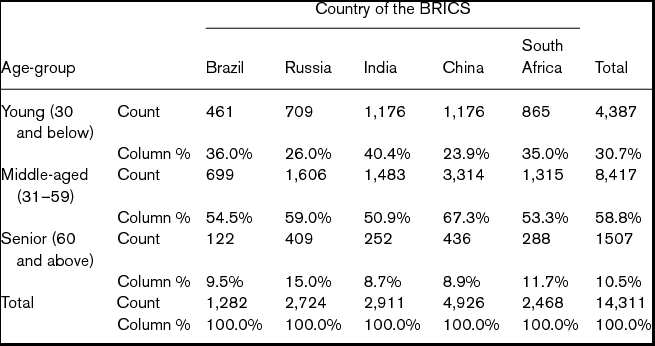
On this basis, after deleting the samples of respondents under 18 and over 80 years old in the year of this survey, I have 14,311 respondents left (see Table 3 for composition of the respondents for different age groups). Among the respondents with known ages, 4,387 (30.7%) are defined as ‘young’, that is, people under 30 years old. In addition, 8,417 people (58.8%) aged 31 to 59 are classified as middle-aged because 60 is the primary retirement age in many countries.Footnote 4 People 60 and over are defined as seniors; they total 1,507 (10.5%).
Composition of the BRICS Countries in ABS and WVS (Frequency)a
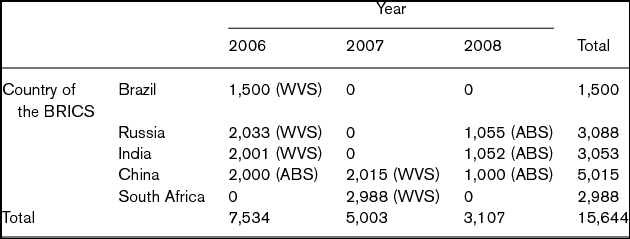
Note: a Countries are ordered by their first letter in this and all other tables in this article.
Source: Asia Barometer 2006–8 and World Value Survey 2006–8. The same source will be used in the rest of the article.
Size of sample and composition of age-groupa
Notes: a The age-group is coded based on respondent's age in the year of survey.
b The oldest and youngest respondents were born in 1937 and 1988, respectively.
Of course, before combining the two databases, I have done some necessary recoding of the variables. In addition, some nuances of the questioning approaches in the ABS and WVS are reasonably ignored. More details of the combination will be introduced in Section 3.3.
3.2 Dependent variable
The dependent variable in the research is an additive index to measure respondents’ confidence in four political institutions. As some scholars have argued, the word ‘trust’ should be reserved for attitudes towards individuals, whereas ‘confidence’ should apply to institutions (Zmerli et al., Reference Zmerli, van Deth, Montero and Westholm2006). Therefore I use ‘confidence in political institutions’ or ‘political confidence’ to conceptualize those corresponding items in both the ABS and the WVS, in which respondents were asked to indicate the level of confidence they have in various institutions to operate in the best interests of society (from 1 = A great deal of confidence to 4 = Not confident at all).Footnote 5
Only seven items are overlapping in the ABS and the WVS: central government, army, police, parliament, political parties, labor unions, religious organizations, and the United Nations (UN). The UN has been eliminated from this research on the grounds that it is the only international institution. Exploratory-factor analysis shows that two items (labor unions and religious organizations) by themselves create a component. However, considering that components should have more than two items or variables, variables of labor unions and religious organizations are not composed into an index, not to mention the fact that these two are not traditionally defined as political institutions. Then I run a factor analysis and a reliability test for a tentative index composed of central government, army, police, parliament, and political parties. The item of army, which by its nature in some countries is usually viewed as dependent from political institutions while in some (like China) it is not, is removed on the grounds that its value of communalities extraction is too low (0.297) and that Cronbach's alpha would be considerably improved if item were deleted (from 0.742 to 0.801).
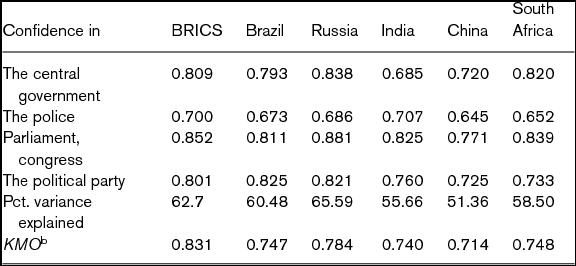
Furthermore, principal component analysis of responses to the four items reveals a single dimension in all the BRICS countries (see Table 2). This echoes other studies (Christensen and Lægreid, Reference Christensen and Lægreid2005; Zmerli et al., Reference Zmerli, van Deth, Montero and Westholm2006) finding that political confidence in these institutions are interconnected, that is to say, confidence in any one institution is likely to be repeated for all others. Table 5 also shows that the percentage of variance explained is systematically high and KMO measures reveal an excellent degree of fitness for the interrelationships among the different institutions.
Component matrix of confidence in political institutions
Notes: a Entries are loadings on the first component.
b KMO is the Kaiser–Meyer–Olkin measure, which indicates to what extent the variables included in the scale fit the underlying criteria. The KMO measure should be greater than 0.6.
c The Bartlett's test is significant in all the countries.
Profile of Respondents in the BRICS Countries
Notes: a For the last five items, figures in bold are means. Figures in parentheses are standard deviations. The lower the means, the higher level of pride, evaluation of standard living, or general happiness.
b Political spectrum values from 1 to 10, from left-wing to right-wing. The higher the value is, the more right-wing.
I then build an additive index by combining central government, police, parliament, and political parties. Respondents who refused to answer these questions are recoded as ‘system missing’. This index ranges from 4 (indicating the lowest level of confidence) to 16 (indicating the highest level of confidence). The reliability coefficient among these items is 0.801.
3.3 Independent variables, general hypotheses, and methods
In order to explain the level of confidence in political institutions among the BRICS, I choose two sets of explanatory variables. The first is sociocultural factors, and the second is micropolitical factors. A classical multiple regression will be used as the method to test these hypotheses proposed in the next section. Rather than providing a systematic theoretical account of the sources of political confidence, my aim is to confirm whether the multivariate analysis can help us to reveal the effects of sociocultural and political factors. In general, I assume positive attitudes towards political institutions are significantly influenced by both their sociocultural and micropolitical values/actions.
3.3.1 Sociocultural factors
Sociocultural factors are further divided into three categories: subjective evaluation, objective condition, and demographic factors. Subjective evaluation is made of three variables: general trust in people, general happiness, and evaluation of standard of living. The relationship between social trust and confidence in political institutions, as discussed in the last section, is a perennial topic for political scientists and sociologists. The measurement of ‘social trust’, however, is still quite challenging due to various limitations of data sets (Zmerli et al., Reference Zmerli, van Deth, Montero and Westholm2006). Many researchers, at best, use two or three variables to measure it by combining them into an additive index (Denters et al., Reference Denters, van Deth, Montero and Westholm2006; Tan and Tambyah, Reference Tan and Tambyah2010). Unfortunately, I have only one variable, though the most widely used one, to employ in my merged data set: general trust in people is measured by Q12 in the ABS, ‘Generally, do you think people can be trusted or do you think that you can't be too careful in dealing with people (that it pays to be wary of people)?’ Two options are provided: one is ‘Most people can be trusted’ (recoded as 1) and the other is ‘Can't be too careful in dealing with people’ (recoded as 0). The difference of tone in its counterpart question (V23) in the WVS can be ignored.Footnote 6
In the WVS, the question for the general happiness is: ‘Taking all things together, would you say you are (1) very happy, (2) rather happy, (3) not very happy, or (4) not at all happy?’. Fortunately, in the ABS, the question is almost the same: ‘All things considered, would you say that you are happy these days?’. Unfortunately, the answer is a five-point scale, from ‘very happy (1)’, ‘quite happy (2)’, ‘neither happy nor unhappy (3)’, ‘not too happy (4)’, to ‘very unhappy (5)’. In order to combine the two questions, I have to recode answers of 3 and 4 in the WVS into 4 and 5, respectively, and recode ‘don't know’ into 3. Thus in both data sets, I have a five-point scale to measure general happiness. I then convert the direction of the values, making the larger value represent higher level of happiness.
In the ABS, respondents were asked, ‘Please tell me how satisfied or dissatisfied you are with your standard of living’. The option is a typical Likert five-point scale, from ‘very dissatisfied’ to ‘very satisfied’ – I recoded the answers, making the larger value represent higher level of satisfaction. In the WVS, however, the question is different. A scale of incomes was shown to the respondent, on which 1 indicates the lowest income decile and 10 the highest income decile. Respondents were required to specify the appropriate number, counting all wages, salaries, pensions, and other income. This is very different from the ABS, but both to a large extent measure respondents’ subjective feeling about their economic standard. In this study, I convert this ten-point scale to a new five-point scale straightforwardly, as Rajan Sambandam (2006) suggested, that is, ratings of 10 and 9 are converted to 5, ratings of 8 and 7 are converted to 4, and so on.
The objective position of respondents is measured by their working conditions. In both the ABS and WVS, the questionnaires contain options for respondents’ occupations. Four options can be considered the same in the two data sets: homemaker, student, unemployed, and retired.Footnote 7 People who have a job, however, were measured by extremely different categories in the two surveys. Therefore, these occupations are all recoded as ‘employed’. Then I have a categorical variable, ‘occupation’, with five levels, that is, retired, employed, homemaker, student, and unemployed.
In order to include this variable in a multiple regression prediction model, an additional step, dummy coding, is needed to ensure that the results are interpretable. Since this variable contains five levels, four dummy coded contrasts are created: employed, homemaker, student, and unemployed. These dummy codes are entered into the regression model in a single block.
‘Gender’ and ‘age in the year of survey’ as demographic variables are easy to understand. Gender is a dichotomous variable. ‘Age’ is a scale variable. Both of them can be directly introduced into the model. ‘College degree’, another dichotomous variable, is designed to measure whether the respondents have received college-level education, including junior college education. It is noteworthy that an educational-level variable of multiclassification can be considered as an ordinal variable and thus directly introduced into the model. However, due to the greatly differencing approaches to measuring educational level between the ABS and WVS, the two have to be merged into the variable of ‘college degree or not’ as dichotomous. Among them, the junior-college level is matched with ‘some university without degree/higher education – lower-level’ in the WVS, and with ‘some years of college’ (Russia), ‘graduation/postgraduation general/professional’ (India) and ‘college school’ (China) in the ABS.
3.3.2 Micropolitical factors
A large body of literature has found that micropolitical variables may affect people's political attitudes. I therefore examine the potential impact of three variables. Two of them are scalelike variables: political spectrum and level of pride in nationality.
For the political spectrum, the questions and options in the ABS and the WVS can be considered the same. Respondents were asked a question like, ‘In political matters, people talk of “the left” and “the right”. How would you place your views on this scale, generally speaking?’, with a ten-point scale option to fill in. The larger the number is, the closer to the right wing the respondents placed themselves.
Pride in nationality is measured by a five-point scale question on how proud the respondent is of a his or her nation, ranging in both surveys from something like ‘very not proud’ to ‘not consider as this nation's people’. Again, I altered the direction of the values, making the larger value to represent a higher level of proud feeling.
The remaining variable – ‘importance of political party’ – is dichotomous. In the ABS, there is a series of questions asking, ‘Which of the following social circles or groups are the most important to you?’. Respondents who chose yes for political party are coded as 1 in the new variable ‘political party important as a social circle or group’, while other answers are coded as 0. The question in the WVS is phrased, ‘Could you tell me whether you are an active member, an inactive member, or not a member?’ of several types of organizations, including political parties. The last two options, ‘inactive’ and ‘not a member’, are then recoded by the author as 0, and people who respond ‘active member’ are regarded as thinking of their political party as an important social circle or group in their life. The coding is quite conservative because I do not label it as ‘the most important’.
4 Results
4.1 Descriptive characteristics of sample
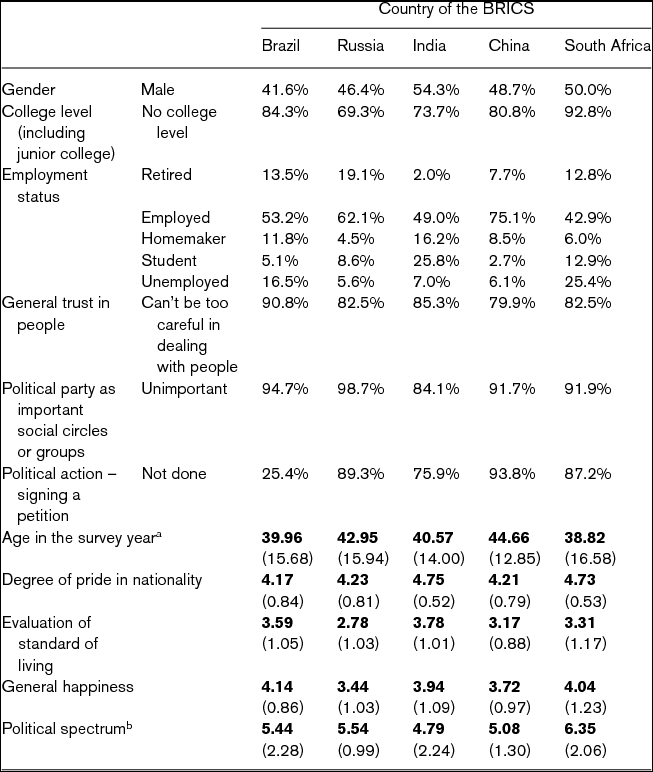
Table 5 reports descriptive statistics of the respondents in terms of these sociodemographic and political attributes. One of the most impressive findings is that in all the BRICS nations, people's general trust in each other is clearly low. The percentage of people who feel that they must be ‘careful in dealing with people’ is above 80% in almost all of the countries: 79.9% for China, the country with the highest level of trust in people, and 90.8% for Brazil, the country with the lowest level, which is in line with many previous research findings. For example, Lagos (Reference Lagos2001: 142–3) argues that in Brazil, which has one of the highest crime rates in the world, trust has practically disappeared, plummeting from 11% in 1996 to 4% in 2001. This ‘common regional heritage of distrust’ continued in 2005. Other research reports less than 10% of Brazilians claim that most people can be trusted (Delhey and Newton, Reference Delhey and Newton2005).
With respect to educational level, in all the five countries, at least 70% of the samples had not received higher education. Among them, samples in South Africa have a higher-education percentage as low as 7.2%, while those in Russia and India have the two highest percentages, 30.7% and 26.3%, respectively.
In addition, the characteristics of the political status and behaviors of samples in the five countries are in line with my expectation: most of the respondents do not view parties as the most important organizations or circles in their lives. Furthermore, respondents in the five countries show a strong sense of pride, with the value of the mean above 4.0.
With respect to employment, the highest rate of employment is found in China, reaching 75.1%; in other countries, except for South Africa, the rates of employment are all above 50%. In turn, among the BRICS, South Africa has the highest rate of unemployment, reaching 25.4%, which is followed by Brazil's rate, 16.5%. Another point worth noting is that percentage of students among respondents from India reached 25.8%, which might be higher than its actual proportion.
With respect to assessment of living standards and general happiness, the average assessment result of general happiness in all the countries is higher than that of living standard (all with five-point scale), which confirms my previous statement that happiness is an assessment of factors beyond living standard. In horizontal comparison among the countries, Russia has the lowest value among the BRICS at the two indicators (with means of 2.78 and 3.44, respectively). The second most pessimistic group of respondents is the Chinese, with means of 3.17 and 3.72, respectively, on the two indicators. This was unsurprising. Researchers have pointed out that, although China's economy is growing fast, people's happiness has been declining. This finding to some extent proves the relative deprivation theory and the concept of frustrated achievers (Brockmann et al., Reference Brockmann, Delhey, Welzel and Yuan2009). Interestingly, the Brazilians (with a mean of 4.14) and South Africans (with a mean of 4.04) have the strongest sense of general happiness, in line with people's general impression of Latin Americans and Africans.
4.2 Sample political profile
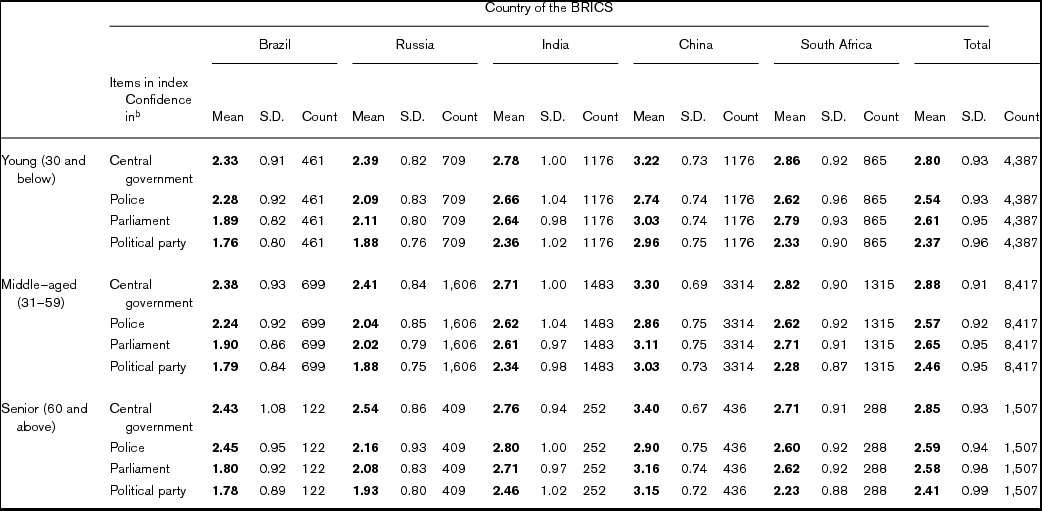
Table 6 shows the statistical distributions of confidence in four political institutions among three age groups: youth, the middle aged, and seniors. The first important finding from the table is that there is no significant difference in political confidence among the three different cohorts. For most of the items, means of confidence in the three age groups are close to each other. In other words, age is not a significant factor in respondents’ confidence in political institutions.
Distribution of Additive Index and Average Political Confidence Scores by Countries (1980 Cohort)a
Notes: a Means of ratings on scale ‘1 = Not confident at all’ to ‘4 = A great deal of confidence’. The higher the means is, the higher level of confidence in a particular institution.
b The four items are combined to form an additive index to capture a collective profile of respondent's confidence in political institutions.
However, this does not mean that respondents of different age groups have no difference at all. Some nuances do exist. For example, in terms of confidence in the central government, Table 6 clearly shows that the mean value gets stronger as the age group grows more senior among Chinese respondents, from 3.22 of the youth group to 3.30 of the middle-aged group, and finally to 3.40 of the senior group. The same trend is found among Chinese respondents in terms of trust in the ruling party, with means of 2.96, 3.03, and 3.15 for the three cohorts. Russians, with means of 2.39, 2.41, and 2.54, and Brazilians, with means of 2.33, 2.38, and 2.43, are similar to the Chinese in terms of confidence in the central government, that is, that confidence grows with the seniority of the age group. It is interesting, however, that among South Africans, the younger the age group is, the higher the confidence (with means of 2.86, 2.82, and 2.71).
Moreover, Table 6 clearly shows that by comparing the countries, the values of the mean in all four political institutions for the Chinese are higher than those for the other four countries. Clearly, China has the highest level of confidence in political institutions. In addition, people's average confidence in the other three political institutions is obviously lower than their confidence in the Chinese central government. This result to some extent is consistent with other research – the Chinese generally have a higher level of confidence in both the central government and political parties than people from other countries (Tan and Tambyah, Reference Tan and Tambyah2010).
The confidence level of the Chinese, however, is not always the highest for all the institutions. For example, respondents from China, regardless of age, show the lowest level of confidence in religious organizations among the BRICS. In fact, the level of confidence in religious organizations of respondents from Brazil, South Africa, and India are far higher than the level of the Chinese (means of the three countries are almost all above 3.0). This is perhaps due to the weak tradition of religious beliefs in China and the poor reputation of Chinese religious organizations. More detailed data on this issue are not presented in this paper because religious organizations are not included in the average political confidence score sheet of the regression equation.
Returning to our discussion of the four types of political organizations, it is very interesting to note that for most institutions, the confidence level of Indians ranks as moderate among the BRICS, closest to the mean. In all the 12 horizontal comparisons, only four are exceptional, including the confidence of the young group in the police (2.66), the confidence of the young group in political parties (2.36), the confidence of the middle-aged in political parties (2.34), and the confidence of the senior group in the central government (2.76). In these four groups, the Indians’ confidence is over that of South Africans, while in the other eight groups, South Africans’ confidence is over that of Indians as well as Russians and Brazilians, ranking them second, weaker only than that of the Chinese.
The weakest confidence in political institutions is found with Brazilians and Russians. All institutions, except for the police, receive the lowest level of confidence among all the age groups in the two countries, naturally far lower than the mean. The Russians have the lowest confidence in the police, which is surprisingly similar across all age groups. In addition, the confidence of Brazilians in the central government and the police is higher than in the two representative democratic organizations (the parliament and political parties). Russians are similar to Brazilians in this aspect, with the lowest confidence in political parties.
Findings from Russia and Brazil are in line with claims made by other scholars. For example, in an article written in 1997 based on the New Democracies Barometer surveys, Mishler and Rose demonstrate that in postcommunist Europe, including Russia, skepticism, rather than distrust, predominated (Mishler and Rose, Reference Mishler and Rose1997). This skepticism did not fade ten years later when Russia's economic and political performance improved, according to Shlapentokh's research (Reference Shlapentokh2006). He claims that in terms of their lack of confidence in social institutions, particularly political institutions, Russians are behind not only the most advanced countries in the world, but even countries known for their unstable political systems, such as Colombia or Nigeria. Yet Russia might not have the lowest political confidence. Lagos (Reference Lagos2001: 142) insists that levels of institutional trust in Latin America are not really any higher than the low levels recorded in postcommunist Europe; rather, Latin Americans manifest some of the lowest levels of interpersonal trust observed anywhere in the world.
4.3 Regression result
My goal in the remainder of this article is to explain variation in confidence in political institutions. Even though the level of political confidence varies from country to country, the effective variables are proved to be rather similar, with only sporadic variations in some factors.
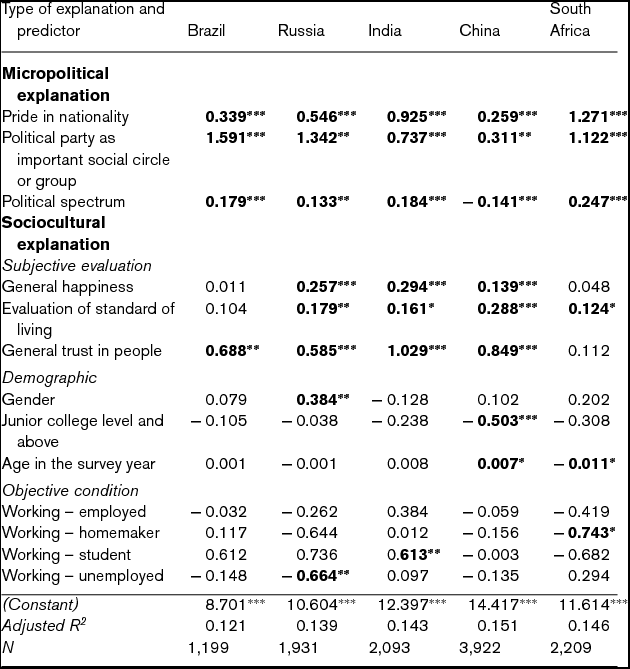
As shown by the adjusted summary R2 coefficient, the regression models in each case explain only a limited amount of variance in institutional confidence. But still, we can draw some conclusions from Table 7, bearing in mind the need to look elsewhere in future studies. The first main conclusion is that both the sociocultural approach and the micropolitical approach show strong explanation effects, although the explanation effect of political factors is more consistent and significant. The four political variables are all significant in all five countries (p<0.001). With respect to the sociocultural approach, variables of subjective assessment in China, India, and Russia are more significant than those of Brazil and South Africa.
Sociocultural and Micropolitical Explanatory Variables for Confidence in Political Institutes of BRICS Countries (OLS Estimates)
Notes: a * p < 0.05, ‘* p < 0.01, *** p < 0.001.
b The tolerance is above 0.1 for all the variables, mostly between 0.7 and 0.9. Variance inflation factor (VIF) is less than 5 for all.
More concretely speaking, the positive associations between pride in nationality and confidence in the political institutions is particularly strong in all BRICS nations (p<0.001). Table 7 shows clearly that the prouder the respondents feel about their nations, the more likely they are to report high political confidence.
Regarding political party membership, participants who view the party as an important social circle were more likely to express confidence in political institutions in all the BRICS countries (p< 0.01 in China and Russia, while p<0.001 in Brazil, India, and South Africa). As discussed in the last section, active membership in political organizations is always thought to be important for enhancing political confidence. This might be particularly true in the countries where citizens can choose to join a political party more voluntarily, like in Brazil, India, and South Africa – though some researchers have demonstrated the strong role of the state in mobilizing people to engage with political organizations in contemporary Brazil (Côrtes et al., Reference Côrtes2011).
Among the remaining attitudinal micropolitical variables, the respondents’ positions on the left wing–right wing self-placement scale proved to be a strong predictor of institutional confidence. However, it is interesting that the explanatory power of the political spectrum is different in China relative to other BRICS countries. In Brazil, Russia, India, and South Africa, people reporting themselves to be furthest to the left report the least political confidence, which echoes other research on the democratic regimes (Christensen and Lægreid, Reference Christensen and Lægreid2005; Rudolph and Evans, Reference Rudolph and Evans2005). In China, however, the direction is completely opposite: the right wing shows the lowest level of political confidence. This result is understandable given that the ruling party and official ideology in China is still communist; therefore the ‘leftists’ might be more politically confident. Yet, we should bear in mind that the Chinese have a quite different, sometimes opposite, concept of ‘left’ and ‘right’ from Westerners. For many Chinese people, ‘the right wing’ equals ‘liberal’, which is usually labeled as the ‘left wing’ in the West, while those who are more sympathetic to Maoist beliefs are widely called ‘conservatives’ (Mierzejewski, Reference Mierzejewski2009). In other words, a scale of ‘conservative’ and ‘liberal’ might be much less confusing than the one of ‘left’ and ‘right’ for Chinese respondents.
In the aspect of sociocultural factors, the results of multiple regression analyses show that a high level of general happiness is positively associated with confidence in political institutions in all BRICS nations except for Brazil. Furthermore, people who are satisfied with their living standard expressed a high level of confidence in Russia, China, and India (p < 0.001). Last but not least, the results presented in Table 7 also confirm a strongly positive and significant relationship between social trust and confidence in four out of the five nations being compared.
In addition, the overall pattern by gender, junior college level, age, and occupation displays a sporadic significant relationship across each model. Gender shows significant influence only in Russia: women in Russia are nearly 3.8 times more likely than men to have confidence in political institutions. Respondents with a junior-college education or above in China are more skeptical about political institutions. Political confidence tends to be marginally higher among older people in China and marginally lower among seniors in South Africa. Meanwhile, occupation fails to be a consistent predictor for political confidence in the BRICS nations. Homemakers in South Africa and the unemployed in Russia show negative relationships with political confidence, while students in India are more likely to have positive attitudes toward political confidence. In sum, it appears that institutional confidence, in most cases, is to some extent evenly distributed within different social and economic groups in society, supporting the hypothesis that confidence in political institutions is the result of specific political and sociocultural factors rather than general demographic factors.
5 Conclusion
As recognized at the beginning of this paper, many observers do not think the BRICS nations have hope of acting together as either an economic bloc or a coherent political power in world affairs. It is true that a neat acronym, like BRICS, can be nothing but a short-term vogue in the grand narrative of world history. When historians look back on our time many years later, they may forget the buzzword completely, though the proposed BRICS development bank may change something if it becomes true. Nevertheless, people will recognize that since the beginning of the twenty-first century, especially after the bust of the 2008 global financial crisis, it has been an undeniable fact that a number of emerging economies have been playing tremendously important roles in the world economy and international politics. Whether these economies can be summed up as BRICS, ‘BRICK’ (K for South Korea), ‘BRIMC’ (M for Mexico), ‘BRICA’ (the Gulf Cooperation Council Arab countries: Saudi Arabia, Qatar, Kuwait, Bahrain, Oman, and the United Arab Emirates), or any other political club, is irrelevant.
Many scholars believe that sustainable development of emerging economies cannot be achieved without political stability, and popular confidence in political institutions is vital to the stability of a regime. The results of my research to some extent confirm the importance of economic prosperity to political confidence. For example, the Chinese have the highest level of political confidence, and, in my opinion, it is not just a coincidence that China alone accounts for more than 70% of the combined GDP growth generated by the BRIC countries from 1999 to 2010 (Firzli, Reference Firzli2011). Of course it is understandable that some people might attribute Chinese people's high confidence in political institutions to ‘brainwashing’. This statement underestimates the ability of the Chinese to judge. In empirical research, Xueyi Chen and Tianjian Shi have found that state news media and party propaganda organs in China actually have negative effects on people's attitudes toward political institutions in general and make people distrust the government (Chen and Shi, Reference Chen and Shi2001). Today, China's media have been more open and critical, and thus I believe that the Chinese are even less hoodwinked than they may have been during Chen and Shi's 1993–94 survey.
The respect to authority in some new emerging countries to some extent is a result of their modernization process, as Inglehart's works (Reference Inglehart and Norris1999) implies. However, economic indicators cannot explain everything. Taking China as an example again, researchers have noticed that Chinese people are very confident in the central government but not in local governments (Li, Reference Li2004). Some researchers even claim that in the six Confucian Asian communities, which also include Singapore, Taiwan, and Hong Kong, respondents from mainland China have the lowest confidence in local governments (Tan and Tambyah, Reference Tan and Tambyah2010). We can therefore conclude that there must be a multitude of unobservable macrofactors playing their roles in political confidence, such as traditional culture. This is also true when it comes to other BRICS nations. For example, perhaps the fact that respondents from Brazil and Russia generally show less individual social trust, and political confidence can be understood through their consistent skepticism about the honesty and law-abidingness of fellow citizens, closely related to their collective memories of the histories of their countries.
My research aims to find factors other than economic factors that influence people's political confidence at the individual level. This paper demonstrates that for the BRICS countries, both sociocultural and micropolitical factors have a significant effect in explaining varieties of people's political confidence, though political factors are more consistent and powerful. Due to the limitations of the data, all the three micropolitical factors in the model, pride in nationality, personal importance of political parties, and political spectrum, are subjective indicators. The argument could be improved if some specific indicators measuring political behaviors of the people can be added from new survey data in the future.
Regarding sociocultural factors, although objective indicators like age, gender, and occupation appear significant in some countries, the most consistent significance comes from subjective variables, such as evaluation of standard of living, general happiness, and general social trust. My research shows that people's positive opinion of their own lives and of the people around them may have a positive effect on their political confidence. This finding not only reaffirms the fact that the level of economic development is not the only important factor, but also may lead policy makers to pay more attention to individuals’ subjective experiences of economic development results.
Of course, there are still many other variables that play an important role in people's political trust. For example, many researchers have noticed the role of the media (Levi and Stoker, Reference Levi and Stoker2000). This is especially important today, when politics is increasingly personalized: whether in the parliamentary or presidential system, people are more concerned about leaders’ individual performance, and the growth of electronic media plays a crucial role in understanding leadership (McAllister, Reference McAllister, Dalton and Klingemann2007), not to mention ‘new media’, like the Internet, that play an even bigger role in guiding people's political attitudes (Tolbert and Mossberger, Reference Tolbert and Mossberger2006). In fact, scholars have previously found that citizens’ evaluation of government performance (on issues such as corruption, human rights, and crime, as well as the economy) is closely related to political satisfaction with them (Kim and Voorhees, Reference Kim and Voorhees2011). However, due to data limitations, I cannot test the roles of these variables in this paper. In fact, no single research project can test all the variables that may influence people's political confidence.
Nevertheless, it is certain that if policy makers pay more attention to macroeconomic performance at an individual level, it will be key in improving individuals’ actual experience of the achievement of economic development. In the modern world, many politicians, probably including leaders of the BRICS, believe that as long as the economy keeps growing, they can maintain people's confidence in the government. This sounds plausible, but if a leader ignores the expectations of the citizens and believes that economic growth alone can achieve political confidence, then such an invincible force from the below sooner or later will suffer a serious crisis.
About the author
Dr Peng LU is a researcher in the Institute of Sociology in Chinese Academy of Social Sciences. He received his Ph.D. in sociology at Tsinghua University in 2010. His personal research concentrates on the power structure of the Chinese elite, particularly the relationship between government, business, and the intelligentsia. He is the author of a book on theories of social stratification (co-authored with LI Chunling), several book chapters, and a number of articles in peer-reviewed journals in both Chinese and English.