Introduction
Transgenic crops expressing insecticidal proteins from the soil bacterium Bacillus thuringiensis (Bt) are cultivated worldwide, providing useful pest management tools to growers for the past 20 years (Blanco et al., Reference Blanco, Chiaravalle, Dalla-Rizza, Farias, García-Degano, Gataminza, Mota-Sánchez, Murua, Omoto, Pieralise, Rodríguez, Rodríguez-Maciel, Terán-Santofímioet, Terán-Vargas, Valencia and Willink2016; Brookes and Barfoot, Reference Brookes and Barfoot2017). Benefits of Bt crops include successful control of target pests, increased yields, reduced use of synthetic insecticides, preservation of natural enemies, and resource conservation (Cattaneo et al., Reference Cattaneo, Yafuso, Schmidt, Huang, Rahman, Olson, Ellers-Kirk, Orr, Marsh, Antilla, Dutilleul and Carrière2006; Carpenter, Reference Carpenter2010; Lu et al., Reference Lu, Wu, Jiang, Guo and Desneux2012). However, the evolution of resistance by target pests has reduced the effectiveness and other benefits of Bt crops (Tabashnik et al., Reference Tabashnik, Brévault and Carrière2013).
Among the species targeted by Bt crop technologies, the fall armyworm (FAW), Spodoptera frugiperda (Smith), is the main pest targeted by Bt maize (Zea mays L.) and Bt cotton (Gossypium hirsutum L.) technologies in Brazil, as well as other countries. The widespread adoption of Bt maize in Brazil (>85% of total area) for controlling FAW together with low refuge adoption (<10% of compliance) and favorable climatic conditions have contributed to the rapid evolution of resistance to maize technologies expressing Cry proteins (Farias et al., Reference Farias, Andow, Horikoshi, Sorgatto, Fresia, Santos and Omoto2014a; Bernardi et al., Reference Bernardi, Salmeron, Horikoshi, Bernardi, Dourado, Carvalho, Martinelli, Head and Omoto2015; Santos-Amaya et al., Reference Santos-Amaya, Rodrigues, Souza, Tavares, Campos, Guedes and Pereira2015; Omoto et al., Reference Omoto, Bernardi, Salmeron, Sorgatto, Dourado, Crivellari, Carvalho, Willse, Martinelli and Head2016). The rapid evolution of resistance has also compromised the performance of Bt cotton traits against FAW (Horikoshi et al., Reference Horikoshi, Bernardi, Bernardi, Malaquias, Okuma, Miraldo, Amaral and Omoto2016a). Field-evolved resistance to Bt maize by FAW has also been reported in Puerto Rico (Storer et al., Reference Storer, Babcock, Schlenz, Meade, Thompson, Bing and Huckaba2010), U.S. (Huang et al., Reference Huang, Qureshi, Meagher, Reisig, Head, Andow, Ni, Kerns, Buntin, Niu, Yang and Dangal2014) and Argentina (Chandrasena et al., Reference Chandrasena, Signorini, Abratti, Storer, Olaciregui, Alves and Pilcher2018). In addition to its damage on maize and cotton crops, FAW is known to cause economic losses in sorghum (Sorghum bicolor L. Moench) (Oliveira et al., Reference Oliveira, Silva, Zoz, Zoz, Andrade and Witt2019), millet (Pennisetum americanum (L.) Leeke) (Favetti et al., Reference Favetti, Braga-Santos, Massarolli, Specht and Butnariu2017), and soybean (Glycine max (L.) Merril) (Machado et al., Reference Machado, Rodrigues Junior, Führ, Zago, Marques, Santos, Nowatzki, Dahmer, Omoto and Bernardi2020).
The high-dose/refuge strategy is the major tactic used worldwide for delaying pest resistance to Bt crop technologies (Tabashnik et al., Reference Tabashnik, Van Rensburg and Carrière2009). This strategy aims to promote mating between rare resistant pests surviving in Bt growing areas and susceptible genotypes developed on non-Bt plants, thereby reducing the rate of formation of resistant homozygote offspring and the dominance of resistance (Gould, Reference Gould1998). The high-dose/refuge strategy also considers the fitness costs of resistant genotypes as one of the major factors influencing the speed of resistance evolution; if resistance is linked with fitness costs that affect biological traits of resistant genotypes, resistance can evolve more slowly (Gassmann et al., Reference Gassmann, Carrière and Tabashnik2009; Carrière et al., Reference Carrière, Ellers-Kirk, Hartfield, Larocque, Degain, Dutilleul, Marsh, Crowder, Li, Ellsworth, Naranjo, Palumbo, Fournier, Antilla and Tabashnik2012; Huang, Reference Huang2021).
Previous studies using artificial diet and non-Bt maize leaves have reported a lack of substantial fitness costs associated with resistance to Cry1F (Horikoshi et al., Reference Horikoshi, Bernardi, Bernardi, Okuma, Farias, Miraldo, Amaral and Omoto2016b) and Cry1A.105/Cry2Ab2 (Bernardi et al., Reference Bernardi, Salmeron, Horikoshi, Bernardi, Dourado, Carvalho, Martinelli, Head and Omoto2015; Santos-Amaya et al., Reference Santos-Amaya, Rodrigues, Souza, Tavares, Campos, Guedes and Pereira2015) in FAW from Brazil. Similarly, FAW populations from Puerto Rico and U.S. reared on different host plants have also shown a lack of strong fitness costs related to resistance to Cry1F and Cry1A.105 (Jakka et al., Reference Jakka, Knight and Jurat-Fuentes2014; Vélez et al., Reference Vélez, Spencer, Alves, Crespo and Siegfried2014; Niu et al., Reference Niu, Head, Price and Huang2017). However, it is widely known that FAW from Brazil also use other host plants (e.g., cotton, millet, sorghum and soybean, among others) as food sources for survival and population increases. Therefore, understanding the interactions between host plants and fitness costs in FAW genotypes resistant to Bt proteins may improve the sustainable use of Bt crops. Here, FAW genotypes resistant to pyramided maize events expressing Cry1F/Cry1A.105/Cry2Ab2 and Cry1A.105/Cry2Ab2 were used to investigate the interactions between non-Bt host plants and fitness costs.
Material and methods
Description of FAW genotypes
The FAW genotypes resistant to Bt protein-expressing maize lines were selected by the F2 screen method proposed by Andow and Alstad (Reference Andow and Alstad1998) from a field population collected in Paulínia, São Paulo, Brazil (22°42′38″S and 47°06′26″W) as described by Muraro et al. (Reference Muraro, Garlet, Godoy, Cossa, Rodrigues Junior, Stacke, Medeiros, Guedes and Bernardi2019). A total of 102 isolines were screened, with 27 isolines presenting resistance alleles (larval survival >80%) to each pyramided maize event expressing the following Bt proteins: Cry1F/Cry1A.105/Cry2Ab2 (2A620PW, Dow AgroSciences, Paracatu, MG, Brazil) and Cry1A.105/Cry2Ab2 (DKB 390PRO, Dekalb, Uberlandia, MG, Brazil). The adults were used to establish the resistant colonies which are referred to as P-R and Y-R, respectively. From F1 to F6 generation after selection, P-R and Y-R colonies were reared from neonate to third instar on excised leaves of the respective Bt maize on which they were selected (survival >85%). Then, larvae were transferred to an artificial diet proposed by Greene et al. (Reference Greene, Leppla and Dickerson1976) where they remained until the pupa stage. Neonates from the F7 generation were used to perform fitness cost studies. A susceptible genotype (Sus) of FAW was also used; this genotype was collected from non-Bt maize in Mogi Mirim, São Paulo, Brazil (22°28′31′′S and 46°54′21′′W) and has been maintained in the laboratory for more than 7 years without exposure to Bt-proteins. The Sus genotype presented complete mortality when exposed to Bt-single or pyramided maize events as reported by Muraro et al. (Reference Muraro, Garlet, Godoy, Cossa, Rodrigues Junior, Stacke, Medeiros, Guedes and Bernardi2019). To evaluate the heterozygotes, reciprocal crosses between P-R♀ × Sus♂ and Y-R♀ × Sus♂ were performed in PVC cages (23 cm height × 10 cm diameter, 25 pairs/cage); these were the only crosses performed as the inheritance of resistance of FAW to Cry1 and Cry2 proteins is an autosomal trait (Bernardi et al., Reference Bernardi, Salmeron, Horikoshi, Bernardi, Dourado, Carvalho, Martinelli, Head and Omoto2015; Santos-Amaya et al., Reference Santos-Amaya, Rodrigues, Souza, Tavares, Campos, Guedes and Pereira2015).
Host plants
Non-Bt maize (30A37, Dow AgroSciences, Jardinópolis, SP, Brazil), non-Bt cotton (FM 910, Bayer CropScience, Paulínia, SP, Brazil), millet (BRS 1501, Embrapa, Sete Lagoas, MG, Brazil) and sorghum (BM 737, Biomatrix, Patos de Minas, MG, Brazil) were used as food sources. Seeds were sown in 5 litre plastic pots, which contained two parts soil and one part of composted plant material, and maintained in a greenhouse. Studies were initiated when the plants reached 30 d post-emergence.
Assessing the fitness costs of Cry1 and Cry2 resistance in FAW
To assess fitness costs, neonates (<24 h old) from the P-R, Y-R, Sus genotypes and F1 hybrids of the resistant and susceptible genotypes (heterozygotes) were reared on the leaves of non-Bt cotton, non-Bt maize, millet and sorghum excised from the upper third part of greenhouse-grown plants. Leaves from early stages and of the upper part of the plant canopy were used for larval feeding because this is the main site of FAW oviposition and where larvae begin feeding in the field. In the laboratory, leaves were cut into pieces (5–6 cm2) and placed on top of a gelled 2.5% agar-water mixture in 100 ml plastic cups, with the leaves being separated from the agar-water layer by a filter paper. Next, a single neonate was placed in each cup. The leaves were replaced every 24 h until pupation, and cups were maintained in a room at 25 ± 2 °C, 60 ± 10% RH, and with a 14:10 h light:dark photoperiod. The experiment was conducted in two-level factorial with homogeneous plots containing 10 replicates, each one consisting of 16 neonates/insect genotype/host plant. The following life-history traits were evaluated: survival rates and developmental times of the larval, pupal and neonate-to-adult periods and fecundity (eggs per female). Survival and developmental times were determined via daily observation. Fecundity was assessed via daily observation of 10 pairs kept in PVC cages (23 cm height × 10 cm diameter, one pair/cage) internally coated with a paper towel and closed at the top with sheer fabric.
Data analysis
In order to assess the fitness costs of FAW resistant genotypes developed on different host plants, life-history traits were subjected to a two-way analysis of variance (ANOVA) using FAW genotypes and host plants as main factors. Means were separated by the least-square means statement (LSMEANS statement) using a Tukey–Kramer adjustment at P < 0.05 in SAS® 9.1 (SAS Institute, 2002). Life history data were also used to develop a fertility life table by estimating the mean length of a generation (T), net reproductive rate (R o – the average number of female offspring that would be born to a cohort of females), and intrinsic rate of population increase (r m – the rate of natural increase of a population) using the Jackknife technique and the ‘lifetable.sas’ protocol developed by Maia et al. (Reference Maia, Luiz and Campanhola2000) in SAS® 9.1 (SAS Institute, 2002). This protocol calculates confidence intervals for all estimated parameters and conducts one-sided and two-sided t-tests for pairwise comparisons between groups. We also estimated the relative fitness cost using the equation proposed by Cao and Han (Reference Cao and Han2006): Relative fitness cost = (R o resistant or heterozygote genotypes)/(R o Sus genotype), where R o is the net reproductive rate parameter from the fertility life table.
Results
Survival
Survival of P-R, P-R♀ × Sus♂ and Sus genotypes on different host plants
ANOVA tests showed that the main effects of insect genotype, host plant and their interaction were all not significant for larval survival (F = 0.06; df = 2, 108; P = 0.9455 for insect genotype; F = 0.59; df = 3, 108; P = 0.6197 for host plant; and F = 0.90; df = 6, 108; P = 0.5013 for their interaction). The average larval survival of the three genotypes on the four host plants was 87.5% (fig. 1a).
Survival rates (%) of larval (a), pupal (b) and neonate-to-adult (c) periods of P-R (resistant to Cry1F/Cry1A.105/Cry2Ab2 Bt proteins), susceptible (Sus) and F1 hybrid (P-R♀ × Sus♂) of FAW on leaves of different host plants. Bars (±SE) with the same lowercase letter in each host plant or uppercase letter in distinct hosts do not significantly differ, as determined by the LSMEANS statement using the Tukey–Kramer test at P < 0.05.

The effect of insect genotype was significant for pupal survival (F = 9.10; df = 2, 108; P = 0.0002), but non-significant for both host plant (F = 0.79; df = 3, 108; P = 0.5045) and insect genotype × host plant interaction (F = 1.86; df = 6, 108; P = 0.0950). The pupal survival of the P-R genotype (54%) was significantly lower than that of the P-R♀ × Sus♂ and Sus genotypes (92.6 and 81.6%, respectively) on non-Bt cotton, however, the latter two genotypes did not differ among them (fig. 1b).
The neonate-to-adult survival was significantly affected by insect genotype (F = 5.21; df = 2, 108; P = 0.0069), whereas host plant (F = 0.79; df = 3, 108; P = 0.5017) and insect genotype × host plant interaction (F = 1.70; df = 6, 108; P = 0.1272) showed non-significant effects on this variable. The P-R genotype had lower neonate-to-adult survival (46.6%) than the P-R♀ × Sus♂ (83.3%) and Sus (68.3%) genotypes when developed on non-Bt cotton (fig. 1c), although were similar when developed on the other three food sources.
Survival of Y-R, Y-R♀ × Sus♂ and Sus genotypes on different host plants
ANOVA tests showed non-significant effects of insect genotype, host plant and their interaction on larval survival (F = 0.54; df = 2, 108; P = 0.5827 for insect genotype; F = 1.35; df = 3, 108; P = 0.2612 for host plant; and F = 0.21; df = 6, 108; P = 0.9734 for their interaction). The overall mean larval survival of these genotypes on the different host plants was 89.8% (fig. 2a).
Survival rates (%) of larval (a), pupal (b) and neonate-to-adult (c) periods of Y-R (resistant to Cry1A.105/Cry2Ab2 Bt proteins), susceptible (Sus) and F1 hybrid (Y-R♀ × Sus♂) of FAW on leaves of different host plants. Bars (±SE) with the same lowercase letter in each host plant or uppercase letter in distinct hosts do not significantly differ, as determined by the LSMEANS statement using the Tukey–Kramer test at P < 0.05.

Pupal survival was also not significantly affected by insect genotype (F = 1.39; df = 2, 108; P = 0.2529), host plant (F = 0.31; df = 3, 108; P = 0.8188) or insect genotype × host plant interaction (F = 1.06; df = 6, 108; P = 0.3924). The pupal survival of all genotypes from the four host plants was 85.5% (fig. 2b).
The main effects on neonate-to-adult survival of insect genotype, host plant and insect genotype × host plant interaction were all non-significant (F = 2.08; df = 2, 108; P = 0.1296 for insect genotype; F = 0.79; df = 3, 108; P = 0.5017 for host plant; and F = 0.62; df = 6, 108; P = 0.7108 for their interaction). The neonate-to-adult survival ranged from 68.3 to 81.7% (fig. 2c).
Development
Developmental time of P-R, P-R♀ × Sus♂ and Sus genotypes on different host plants
ANOVA tests indicated significant effects of both insect genotype (F = 7.41; df = 2, 108; P = 0.0010) and host plant (F = 29.79; df = 3, 108; P = 0.0001) on larval developmental time. In contrast, there was no significant effect from insect genotype × host plant interaction (F = 1.71; df = 6, 108; P = 0.1251) on this variable. The P-R genotype presented a larval period that was approximately 3 d longer than that of the P-R♀ × Sus♂ and Sus genotypes on millet and sorghum, however, none of the genotypes differed on non-Bt maize. Across host plants, the larval developmental time of all genotypes was from 2 to 6 d longer on non-Bt cotton than other hosts (fig. 3a).
Developmental times of larval (a), pupal (b) and neonate-to-adult (c) periods of P-R (resistant to Cry1F/Cry1A.105/Cry2Ab2 Bt proteins), susceptible (Sus) and F1 hybrid (P-R♀ × Sus♂) of FAW on leaves of different host plants. Bars (±SE) with the same lowercase letter in each host plant or uppercase letter in distinct hosts do not significantly differ, as determined by the LSMEANS statement using the Tukey–Kramer test at P < 0.05.

The effects of insect genotype, host plant and their interaction on pupal stage developmental time were all non-significant (F = 1.71; df = 2, 108; P = 0.1856 for insect genotype; F = 0.79; df = 3, 108; P = 0.4998 for host plant; and F = 0.79; df = 6, 108; P = 0.5778 for their interaction). The average pupal stage developmental time of the three insect genotypes from the four hosts was 11.2 d (fig. 3b).
The effects of host plant on neonate-to-adult developmental time were significantly affected by insect genotype (F = 16.08; df = 3, 108; P < 0.0001). However, non-significant effects of insect genotype (F = 1.67; df = 2, 108; P = 0.1933) and insect genotype × host plant interaction (F = 1.44; df = 6, 108; P = 0.2065) were also detected. On non-Bt cotton, all genotypes demonstrated neonate-to-adult developmental times that were from 2 to 6 d longer than on non-Bt maize, millet and sorghum (fig. 3c).
Developmental time of Y-R, Y-R♀ × Sus♂ and Sus genotypes on different host plants
ANOVA tests demonstrated that the main effects were all significant for the larval developmental time (F = 19.27; df = 2, 108; P = 0.0001 for insect genotype; F = 98.29; df = 3, 108; P = 0.0001 for host plant; and F = 3.42; df = 6, 108; P = 0.0040 for their interaction). The Y-R genotype had a significantly longer larval developmental time, by up to 4 d, when compared to Sus genotypes on non-Bt cotton and sorghum (fig. 4a). All insect genotypes presented longer larval developmental time (21.4–25.6 d) on non-Bt cotton than on the other host plants (<18.8 d).
Developmental times of larval (a), pupal (b) and neonate-to-adult (c) periods of Y-R (resistant to Cry1A.105/Cry2Ab2 Bt proteins), susceptible (Sus) and F1 hybrid (Y-R♀ × Sus♂) of FAW on leaves of different host plants. Bars (±SE) with the same lowercase letter in each host plant or uppercase letter in distinct hosts do not significantly differ, as determined by the LSMEANS statement using the Tukey–Kramer test at P < 0.05.

The effects of insect genotype, host plant, and their interaction on pupal developmental times were all non-significant (F = 1.77; df = 2, 108; P = 0.1754 for insect genotype; F = 2.13; df = 3, 108; P = 0.1010 for host pant; and F = 1.48; df = 6, 108; P = 0.1934 for their interaction). The average pupal developmental time of FAW genotypes from different host plants was 11.3 d (fig. 4b).
Significant effects were observed from both insect genotype (F = 16.43; df = 2, 108; P < 0.0001) and host plant (F = 61.02; df = 3, 108; P < 0.0001) on neonate-to-adult developmental time. However, no effects of insect genotype × host plant interaction (F = 1.67; df = 6, 108; P = 0.1352) were verified. The Y-R genotype showed neonate-to-adult developmental times from 2 to 4 d longer than other insect genotypes on non-Bt cotton and sorghum (fig. 4c). On non-Bt cotton, insect genotypes presented up to 9 d longer neonate-to-adult developmental times than on non-Bt maize, millet and sorghum; meanwhile, these latter three hosts did not differ among themselves (fig. 4c).
Fecundity
Fecundity of P-R, P-R♀ × Sus♂ and Sus genotypes on different host plants
The effects of insect genotype, host plant, and their interaction were all significantly for female fecundity (F = 8.11; df = 2, 60; P = 0.0008 for insect genotype; F = 6.93; df = 3, 60; P = 0.0004 for host plant; and F = 7.13; df = 6, 60; P = 0.0001 for their interaction). P-R genotype females from larvae fed on non-Bt cotton and non-Bt maize laid a higher number of eggs (1498 and 1544 eggs/female, respectively) than Sus females (788 and 740 eggs/female, respectively) (fig. 5). In contrast, Sus females from larvae fed on millet and sorghum presented similar number of eggs (966 and 1233 eggs per female, respectively) compared to resistant genotype (660 and 965 eggs per female, respectively), however, P-R♀ × Sus♂ females oviposited a lower number of eggs (572 and 705 eggs, respectively) in both hosts. In general, females from larvae reared on non-Bt cotton and non-Bt maize oviposited more eggs than females whose larvae fed on millet and sorghum (fig. 5).
Fecundity of P-R (resistant to Cry1F/Cry1A.105/Cry2Ab2 Bt proteins), susceptible (Sus) and F1 hybrid (P-R♀ × Sus♂) of FAW on leaves of different host plants. Bars (±SE) with the same lowercase letter in each host plant or uppercase letter in distinct hosts do not significantly differ, as determined by the LSMEANS statement using the Tukey–Kramer test at P < 0.05.

Fecundity of Y-R, Y-R♀ × Sus♂ and Sus genotypes on different host plants
The effects of insect genotype, host plant, and their interaction were all significant for female fecundity (F = 4.42; df = 2, 60; P = 0.0161 for insect genotype; F = 6.12; df = 3, 60; P = 0.0011 for host plant; and F = 7.47; df = 6, 60; P < 0.0001 for their interaction). Y-R females oviposited similar number of eggs as Sus females on non-Bt maize (593 vs. 740 eggs/female), millet (894 vs. 966 eggs/female) and sorghum (1022 vs. 1233 eggs/female), whereas, these females laid a lower number of eggs on non-Bt cotton (436 eggs/female) than the Sus genotype (788 eggs/female). The Y-R♀ × Sus♂ genotype oviposited a lower number of eggs (317 eggs/female) than the other genotypes on millet only, but laying a similar number of eggs as the Sus females on both non-Bt cotton and non-Bt maize (fig. 6). Resistant females feeding on non-Bt cotton oviposited a lower number of eggs than Sus females, however, these genotypes had a similar reproductive performance on the other hosts.
Fecundity of Y-R (resistant to Cry1A.105/Cry2Ab2 Bt proteins), susceptible (Sus) and F1 hybrid (Y-R♀ × Sus♂) of FAW on leaves of different host plants. Bars (±SE) with the same lowercase letter in each host plant or uppercase letter in distinct hosts do not significantly differ, as determined by the LSMEANS statement using the Tukey–Kramer test at P < 0.05.

Population growth potential
Life table parameters of P-R, P-R♀ × Sus♂ and Sus genotypes on different host plants
The estimated life-history traits (table 1) indicate that the P-R genotype had a mean length of a generation (T) on non-Bt cotton, millet and sorghum that was from 2 to 4 d longer than the Sus genotype (table 1). By contrast, the P-R, P-R♀ × Sus♂ and Sus genotypes presented similar duration of a generation on non-Bt maize. The F1 hybrids from P-R♀ × Sus♂ reared on sorghum had a duration of a generation up to 5 d longer than that of the Sus genotype, however, the time of a generation was approximately 2 d shorter than the Sus genotype on non-Bt cotton.
Life history of P-R (resistant to Cry1F/Cry1A.105/Cry2Ab2 Bt proteins), susceptible (Sus) and F1 hybrid (P-R♀ × Sus♂) of FAW on leaves of different host plants

a T, mean length of a generation (days); R o, net reproductive rate (females per female per generation); r m, intrinsic rate of population increase (per day).
b Means within a column followed by the same letter are not significantly different (t-tests for pairwise group comparisons, P > 0.05).
c Relative fitness cost = (R o resistant or heterozygotes genotypes)/(R o Sus genotype).
The P-R genotype showed lower population growth increases on millet and sorghum than the Sus genotype (table 1). These results indicate that P-R females obtained from larvae fed on these hosts generated from 27 to 42% fewer females (R o) when compared to the Sus genotype; this also reduced the intrinsic rate of population increase (r m) of the P-R genotype, which was lower than that of Sus genotype. By contrast, P-R females from larvae reared on non-Bt maize demonstrated fitness benefits, producing ~44% more females and increasing their population ~11% compared to the Sus genotype. Females of the P-R♀ × Sus♂ genotype showed similar or greater reproductive performance and population increases as the Sus genotype on non-Bt cotton and non-Bt maize (table 1). In contrast, on millet and sorghum, P-R♀ × Sus♂ females originated less females/generation and had lower rates of population increase than the Sus females.
Life table parameters of Y-R, Y-R♀ × Sus♂ and Sus genotypes on different host plants
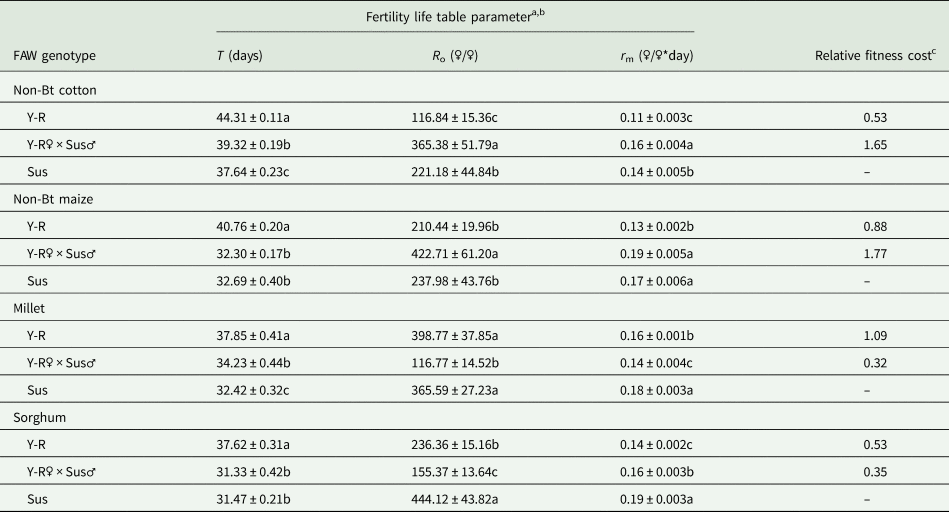
The mean length of a generation (T) of Y-R genotype was from 5 to 8 d longer than that of the Sus genotype on all host plants (table 2). On the other hand, the F1 progeny from Y-R♀ × Sus♂ had a similar (on non-Bt maize and sorghum) and approximately 2 d longer (on non-Bt cotton and millet) mean length of a generation when compared to the Sus genotype on the same hosts, although a shorter generation time than the Y-R genotype on all hosts.
Life-history traits of Y-R (resistant to Cry1A.105/Cry2Ab2 Bt proteins), susceptible (Sus) and F1 hybrid (Y-R♀ × Sus♂) of FAW on leaves of different host plants

a T, mean length of a generation (days); R o, net reproductive rate (females per female per generation); r m, intrinsic rate of population increase (per day).
b Means within a column followed by the same letter are not significantly different (t-tests for pairwise group comparisons, P > 0.05).
c Relative fitness cost = (R o resistant or heterozygotes genotypes)/(R o Sus genotype).
The Y-R genotype presented lower population growth potential on non-Bt cotton and sorghum than the Sus genotype (table 2). On non-Bt cotton and sorghum, Y-R females originated 116 and 236 females/female/generation, respectively, whereas Sus females produced 221 and 444 females/female, respectively. This represents a reduction of ~47% and until 26% in the capacity of Y-R females to produce females and population increases, respectively, on these hosts. By contrast, Y-R and Sus genotypes presented a similar number of females/generation on non-Bt maize and millet, although the Y-R genotype demonstrated a population increase from 11 to 24% lower than the Sus genotype in these hosts. Females from the Y-R♀ × Sus♂ genotype on non-Bt cotton and non-Bt maize generated more females (>365 females/generation) than the Y-R and Sus genotypes (<237 females/generation) (table 2). However, Y-R♀ × Sus♂ developing on millet and sorghum generated fewer females/generation than the Sus genotype. Progeny from the Y-R♀ × Sus♂ genotype presented similar or lower rates of population increases as the Sus genotype on all host plants with the exception of non-Bt cotton.
Relative fitness cost
The relative fitness costs (based on R o values from the life table) of the P-R genotype on non-Bt cotton (1.21) and non-Bt maize (1.77), as well as the Y-R genotype on millet (1.09), indicated higher fitness (i.e., a fitness benefit) when compared to the Sus genotype (tables 1 and 2). By contrast, the relative fitness costs of the P-R genotype on millet and sorghum (0.58 and 0.73, respectively) and the Y-R genotype on non-Bt cotton, non-Bt maize and sorghum (0.53, 0.88 and 0.53, respectively) suggest some recessive fitness costs (i.e., costs affecting the resistant genotypes). Progenies from P-R♀ × Sus♂ and Y-R♀ × Sus♂ genotypes also had fitness benefits (relative fitness cost >1.5) when reared on non-Bt cotton and non-Bt maize. However, on millet and sorghum, the relative fitness costs of both heterozygotes ranged from 0.32 to 0.63, suggesting that fitness costs in these hosts are non-recessive traits (i.e., cost affecting heterozygotes) (tables 1 and 2). Regardless of these findings, the resistance to Cry1 and Cry2 proteins by FAW may not impose substantial fitness costs in resistant or heterozygotes genotypes.
Discussion
Field-evolved resistance by FAW to Cry1F, Cry1A.105 and Cry2Ab2 Bt proteins expressed in single or pyramided maize traits has been reported and the widespread evolution of resistance has reduced the effectiveness of several Bt crop technologies in Brazil (Farias et al., Reference Farias, Andow, Horikoshi, Sorgatto, Fresia, Santos and Omoto2014a; Santos-Amaya et al., Reference Santos-Amaya, Rodrigues, Souza, Tavares, Campos, Guedes and Pereira2015; Horikoshi et al., Reference Horikoshi, Bernardi, Bernardi, Malaquias, Okuma, Miraldo, Amaral and Omoto2016a; Omoto et al., Reference Omoto, Bernardi, Salmeron, Sorgatto, Dourado, Crivellari, Carvalho, Willse, Martinelli and Head2016; Burtet et al., Reference Burtet, Bernardi, Melo, Pes, Strahl and Guedes2017). When present, the fitness costs of resistance to Bt proteins may reduce the frequency of resistance alleles if less Bt crops are cultivated. Our results reveal recessive fitness costs (i.e., costs affecting the resistant genotype) at the individual level on the pupal and neonate-to-adult survival of the P-R genotype on non-Bt cotton, the larval development time of the P-R genotype on millet and sorghum, the larval and neonate-to-adult periods of the Y-R genotype on non-Bt cotton and sorghum and the fecundity of the Y-R genotype on non-Bt cotton and, at the population level, effects on the mean generation time of resistant genotypes. Meanwhile, non-recessive fitness costs (i.e., costs affecting heterozygotes) were detected for fecundity and population increases on millet and sorghum. Regardless of the disadvantages in some life-history traits of the resistant genotypes compared to the susceptible ones, our findings suggest that the resistance to Cry1 and Cry2 in FAW is not linked with strongly fitness costs at the individual or population levels, favoring the stability and persistence of resistance alleles in field populations, even in the absence of selection pressure.
The higher fitness (i.e., fitness benefits) on fecundity and rate of population increases of the P-R genotype on non-Bt cotton and non-Bt maize is a concern for resistance management. Fitness advantages (higher number of females/female/generation) was also verified in FAW resistant to Vip3A on non-Bt cotton (Chen et al., Reference Chen, Head, Price, Kerns, Rice, Huang, Gilreath and Yang2019), whereas similar fitness among resistant and susceptible ones were related with the resistance of FAW to Cry1F or Cry1A.105 when reared on meridic diet and non-Bt maize, respectively (Jakka et al., Reference Jakka, Knight and Jurat-Fuentes2014; Vélez et al., Reference Vélez, Spencer, Alves, Crespo and Siegfried2014; Niu et al., Reference Niu, Head, Price and Huang2017). Our finding that the P-R genotype has fitness benefits in some host plants indicate that the frequency of resistance may increase under field conditions, even without selection pressure, displacing the susceptible allele in natural populations and reducing the effectiveness of high-dose/refuge strategy to delay resistance. Together with published data, our results show that are not uncommon some fitness benefits related with the resistance of FAW to Bt proteins.
Fitness costs of the resistance to Bt proteins in FAW from Puerto Rico, Florida and Brazil have previously been reported. Using an artificial diet, Horikoshi et al. (Reference Horikoshi, Bernardi, Bernardi, Okuma, Farias, Miraldo, Amaral and Omoto2016b) determined the fitness costs of a Cry1F resistance near-isoline of FAW that was selected from a Brazilian field population and found a lower survival rate of the eggs and longer development times to adulthood and to complete a generation. Similarly, Cry1F resistance in FAW from Puerto Rico and Florida were linked with a reduction in pupal weight, lower neonate-to-adult survivorship, and longer developmental times relative to a susceptible genotype (Dangal and Huang, Reference Dangal and Huang2015). Similar to our results and contrary to previous studies, lack of substantial fitness costs of the resistance to Cry1F, Cry1A.105 and Cry2Ab2 have been reported in FAW populations from Puerto Rico, Florida and Brazil when reared on meridic diet, non-Bt maize, non-Bt cotton and non-Bt soybean (Jakka et al., Reference Jakka, Knight and Jurat-Fuentes2014; Vélez et al., Reference Vélez, Spencer, Alves, Crespo and Siegfried2014; Bernardi et al., Reference Bernardi, Salmeron, Horikoshi, Bernardi, Dourado, Carvalho, Martinelli, Head and Omoto2015; Niu et al., Reference Niu, Head, Price and Huang2017). No substantial fitness cost relating to Vip3A resistance in FAW has also been observed on different food sources (Bernardi et al., Reference Bernardi, Bernardi, Horikoshi, Okuma, Miraldo, Fatoretto, Medeiros, Burd and Omoto2016; Chen et al., Reference Chen, Head, Price, Kerns, Rice, Huang, Gilreath and Yang2019). According to Gassmann et al. (Reference Gassmann, Carrière and Tabashnik2009), the variation on fitness costs among studies can be explained by genetic variation of the populations tested, food sources, bioassays methods, environments and intraspecific competition, among other factors.
The magnitude of fitness costs may be influenced by host plants and seems to be more expressed in low-quality food sources (Janmaat and Myers, Reference Janmaat and Myers2005; Raymond et al., Reference Raymond, Wright and Bonsall2011). For example, the presence of gossypol on cotton, a phytochemical toxic to many herbivores, was shown to increase the fitness cost parameters of resistance to Cry1Ac in Pectinophora gossypiella (Saunders) (Carrière et al., Reference Carrière, Ellers-Kirk, Biggs, Higginson, Dennehy and Tabashnik2004). Contrary to our expectations, gossypol present on cotton leaves did not increase the expression of fitness costs associated with the resistance to Cry1 and Cry2 in FAW. According to our results, the life-history traits of resistant and heterozygotes genotypes reared on cotton leaves were close to or better than those reared on other hosts, conferring some fitness benefits compared to the susceptible genotype. Thus, our findings indicate that a host plant with reduced suitability or quality does not always intensify the fitness costs of Bt resistance in FAW. Regardless of this, current and previous studies suggest an absence of strong fitness costs of FAW resistance to the main Bt proteins (Cry1F, Cry1A.105, Cry2Ab2 and Vip3A) expressed in transgenic plants (Jakka et al., Reference Jakka, Knight and Jurat-Fuentes2014; Vélez et al., Reference Vélez, Spencer, Alves, Crespo and Siegfried2014; Bernardi et al., Reference Bernardi, Salmeron, Horikoshi, Bernardi, Dourado, Carvalho, Martinelli, Head and Omoto2015, Reference Bernardi, Bernardi, Horikoshi, Okuma, Miraldo, Fatoretto, Medeiros, Burd and Omoto2016; Horikoshi et al., Reference Horikoshi, Bernardi, Bernardi, Okuma, Farias, Miraldo, Amaral and Omoto2016b; Niu et al., Reference Niu, Head, Price and Huang2017; Chen et al., Reference Chen, Head, Price, Kerns, Rice, Huang, Gilreath and Yang2019).
The lack of fitness costs associated with the resistance of FAW to Bt proteins reduces the effectiveness of IRM strategies in delay resistance. In this situation, the frequency of resistance remains stable in field populations, even without exposure to Bt proteins, as revealed by the monitoring data (Farias et al., Reference Farias, Horikoshi, Santos and Omoto2014b) and increased damages of FAW in Brazilian maize and cotton fields (Blanco et al., Reference Blanco, Chiaravalle, Dalla-Rizza, Farias, García-Degano, Gataminza, Mota-Sánchez, Murua, Omoto, Pieralise, Rodríguez, Rodríguez-Maciel, Terán-Santofímioet, Terán-Vargas, Valencia and Willink2016; Burtet et al., Reference Burtet, Bernardi, Melo, Pes, Strahl and Guedes2017; Muraro et al., Reference Muraro, Garlet, Godoy, Cossa, Rodrigues Junior, Stacke, Medeiros, Guedes and Bernardi2019, Reference Muraro, Stacke, Cossa, Godoy, Garlet, Vamorbida, O'Neal and Bernardi2020). This phenomenon also negatively affects the durability of current and future traits containing similar mode-of-action Bt proteins, due to cross-resistance between Cry1 proteins (Hernández-Rodríguez et al., Reference Hernández-Rodríguez, Hernandez-Martinez, Van Rie, Escriche and Ferré2013; Huang et al., Reference Huang, Qureshi, Meagher, Reisig, Head, Andow, Ni, Kerns, Buntin, Niu, Yang and Dangal2014; Niu et al., Reference Niu, Yang, Dangal and Huang2014; Santos-Amaya et al., Reference Santos-Amaya, Rodrigues, Souza, Tavares, Campos, Guedes and Pereira2015; Yang et al., Reference Yang, Kerns, Brown, Kurtz, Dennehy, Braxton, Head and Huang2016). Presumably, if the resistance allele frequency remains stable, resistance would evolve quickly if IRM strategies were not adopted (e.g., high-dose/refuge). According to Huang (Reference Huang2021), the adoption of Bt plants with a high-dose expression of Bt proteins is essential for Bt crop IRM, which make the resistance functionally recessive. The integration of Bt crops with other control tactics (e.g., chemical control, baculovirus-based biopesticides, egg parasitoids and mating disruption by pheromones) will likely be also essential for prolonging the lifetime of current and new Bt traits against FAW.
Acknowledgements
We are grateful to the National Council for the Improvement of Higher Education (CAPES) that provide a scholarship to the first author and the National Council for Technological and Scientific Development (CNPq) for granting research fellowship to OB (Process # 305464/2020-5).
Financial support
This work was supported by the National Council for Technological and Scientific Development (CNPq) (Grant Number # 430483/2018-0).
Conflict of interest
The authors declare that they have no conflict of interest.
Ethical standards
This article does not include any study on human participants or animals performed by any of the authors.