


1. Introduction
Energy is, to the modern economy, what blood is to the body. In the past few decades, in spite of major investments in renewable energy sources, fossil fuels still constitute approximately 80 per cent of the world's energy production (IEA, 2019). One may naturally be concerned about how economic development can be guaranteed while energy, as a key input, seems unlikely to be free from the peril of depletion, given the current technology on its extraction and generation. Theoretically, consensus has long been reached by economists that technological progress is the key to sustainable economic growth that relies on the use of a limited stock of resources. Although policy makers are aware of this, the implementation of policies is never a simple procedure, and it is important to assess whether technological change is biased towards energy rather than other input factors. Empirical work on the direction of technological change involving energy input has been arousing the interest of energy and environmental economists for years, including Karanfil and Yeddir-Tamsamani (Reference Karanfil and Yeddir-Tamsamani2010), Shao et al. (Reference Shao, Luan, Yang and Li2016), Zha et al. (Reference Zha, Kavuri and Si2017), among others. However, macro-level evidence is still rare; in this paper, we illustrate the situation of directed technological change in the world's main economies.
Agents make R&D decisions in a market with imperfect competition, incomplete information, government regulations, externalities in knowledge spillovers and other frictions; it is difficult to determine from a theoretical perspective how, if at all, technological change is biased. Theoretically, technological change might be expected to show a bias towards the non-renewable input(s) rather than the renewable one(s), as the former gets depleted over time. Nevertheless, despite accumulated empirical effort at the industry level, country-level evidence is still insufficient. An empirical study on country-level directed technological change might improve our understanding of general production patterns in the comtemporary world. Moreover, since many decisions are made by agents in technical R&D, this analysis might also provide valuable information for policy making regarding innovations related to the efficiency of energy utilization.
Whether technological change is biased towards energy has been empirically examined at the industry level. Zha et al. (Reference Zha, Kavuri and Si2017, Reference Zha, Kavuri and Si2018) estimate the CES production function for Chinese industrial sectors; Karanfil and Yeddir-Tamsamani (Reference Karanfil and Yeddir-Tamsamani2010) estimate a translog cost-share system for French economic sectors. The approaches in these studies enable the analysis of the biasedness of technological change; nonetheless, we find the production function approach of stochastic frontier analysis (SFA) to be more appropriate for our research purpose, as it allows the estimation of indicators that provide a more comprehensive idea on the situation of technological change, including technical inefficiency, output elasticities and total factor productivity (TFP) growth rate. In this paper we apply SFA to country-level data and estimate a translog production function with three main inputs: capital, labor and energy. We calculate the marginal products (output elasticities) for each input, as well as the factor bias index first proposed by Diamond (Reference Diamond1965), in order to find out how technological change has been biased in recent decades. We also calculate the growth rates of TFP, which indicate the general situation of technological development in each country.
The analysis provides us with an idea of the role played by technological change in macro-level production; it also reveals some patterns in economic growth of developed and developing countries. Based on our sample, we are going to show that, on average, output elasticities of energy and labor are increasing, while the output elasticity of capital is decreasing, and has negative values for some countries. Among the three inputs, the output elasticity of labor is the highest for developed countries, and the output elasticity of energy is the highest or very close to the highest for developing countries. For the average of the sample, and also for most countries in the sample, technological change is biased the most towards energy. Moreover, there are significant differences in the patterns of output elasticities, TFP growth rate and factor bias order for different (groups of) countries, which may provide insights for policy making.
In addition to the methodologies commonly applied in SFA studies, we obtain confidence intervals and levels of statistical significance for the abovementioned indicators, in order to acquire a more rigorous result. Boostrap results show strong evidence of consistency among countries, in the sense that technological change favors energy more than labor. Such a finding supports the hypothesis that technological change is more likely to be biased towards the non-renewable input rather than the renewable.
The remainder of this paper is organized as follows. We review the literature on our topic in section 2. In section 3 we address the methodology and data. Section 4 presents the empirical results, along with related interpretation and discussion. Concluding remarks are provided in section 5.
2. Literature review
The reliance of economic activities on natural resources, a significant part of which is non-renewable, caught the attention of economists as early as Hotelling (Reference Hotelling1931), who proposes a basic model of the extraction of non-renewable resources, suggesting that perfect competition yields an extraction path, chosen by firms, identical to the social optimum. In the 1970s, a number of economists focused their attention on economic growth with non-renewable resources, including Anderson (Reference Anderson1972), Dasgupta and Heal (Reference Dasgupta and Heal1974), Solow (Reference Solow1974), Stiglitz (Reference Stiglitz1974), Ingham and Simmons (Reference Ingham and Simmons1975), Hartwick (Reference Hartwick1977), Garg and Sweeney (Reference Garg and Sweeney1978), among others. The world's concern, as well as that of many economists, has been how to sustain economic growth with exhaustible resources. These early studies share one feature: they all believe technological change should play a relevant role in such progress.
Some economists seek solutions other than technological change. Groth and Schou (Reference Groth and Schou2002, Reference Groth and Schou2007) deem increasing returns to capital as the driver for growth; however, as we are going to show in our results, general production activities are more likely to exhibit decreasing returns to scale. Benchekroun and Withagen (Reference Benchekroun and Withagen2011) highlight the role of consumption (which hence affects investment), yet it seems less realistic for policies to target consumption rather than technological progress. Most economists consider technological change as the key to long-run economic growth with limited resources: Grimaud and Rougé (Reference Grimaud and Rougé2003) propose a Schumpeterian model of endogenous growth and show that economic growth can be sustained even with non-renewable resources, as long as an adequate level of technological change is guaranteed; a number of researchers share similar conclusions, including Smulders and De Nooij (Reference Smulders and De Nooij2003), Di Maria and Valente (Reference Di Maria and Valente2008) and André and Smulders (Reference André and Smulders2014).
Governments concerned with the scarcity of fossil-fuel energy and its environmental consequences have proposed policies like environmental taxes, aimed at limiting the use of fossil fuels. According to the belief of induced innovation by Hicks (Reference Hicks1932), with the price incentives created by such policies, technological change ought to take place so that the efficiency of energy use is improved over time. There is also the prediction that technological change is biased towards non-energy intensive products (Otto et al., Reference Otto, Loschel and Dellink2007). Although there is evidence that innovation is motivated by price factors (Newell et al., Reference Newell, Jaffe and Stavins1999; Popp, Reference Popp2002; Linn, Reference Linn2008; Kumar and Managi, Reference Kumar and Managi2009), firms' investment in R&D may not be socially optimal as knowledge spillovers are not fully internalized (Grubb and Ulph, Reference Grubb and Ulph2002). Therefore, both taxation and research subsidies play a role in optimal policy making, as suggested by Jaffe et al. (Reference Jaffe, Newell and Stavins2005), Grimaud et al. (Reference Grimaud, Lafforgue and Magné2011) and Acemoglu et al. (Reference Acemoglu, Aghion, Bursztyn and Hemous2012).
The growth model of directed technological change proposed by Acemoglu (Reference Acemoglu2002, Reference Acemoglu2007) indicates that technological progress is affected by two counteracting effects, the price effect and the market size effect. Specifically, when the menu of technological possibilities only allows for factor-augmenting technologies, induced technological change increases the relative marginal product of the factor becoming more abundant. On the other hand, as suggested by Hicks (Reference Hicks1932), Diamond (Reference Diamond1965) and Kumbhakar et al. (Reference Kumbhakar, Denny and Fuss2000), among others, the technological change of an economy over time consists of two aspects: the change in TFP and the bias of technological change towards input factors. Acemoglu (Reference Acemoglu2002, Reference Acemoglu2007) leaves unanswered whether the result would still be the same if technological change consisted of these two aspects.
Empirical support is needed regarding the direction of technological change in the real world, as there are several factors undermining the reliability of the theoretical predictions. First, in most of the models regarding technological change and non-renewable resources, only two inputs are considered, with labor often being excluded. Second, the world is utilizing both renewable and non-renewable energy, so predictions considering non-renewable resources may not be accurate. Third, theoretical models differ from each other in their assumptions, and propose different conditions for the direction of technological changes. Comparative to our topic, Acemoglu (Reference Acemoglu2010) discusses whether labor scarcity encourages technological advances, with the answer depending on the economic environment (functional form). Similar reasoning also stands if we talk about energy in place of labor.
In the theoretical framework of Acemoglu (Reference Acemoglu2002, Reference Acemoglu2007), the direction of technological change depends on the elasticity of substitution between inputs. However, it is difficult to draw an empirical answer by estimating the elasticity of substitution, especially when three input factors are involved. The actual threshold that decides the direction of technological change is unclear, and including three inputs in the estimation requires a nesting structure in the form $(K,L)E$ , $(K,E)L$
 or $(E,L)K$
 (if we consider capital, labor and energy as inputs), as in the cases of Kemfert and Welsch (Reference Kemfert and Welsch2000), Su et al. (Reference Su, Zhou, Nakagami, Ren and Mu2012) and Dissou et al. (Reference Dissou, Karnizova and Sun2014). This complicates the analysis greatly, not to mention further research that may include four or more inputs. This form also makes it difficult to compare the technological change augmented to each input factor.
Different empirical methods and measures have been applied to analyze the direction of technological change. Simple measures for technological progress regarding energy include the ratio of energy input-to-GDP/GNP and cost shares of inputs (Hogan and Jorgenson, Reference Hogan and Jorgenson1991; Sanstad et al., Reference Sanstad, Roy and Sathaye2006); the former does not allow us to compare the technological change augmented to different inputs, and the latter does not perfectly reflect the productivity change since a change in cost shares can result from multiple reasons.
Considering only two input factors, Klump et al. (Reference Klump, McAdam and Willman2007) estimate a supply-side system of the U.S. economy from 1953 to 1998, and find that labor-augmenting technical progress is exponential, while the growth of capital-augmenting progress is hyperbolic or logarithmic. Dong et al. (Reference Dong, Guo, Wang and Dai2013) use inter-provincial panel data from China to find that technological change is biased towards capital rather than labor. By studying the substitutability between energy and capital in manufacturing sectors in 10 OECD countries, Kim and Heo (Reference Kim and Heo2013) conclude that the the adoption of energy-saving technologies has not been induced by increased energy prices. Yet the results of these studies are not fully convincing as they leave a major input factor unconsidered. A comprehensive empirical analysis of technological change regarding energy should at least take capital and labor into account as well.
Stochastic frontier analysis was first introduced by Aigner et al. (Reference Aigner, Lovell and Schmidt1977) and Meeusen and Van den Broeck (Reference Meeusen and Van den Broeck1977). Over the years this method has been developed by a great number of subsequent studies, including Kumbhakar (Reference Kumbhakar1990), Kumbhakar et al. (Reference Kumbhakar, Denny and Fuss2000), Wang (Reference Wang2002), Wang and Schmidt (Reference Wang and Schmidt2002), Greene (Reference Greene2005), Kumbhakar and Wang (Reference Kumbhakar and Wang2005), Chen et al. (Reference Chen, Schmidt and Wang2014), Parmeter and Kumbhakar (Reference Parmeter and Kumbhakar2014), and others. It assumes that the error term is composed of a noise term and an inefficiency term, and it was, at first, used to discuss the inefficiency in production and its determinants. Although more often applied in micro-level studies, SFA is also used to investigate macro-level production processes, for example, by Heshmati and Kumbhakar (Reference Heshmati and Kumbhakar2011) who use province-level data from China and Kumbhakar and Wang (Reference Kumbhakar and Wang2005) who assume capital and labor as inputs.
In recent years, SFA has been applied in energy economics to address the issue of directed technological change. Two approaches are most frequently applied: the distance function approach and the production function approach. The distance function approach allows us to analyze the technical efficiency in a production procedure that involves multiple outputs; recent applications in energy economics include Boyd and Lee (Reference Boyd and Lee2019) and Liu et al. (Reference Liu, Pollitt, Xie and Liu2019), among others. The production function approach, on the other hand, facilitates the calculation of a set of indicators for technological change. Wesseh and Lin (Reference Wesseh and Lin2016) analyze the effectiveness in using renewable and non-renewable energy in African countries. Shao et al. (Reference Shao, Luan, Yang and Li2016) study whether technological change has taken place in a way that alleviates the dependence of industrial production on CO2 emissions in Shanghai. Yang et al. (Reference Yang, Shao, Yang and Miao2018) investigate whether technological change is biased towards fossil energy or non-fossil energy in China's industrial sector. Still, the literature lacks an idea of the whole picture of the world's directed technological change regarding energy; analysis from a broader perspective is needed to assess how macro-level technological change has been unfurling in the global context.
One of our study's contributions is its empirical analysis of country-level production in a worldwide perspective, with capital, labor and energy as inputs. Besides this general contribution on the way changes have been taking place in macro-level production in the world (or at least in the sample countries), the methodology also allows the comparison of different patterns of development between countries. Findings can be considered as evidence that provides support to theoretical studies, as well as a reference for policy making.
3. Methodology and data
3.1. Stochastic frontier production function and estimation method
A method is proposed in studies of SFA, such as Kumbhakar et al. (Reference Kumbhakar, Denny and Fuss2000), for decomposing productivity change into efficiency change, technical change and scale effects. The authors also provide examples of TFP change decomposition at the industry level. Shao et al. (Reference Shao, Luan, Yang and Li2016) use panel data from 32 industrial subsectors in Shanghai from 1994–2011 to investigate and compare the degrees of technological change bias to four production factors, i.e., capital, labor, energy, and carbon emissions. The results show that in most subsectors, technological change was biased towards energy during the sample period. Nevertheless, the study adopts the production function approach with carbon emission as an input, which is a compromise to facilitate the analysis of the biasedness of technological change. Carbon emissions are, as a matter of fact, an output resulting from production and the distance function is the most proper functional form to describe such a process, as in Duman and Kasman (Reference Duman and Kasman2018). In the macro context, since there is not a global carbon emissions market where carbon emissions would incur comparable costs, we opt not to take it as an input.
Thus we estimate a stochastic frontier model with three inputs: capital, labor and energy, and try to assess the direction of technological progress.
Referring to Kumbhakar et al. (Reference Kumbhakar, Denny and Fuss2000), Heshmati and Kumbhakar (Reference Heshmati and Kumbhakar2011) and Shao et al. (Reference Shao, Luan, Yang and Li2016), suppose the production function is

where i represents a country, t represents the number of the time period, and $u\geq 0$ denotes output-oriented technical inefficiency. Technical change is defined as
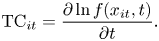
The overall productivity change is affected by both technical change and change in technical efficiency (TEC). Assuming input quantities fixed, we have

where ${\rm TEC}_{it}=-({\partial u_{it}}/{\partial t})$ . When input quantities change, productivity change is measured by TFP change which is defined as

where $S_{j}^{a}=w_{j}x_{j}/\sum _{k}w_{k}x_{k}$ , with $w_{j}$
 being the price of input $x_{j}$
 . The dot denotes time growth rate. Differentiating (1) and using (4), we get

where ${\rm RTS}=\sum _{j}({\partial \ln y}/{\partial \ln x_{j}})=\sum _{j} ({\partial \ln f(\cdot )}/{\partial \ln x_{j}})=\sum _{j}f_{j}(\cdot )x_{j}/f(\cdot )\equiv \sum _{j}\eta _{j}$ is the measure of returns to scale; $\eta _{j}$
 are input elasticities defined at the production frontier, $f(x,t);\ \lambda _{j}=(f_{j}x_{j}/\sum _{k}f_{k}x_{k})=\eta _{j}/{\rm RTS}$
 ; and $f_{j}$
 is the marginal product of input $x_{j}$
 . Therefore, TFP change is decomposed into scale components, technical change, technical efficiency change and price effects.
In previous empirical studies (Shao et al., Reference Shao, Luan, Yang and Li2016; Wesseh and Lin, Reference Wesseh and Lin2016; Yang et al., Reference Yang, Shao, Yang and Miao2018), a translog production function of a second-order Taylor approximation is generally adopted. It allows variable substitution elasticities and is very suitable for calculating the biased technological change. As proposed by Greene (Reference Greene2005), and also done by Yang et al. (Reference Yang, Shao, Yang and Miao2018), we let the model account for fixed effects, which is represented by country dummies. Considering capital, labor and energy as inputs, we build the following translog production function:


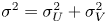
where Y represents the total output; K, L, E denote capital input, labor input and energy input, respectively; parameters $\beta _{x}$ are to be estimated; V is the noise term while U is the technical inefficiency term, hence the compounded residual variance $\sigma ^{2}=\sigma _{U}^{2}+\sigma _{V}^{2}$
 Footnote 1; $D_i$
 represents country dummies and $\alpha _i$
 are the corresponding coefficients. A parameter $\gamma =\sigma _U^2/(\sigma _U^2+\sigma _V^2)(0\leq \gamma \leq 1)$
 represents the share in the compounded residual variance derived from technical inefficiency. As the assumption is made such that the error terms are not normally distributed and the conditional mean of the errors is different from zero, the basic assumption of the ordinary least square method is violated. Following Battese and Coelli (Reference Battese and Coelli1995) and Kumbhakar et al. (Reference Kumbhakar, Wang and Horncastle2015), we estimate the function above with the maximum likelihood method, where the likelihood function is expressed in terms of the variance parameters $\sigma _U^2$
 and $\sigma _V^2$
 .
Referring to Kumbhakar et al. (Reference Kumbhakar, Denny and Fuss2000),Footnote 2 the growth rate of the TFP can be decomposed as

The first term, ${\rm TP}_{it}$ , denotes technological progress, which is defined as

where $\beta _{t}$ is the neutral technological change rate of the world, or our sample countries; and $\beta _{tK}\ln K+\beta _{tL}\ln L+\beta _{tE}\ln E_{it}$
 is the non-neutral technological change, which is heterogeneous across different countries.
The second term, ${\rm TEC}_{it}$ , denotes technical efficiency change over time:

where ${\rm TE}_{it}=\exp (-U_{it})$ .
The third term, ${\rm SEC}_{it}$ , denotes the scale efficiency change, which reflects the improvement in productivity benefitting from scale economy:

where j=K,L,E denotes the input factor; $\dot {X}_{jit}$ is the growth rate of each input; and $\eta _{jit}$
 is the output elasticity with respect to each input. The scale effect index is ${\rm RTS}_{it}=\eta _{Kit}+\eta _{Lit}+\eta _{Eit}$
 , where the output elasticities of capital, labor and energy, respectively, are calculated as:


An indicator for the biasedness of technological change, according to Shao et al. (Reference Shao, Luan, Yang and Li2016) and Yang et al. (Reference Yang, Shao, Yang and Miao2018), originating from Diamond (Reference Diamond1965), the biased technological change index $Bias_{sj}$ can be used to estimate the relative biased degree of technological change to each input:

where s and j represent different inputs; and $f_{s}$ or $f_{j}$
 is the derivative of the function f with respect to s or j.
${\rm Bias}_{sj}>0$ means that the marginal output growth rate of s caused by technological change is greater than that of j, indicating that technological change is biased to factor s; and vice versa. If ${\rm Bias}_{sj} =0$
 , it means that technological change in the production is Hicks neutral.
3.2. Data
We collect annual data from 1991 to 2014 for 16 developing and developed countries located in different geographic areas of the world, namely the US, Japan, Germany, the UK, Canada, France, Italy, Australia, China, India, Brazil, South Africa, Mexico, Argentina, Indonesia and Russia. In selecting the countries to be included in our sample, we consider equal numbers of developed and developing countries, all chosen for their weight in terms of real GDP in the world; we also selected countries in different geographic areas (continents) of the world, in order to retain a certain degree of diversity.
There are eight developing countries and eight developed countries in the sample. The US, Japan, Germany, the UK, Canada, France, Italy and Australia are among the nine developed countries with the highest real GDP in the world (ranking according to the World Bank); Spain is in 8th place and is substituted with Australia, in order to avoid excessive weight of European countries in the sample. Likewise, China, India, Brazil, South Africa, Mexico, Argentina, Indonesia and RussiaFootnote 3 are among the 11 developing countries with the highest real GDP in the world. The real GDP of these countries accounts for over 90 per cent of the world's real GDP.Footnote 4 Throughout the sample period or for most of it, the US, Japan, Germany, the UK, France, Italy, China, India and Brazil are energy importers; while Canada, Australia, South Africa, Mexico, Argentina, Indonesia and Russia are energy exporters.Footnote 5
To estimate the stochastic frontier translog production function, we collect the following data:
Y - real GDP collected from the database of the Federal Reserve (at https://fred.stlouisfed.org/) in constant 2011 US$.
K - capital stock collected from the database of the Federal Reserve, in constant 2011 US$.
L - working population collected from the database of the Federal Reserve. For some countries, direct data for the working population is not available, and we obtain such data from the employment-to-population ratio (15–64 years) and the population between 15 and 64 (collected from the database of the World Bank at https://data.worldbank.org/) in these countries.
In accounting for labor input, we choose to adopt working population as a proxy, instead of other proxies that account for human capital. Nevertheless, there are a number of different ways for estimating human capital (Stroombergen et al., Reference Stroombergen, Rose and Nana2002), and human capital measurement is context-specific (Baron, Reference Baron2011), so it is difficult to determine a proper measure of human capital; in estimating human capital, inaccuracies may arise that will generate trouble for our empirical analysis. Besides, the output elasticity of labor that we calculate is by itself, to some degree, a measure of human capital.
E - total primary energy consumption in Mtoe (millions of tons of oil equivalent), from the Global Energy Statistical Yearbook 2018.
Country data for the share of renewables in energy production is available; yet, we are lacking the information on the share of renewables in energy consumption, which stops us from treating renewable and non-renewable energy separately.
Following the true fixed effects model of Greene (Reference Greene2005), country dummies are included in the estimation to account for country-level fixed effects. We drop the first country dummy in order to avoid multicollinearity, thus we have 15 dummies left.
Hypotheses of unit roots are rejected for most countries.Footnote 6 The descriptive statistics of the data are shown in table 1.
Descriptive statistics of input and output data

4. Results and discussion
4.1. The production function
The first step of our empirical analysis is to estimate the translog production function (6). Along with the estimation process, several specification tests are implemented in order to make sure that the production function is well-defined. Then, based on the estimated parameters, we derive the output elasticities, TFP growth rate, and factor bias index, among other indexes.
To examine whether the specification of the production function is valid and effective, the following specification tests are necessary:
(1) Whether the stochastic frontier production model is effective: $H_{0}:\sigma _{U}^{2}=0$
 . If the null hypothesis is not rejected, it means that no technical inefficiency exists and that the SFA is not needed.
(2) Specification test of the production function form of the stochastic frontier model: $H_{0}:\beta _{t}=\beta _{tK}=\beta _{tL}=\beta _{tE}=\beta _{KL}=\beta _{KE}=\beta _{LE}=\beta _{KK}=\beta _{LL}=\beta _{EE}=0$
. If the null hypothesis is not rejected, it means that the production function should be Cobb–Douglas instead of the translog one.(3) Whether there is technological progress in the frontier production function: $H_{0}:\beta _{t}=\beta _{tK}=\beta _{tL}=\beta _{tE}=0$
. If the null hypothesis is not rejected, it would imply that the production function does not vary through time, hence the technological progress in the frontier production function does not exist. If technological progress does exist, it is also necessary to test whether the technological progress is neutral or not: $H_{0}:\beta _{tK}=\beta _{tL}=\beta _{tE}=0$.(4) Whether there exist fixed effects across the 16 countries in the sample: $H_{0}:\alpha _{2}=\alpha _{3}=\cdots =\alpha _{16}=0$
. Not rejecting the null hypothesis implies that there are no fixed effects.





We use the generalized likelihood statistic $LR=-2\ln [L(H_{0})/L(H_{1})]$ to test the hypotheses, with $L(H_{0})$
 and $L(H_{1})$
 being the log likelihood function values of the null hypothesis and the alternative hypothesis. The threshold values are according to Kodde and Palm (Reference Kodde and Palm1986). The results of the tests are shown in table 2.
Results of specification tests of the production function

As we can see from table 2, the null hypothesis of test (1) is rejected, meaning that technical inefficiency does exist, and the assumption on residuals is valid. The null hypothesis of test (2) is rejected, so that the Cobb-Douglas production function is outperformed by the translog functional form which better describes the production process. The result of test (3) implies that technological progress exists in the sample countries' production and is not neutral.
The estimated results of the translog production function are shown in table 3. Most parameters of the translog production function are statistically significant. As we see from the maximum likelihood function value and the result of the LR test, the explanatory power of the model is quite convincing. We can calculate $\gamma =\sigma _{U}^{2}/(\sigma _{U}^{2}+\sigma _{V} ^{2})=0.9418$ , which implies that the variation of the compounded residual is mainly caused by technical inefficiency. The stochastic frontier model better describes the production process of the sample countries than a model with classic assumptions on residuals.
Estimated results of the translog production function

Note: Standard errors for coefficients are in parentheses.
Statistical significance: ***p<0.01, **p<0.05.
Several equations alternative to (6) were considered in the estimation. For example, when we include one time dummy (the value being 1 for the years starting from 2008) or two time dummies (the value being 1 for the years starting from 1998 and 2008, respectively) to account for economic crises, there is very little difference in the estimated coefficients, or in the results for other subsequently calculated indicators. When we include a dummy which takes the value as 1 for energy exporters instead of country dummies, although the average levels of the output elasticities are slightly different, their trends remain similar, while the values of the bias indices are more volatile and cannot provide information accurate enough for our analysis. Thus we decide to keep the empirical model in the form of equation (6).
4.2. Output elasticities and total factor productivity growth rate
We use the formulas (7)–(13) to calculate the output elasticities with respect to each input factor, as well as technological progress (TP), technical efficiency change (TEC), scale efficiency change (SEC) and the growth rate of total factor productivity (TFPGR). Table 4 shows the results for the average of the 16 countries in the sample. We obtain confidence intervals from 1,000 bootstrap replications, which is shown in tables A1 and A2 in the appendix. Levels of statistical significance are marked in table 4.
Output elasticities of input factors and TFP growth rate: average of the 16 countries

Significance: ***p<0.01, **p<0.05, *p<0.1, obtained from 1,000 bootstrap replications.
The growth rate of TFP in the sample countries was rather steady around the average growth rate until the early 2000s. Then the growth rate increased to a higher level for a few years, and suffered from a sudden fall in 2008 and 2009, possibly as a consequence of the financial crisis. A similar fluctuation also happened in 1998, possibly due to the financial crisis that took place in East Asia and Russia. The values of technical efficiency change (TEC) and scale efficiency change (SEC) fluctuate around zero, with their absolute values being much smaller than those of technological progress (TP), which remains at a quite stable level. This indicates that the growth in TFP in the sample countries mostly depends on technological progress instead of improvements in technical efficiency and scale efficiency.
Among the three input factors in our model, the output elasticity for labor is the highest, followed by energy, while the output elasticity of capital is the lowest among the three. This implies that in the contemporary world, the economy has already passed the phase when its growth was mainly driven by the accumulation of capital. Instead, labor is playing a central role in boosting production; the economy is also depending more and more on the use of energy.
The values for the output elasticity of labor and energy are all statistically significant; the output elasticity of capital, for most time periods, is not statistically different from zero. Nonetheless, the standard errors of the output elasticity of the three inputs are similar, and for most time periods there is no intersection between the confidence intervals of the output elasticity of capital and that of other inputs. So there is little doubt that the output elasticity of capital is the lowest among the three inputs factors.
Figure 1 shows the average output elasticity for the sample countries over the years. Generally, the output elasticity of capital is decreasing, while that of labor and energy is increasing. In addition, the output elasticity of energy is increasing at such a high rate that its gap from the output elasticity of labor is diminishing. Although there is an intersection in the confidence intervals of the output elasticity of labor and that of energy, if we look at table 5, we can find that the bias index $E\hbox{--}L$ is statistically significant and positive in most time periods, implying that technological change is indeed biased towards energy rather than labor.
Average output elasticity for the sample countries.

Annual average factor bias index of the selected countries

Statistical significance: ***p<0.01, **p<0.05, *p<0.1, obtained from 1,000 bootstrap replications.
Figure 2 shows the returns to scale (RTS) of the 16 countries from 1991 to 2014. The RTS of the countries range from 0.70 to 1.22; from 1991 to 2014, the average returns to scale of the eight developed coutries is 0.843, while the average returns to scale of the eight developing countries is 0.994, with the average of the 16 countries equal to 0.919. Developing countries have generally been enjoying higher returns to scale; China, India and Russia have average returns to scale greater than 1. The average of the sample countries, however, shows decreasing returns to scale, which is a phase that each country will finally come to when they become better developed. Among the 16 countries, China has the highest average returns to scale over the years. The average returns to scale of Italy is the lowest, significantly lower than that of the other countries. While China, Russia and India are all countries with immense populations and geographic areas, which may be part of the reason for their high returns to scale, it is still hard to explain the gap between the returns to scale of Italy and those of other countries.
Returns to scale of the 16 countries, 1991–2014.

Figure 3 illustrates the averages over the years of the TFP growth rate and the output elasticities of the three input factors for each country in our sample. Among capital, labor and energy, the output elasticity of labor is the highest for developed countries, while in developing countries the output elasticity for energy is the highest, or very close to the highest (in the case of Brazil, Argentina and Indonesia). This reveals different patterns of economic growth in developed and developing coutries. For developed countries, labor plays more of a role as the driver for economic growth. The higher elasticities of labor in developed countries reflect higher levels of education; as a consequence, industries that require highly skilled workers (e.g., the IT sector, service sector and financial sector) are better developed. Developing countries, on the other hand, rely more on the use of energy to sustain their growth; there is great potential for them to boost their long-term economic growth by improving education levels.
Average TFP growth rate and output elasticities of various inputs for the 16 countries in the sample.

It is worth noticing that for some observations, e.g., the U.S. and China, there are negative values for the output elasticity with respect to capital. The direct factor that leads to such a phenomenon is the negative coefficient on the term $\ln K$ , along with the large standard deviation in the data for capital. From a theoretical point of view, this is not quite feasible since rational agents will not invest if the output elasticity is negative. Nevertheless, in our micro-level study (Hou et al., Reference Hou, Roseta-Palma and Ramalho2020), negative output elasticity is not rare in firm-level observations. Meanwhile, we try to explain such phenomena with the following possible reasons.Footnote 7
(1) Limited information. Usually, agents do not mathematically calculate output elasticity; they usually increase all inputs simultaneously and observe an increase in production, so they keep investing in the same way.
(2) Investment externalities. From the perspective of individual agents, they may be making optimal investment decisions, which are not necessarily also optimal for the whole economy at the macro-level, as they do not take into account the externalities of their investment. A micro-level study might provide more information regarding this topic.
(3) Real estate price. Increases in capital stock are partly due to rising real estate prices, which have no effect on production.
(4) Preference for domestic investment. Some agents prefer to invest their money in domestic markets, because of risk concerns or difficulties in investing their money abroad (where the output elasticity of capital is higher).
We can also observe significant differences between the growth rates of TFP in different countries in the sample. The growth rates of the US, China and Russia are the highest, while the growth rates of Italy, Brazil and Mexico are the lowest. This reflects the progress each country has made in technological development. For countries like Italy, Brazil and Mexico, encouraging technological R&D and the adoption of new technologies might be a solution for ameliorating their economic performance.
4.3. Directed technological change
According to equation (14), we calculate the factor bias index of technological change for the 16 countries in the sample. Table 5 shows the average factor bias index of the countries in the sample from 1991 to 2014, marked with levels of statistical significance obtained from 1,000 bootstrap replications. We can observe that while some changes take place in the first half of the sample period, the values of the bias indices and the bias order is quite stable in the second half of the sample period. The main change is the bias order for capital: in the beginning it takes the first place in the bias order of technological change, but soon it loses the lead and moves to the second place; in the end, capital is the least favored by technological change among the three input factors. For most time periods, technological change is biased the most towards energy, which is what we are trying to find out from our research. Technological change is not biased to labor at first; from 2005 onwards, the bias order of labor exceeds that of capital. Throughout the sample period, the main trend for the bias order is K<L<E, and this order is likely to remain the same in the near future.
In the modern world where technology is highly developed, technological progress usually takes place in a subtle manner. The absolute values of the bias indices are usually small, hence sometimes they may not be statistically significant. Nevertheless, in most time periods, the bias indices $E\hbox{--}L$ are statistically significant, indicating that technological change is biased more towards energy than labor. The situation is similar in the bias indices for each country. Even though we cannot be fully confident in the other bias indices judging from the levels of statistical significance, if we relate the results in the bias indices with the trends in the change of output elasticities of the inputs, we can infer that the overall technological change of the sample countries is biased the most towards energy, followed by labor, and the least towards capital.
Table 6 shows the average factor bias index in the period 1991–2014 for each country in the sample. The technological change bias order is L<K<E for the US and China; L<E<K for Japan, Germany, Canada, France and Russia; and K<L<E for the other countries in the sample. From an intuitive perspective, there are some patterns for countries that share the same bias order. Two major economies in the contemporary world, the US and China, share the bias order L<K<E; countries with the bias order L<E<K are well-developed countries or former major economies of the world; and most developing countries have the bias order K<L<E.
Country average factor bias index

Statistical significance: ***p<0.01, **p<0.05, *p<0.1, obtained from 1,000 bootstrap replications.
We observe one common point In the bias orders of all 16 countries: technological change is always biased more towards energy than labor. What makes the difference is the position of capital, or in other words, how much capital is favored by technological change. Though it may not be practical to present bias indices for each single observation in our paper, our results indicate that in most countries, the bias index $K\text {--}L$ and bias index $K\text {--}E$
 are decreasing, which can also be reflected in the change of values in table 5. But the time when the sign of bias index changes (if it does) differs in each country, which leads to the difference in overall bias orders. It seems to be a sequential issue. While, on the one hand, there may be further country-specific factors giving rise to this ‘sequential issue’, on the other hand, we cannot exclude the effect of other potential determinants on the bias orders. So there remains room for discussion regarding the determinant(s) of the direction of technological change.
One may naturally wonder if there is a connection between the direction of technological change and the energy balance of trade. For all or most time periods, the US, Japan, Germany, the UK, France, Italy, China, India and Brazil are energy importers; while Canada, Australia, South Africa, Mexico, Argentina, Indonesia and Russia are energy exporters. According to our finding, technological change is biased the most towards energy in the energy-exporting countries except for Canada and Russia; meanwhile, there are energy-importing countries where technological change is also biased the most towards energy. It is then quite difficult to conclude that the energy balance of trade determines the direction of technological change. One possible explanation could be that, on the one hand, due to underdevelopment in industries, most of the developing countries are not able to consume the total amount of energy produced nationally; on the other hand, facing comparatively lower levels of education, a more direct way to improve output could be better utilization of energy input.
Now we see that technological change is biased the most towards energy, both for the average of the 16 countries and for most countries in the sample individually. In particular, evidence is strong that technological change is biased more towards energy rather than labor. Labor, of course, can be considered as a renewable input; energy input is, at least partly, non-renewable. In this sense, our findings support the hypothesis that technological change is more likely to favor the non-renewable rather than the renewable input. However, the main determinant of the biasedness of technological change remains dubious. Is it market size, or price incentives, or other factors that decide the direction of technological change? Do agents take into account the fact that some input is non-renewable when they make R&D decisions? To answer such questions, we need not only more empirical evidence, but theoretical support as well.
5. Conclusion
In this paper we apply stochastic frontier analysis to data for 16 countries in order to assess the technological change in production at the macro-level with three input factors: capital, labor and energy. As has rarely been applied in SFA studies, we use bootstrap to obtain confidence intervals and statistical significance levels, in order to have more rigorous and convincing results.
Our findings indicate that, in the sample countries between 1991 and 2014, on average, output elasticities of energy and labor are increasing; specifically, the output elasticity of energy grows at a higher rate so that it is catching up with the output elasticity of labor, which is supported by the statistically significant bias index between energy and labor. The output elasticity of capital is decreasing, and has negative values for some observations; yet agents keep investing in capital, possibly because of limited information, investment preference, real estate prices or investment externalities. Among the three input factors, the output elasticity of labor is the highest for developed countries, and the output elasticity of energy is the highest or very close to the highest for developing countries. In addition, compared with developed countries, developing countries are more likely to enjoy higher returns to scale in production.
Nonetheless, we find that the average production of all sample countries demonstrates decreasing returns to scale. Results also show a significant difference between the TFP growth rates in the countries in the sample. For some countries, the advice on policy making might be to encourage technological progress, in order to sustain their economic growth.
By calculating the factor bias index, we find that for the general trend of the 16 countries and for most countries in the sample, technological change is biased the most towards energy. Different countries demonstrate different technological change bias orders, but technological change commonly favors energy rather than labor. This could be evidence that technological change is more likely to be biased towards the non-renewable input than the renewable.
The purpose of our study was to analyze directed technological change in worldwide production activities; if, by any chance, it could provide a clue for studies in economic growth or other fields of macroeconomics, it would be satisfying. However, it still leaves some difficult questions to be answered. For countries with the same bias orders, is there any common pattern? What determines the direction of technological change? These topics can be addressed in future studies.
Acknowledgments
We would like to thank the reviewers and the editors of Environment and Development Economics for their support and valuable comments. The paper also benefitted from discussions with Prof. David Maddison, Prof. Pedro Cerqueira, Prof. Elias Soukiazis and other participants of the INFER workshop “Economic Development Thinking the Environment”. Zheng Hou appreciates the financial support from ISCTE-IUL. All authors are pleased to acknowledge financial support from Fundação para a Ciência e a Tecnologia (Grant UID/GES/00315/2019).
Appendix
Output elasticities of input factors: average of the 16 countries 95% bias-corrected confidence intervals in parentheses, from 1,000 bootstrap replications

Total factor productivity growth rate and its components: average of the 16 countries 95% confidence intervals in parentheses, from 1,000 bootstrap replications



