I. INTRODUCTION
Rechargeable lithium-ion batteries (LIBs) have been commonly used as a power source for numerous portable electric devices due to their high energy density. Carbonaceous materials like graphite is widely used as anodes in commercial LIBs because of their stable voltage profile, good capacity and reasonable cost.Reference Shim and Striebel1 However, graphite suffers high irreversible capacity loss and poor cycling life due to which its overall performance is inadequate to satisfy the demands for the high power and/or energy densities applications such as electrical/hybrid vehicles and miscellaneous power devices. In recent years, metal oxides (MOx, M = Co, Ni, Mn and Fe etc.) have been widely investigated as anode materials for LIBs, owing to their high theoretical capacity (greater than that of commercial graphite, 372 mAh/g). Among them, iron oxides are extensively studied because of many advantages such as low cost, nontoxicity, ecofriendliness, natural abundance and good structural stability.Reference Goodenough and Kim2, Reference Manthiram3 Alpha-phase ferric oxide hematite (α-Fe2O3) is capable of lithium ion (Li+) insertion/extraction in excess of 6 Li+ per formula unit resulting in a significantly higher reversible capacity. The mechanism of Li-ion intercalation/deintercalation in α-Fe2O3 materials can be described by the following equation:
 $${\rm{Fe}}_2 {\rm{O}}_3 + 6{\rm{Li}} \mathbin{\lower.3ex\hbox{$\buildrel\textstyle\rightarrow\over {\smash{\leftarrow}\vphantom{_{\vbox to.5ex{\vss}}}}$}} 3{\rm{Li}}_2 {\rm{O}}\,\,{\rm{and}}\,\,2{\rm{Fe}}\quad.$$
During cycling, Li+ insertion/extraction typically pulverize MOx into smaller metal particles due to reaction with lithium (Li) to form dilithium monoxide (Li2O), leading to a huge volume expansion and destruction of structure upon electrochemical cycling, especially at high rate. All these resulted in electrical isolation of electrodes causing poor electrical conductivity. Moreover, the extraction of Li+ from Li2O is thermodynamically impossible which further caused severe loss of capacity with cycling.
The electrical conductivity of the material can be improved by preparing composites with conductive agents such as coating with carbon, graphene and carbon nanotubes (CNTs).Reference Zhou, Song, Chen, Zhi, Yang, Huo and Yang4–Reference Lian, Zhu, Xiang, Li, Yang and Wang6 Many attempts have been made to improve the reversible capacity and rate capabilities of iron oxides by controlling the particle size, morphology, surface area and robustness. Various micro- /nanostructures of iron oxides such as nanotubes,Reference Chen, Xu, Li and Gou7 hollow microspheres,Reference Wu, Yu, Zhang and Xie8 nanoflakesReference Reddy, Yu, Sow, Shen, Lim, Rao and Chowdari9 and nanowiresReference Liu, Wexler and Wang10 have been reported as anode materials for LIBs. However, the reversible capacity and rate capabilities are not significantly improved. For instance, Liu et al.Reference Liu, Wexler and Wang10 reported α-Fe2O3 nanowires synthesized by hydrothermal method, which showed initial discharge specific capacity of 1303 mAh/g at 0.1 C-rate and capacity fade to 456 mAh/g after 100 cycles. On the other hand, mesoporous α-Fe2O3 hollow spheres exhibited an initial discharge capacity of 1279 mAh/g at current density of 60 mA/g and sharply decreased to 830 mAh/g after 15 cycles (about 65% of its initial capacity).Reference Wu, Yu, Zhang and Xie8 Nanoflakes of α-Fe2O3 prepared by thermal treatment method exhibited stable but low capacity of 680 (±20) mAh/g for 80 cycles at 0.1 C-rate.Reference Reddy, Yu, Sow, Shen, Lim, Rao and Chowdari9 Zeng et al.Reference Zeng, Tang and Li11 reported nanorods with large surface area and small particle size showed high discharge capacity at 0.2 mA/cm2. However, no cycling performance results were reported. Nuli et al.Reference Nuli, Zeng, Zhang, Guo and Liu12 synthesized α-Fe2O3 by hydrothermal method demonstrating different morphologies such as cubic, spherical, sheet-like, rod-like and wire-like nanocrystals and tested at 20 mA/g for 30 cycles. Among these samples, nanospheres exhibited highest initial discharge capacity of 1248 mAh/g but showed poor cycling properties.
Various synthetic techniques such as hydrothermal process, gas–solid growth route, microwave heat method, thermal oxidation at high temperature and surfactant-assisted synthesis have been reported to obtain metal oxides with different morphologies. Among them, surfactant-assisted technique offers excellent control over particle morphology, size and distribution.Reference Scher, Manna and Alivisatos13, Reference Donega, Liljeroth and Vanmaekelbergh14 However, to control the characteristics of the particles without any use of additional ligands, an easier method (chimie douce synthesis) using organic solvent acting as both reaction medium as well as monodentate ligand has been reported.Reference Niederberger, Garnweitner, Buha, Polleux, Ba and Pinna15, Reference Garnweitner and Niederberger16
In the present work, α-Fe2O3 with different morphologies (cocoons and rods) is synthesized by simple, scalable and surfactant-free chimie douce technique and their morphological and structural properties are studied. The electrochemical properties of α-Fe2O3 are evaluated as anode in LIBs. Li/α-Fe2O3 cell study showed markedly improved kinetics of Li intercalation/deintercalation, cycling stability and rate capabilities. It is observed that the size and morphology have remarkable effect on their electrochemical properties.
II. EXPERIMENTAL
A. Synthesis of α-Fe2O3
All the chemicals (analytical grade) were used as received without further purification. For the synthesis of α-Fe2O3 with different morphologies, N, N-diethylacetamide (DEAc) or N-methyl-2-pyrrolidione (NMP) was used as solvent while keeping other chemicals unchanged. One millimole of oxalic acid (H2C2O4) was dissolved in 10 mL of DEAc or NMP solvent. Thereafter, 1 mmol ferrous chloride tetrahydrate (FeCl2·4H2O) was dissolved in 5 mL of deionized water and mixed with the H2C2O4 solution in one shot. The mixture was stirred for 20 min at room temperature to obtain a homogeneous solution. The resultant yellow-colored precipitate obtained was separated by centrifugation (8000 rpm, 10 min) and washed with excess ethanol followed by vacuum drying at 60 °C for 12 h. The obtained powder was sintered at 400 °C at heating rate of 3 °C/min in a muffle furnace for 2 h under air to obtain α-Fe2O3.
B. Material characterization
Surface morphology and microstructure of samples were observed by field emission scanning electron microscopy using a (FESEM; model No. JEOL 7600F, JEOL Ltd., Tokyo, Japan) field- emission scanning electron microscope with an accelerating voltage of 15 kV. FESEM samples were prepared by placing α-Fe2O3 on carbon tape and sputter-coated with platinum for 40 s. Elemental compositions of samples were measured by energy dispersive x-ray spectroscopy (EDS) using INCA mapping attached with FESEM. High-resolution transmission electron microscopy (was performed using HRTEM; model No. JEOL 2100F, JEOL Ltd., Tokyo, Japan) high-resolution transmission electron microscope at an accelerating voltage of 200 kV. The samples were prepared by dispersing the powder in ethanol by ultrasonication and dropping the dispersion on a carbon-coated copper grid and dried at ambient conditions. Crystallographic characterization was carried out by powder x-ray diffraction using (XRD; model No. Shimadzu XRD-6000, SHIMADZU Corporation, Japan) x-ray diffractometer operating at 40 kV and 40 mA using Cu Kα1 radiation (λ = 1.5406 Å) with the copper target and nickel filter. The samples were scanned between 10 to 80° (2θ) at a scan rate of 2°/min. Specific surface area was determined by Brunauer-Emmett-Teller (BET) test using Micromeritics ASAP-2020 (Micromeritics Instrument Corporation, GA) nitrogen adsorption-desorption apparatus.
C. Electrode fabrication and electrochemical measurements
The composite anode was prepared by mixing α-Fe2O3, conductive additive (Super P Li Carbon, Timcal Graphite & Carbon, Switzerland) and polyvinylidene fluoride (PVDF) binder (Kynar 2801, Arkema Inc., PA) in the weight ratio of 30:50:20 respectively in NMP under magnetic stirring. The resulting slurry was casted onto etched copper foil by doctor-blade technique followed by vacuum drying at 80 °C for 24 h. Test cells, Li/α-Fe2O3 were fabricated in coin cell (CR2016) using 1 M lithium hexafluorophosphate (LiPF6) in ethylene carbonate (EC): diethyl carbonate (DEC) (1:1 wt%, Danvec, Charslton Technologies Pte Ltd., Singapore) as the electrolyte and Celgard 2400 membrane (Celgard LLC, Charlotte, NC) as the separator. Cyclic voltammetry (CV) and electrochemical impedance spectroscopy measurements were carried out on a (EIS; Solartron electrochemical impedance spectroscope, model No. 1470E and SI 1255B impedance/gain-phase analyzer coupled with a potentiostat) electrochemical workstation. CV was studied at 0.1 mV/s in the voltage range of 0.01–3 V and EIS was studied by applying an alternating current (AC) perturbation of 10 mV over frequency range of 100 kHz to 5 mHz at open circuit potential. The Nyquist plots were analyzed using Zplot and Zview programs (Version 2.2, Scribner Associates Inc., WA). Galvanostatic charge-discharge properties and cycling performance were studied using a battery test system (XWJ Neware Tech. Co. Ltd., China) between 0.01–3 V at C-rates of 1–6 C (1 C-rate ∼1005 mA/g). All the test cells were fabricated in argon (Ar)-filled glove box (H2O, O2 < 1 ppm, Mbraun, Unilab Glovebox, MBraun, Germany) using Li metal foil (∼0.59 mm thick, Hohsen Corporation, Japan) as counter- and reference electrodes.
III. RESULTS AND DISCUSSION
A. Structural and morphological characterization
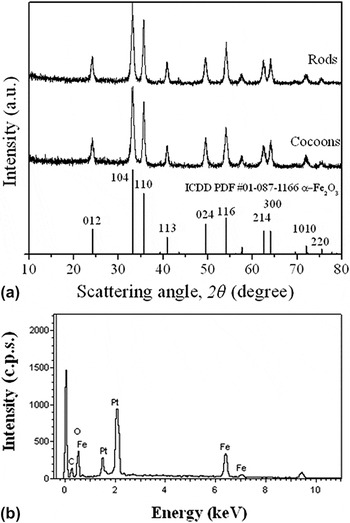
The crystallographic structure of α-Fe2O3 cocoons and rods were analyzed by XRD and presented in Fig. 1(a). It can be seen that all the reflection peaks are matching with the pure rhombohedral phase of α-Fe2O3 (Hematite, space group:R-3c) with lattice constants a = 5.03 Å and c = 13.74 Å which are consistent with values given on the standard card [International Centre for Diffraction Data (ICDD) PDF No. 01-087–1166]. This indicates that the as-synthesized materials are phase pure and well crystallized. The characteristics peaks centered at 2θ = 24.17, 33.19, 35.66, 40.90, 49.51, 54.12, 62.50, 64.06, 72.02 and 75.53° correspond to (hkl) = (012), (104), (110), (113), (024), (116), (214), (300), (1010) and (220) Miller indices respectively. It is observed that the reflection peaks of α-Fe2O3 cocoons and rods are relatively broad, suggesting small crystallites sizes. Figure 1(b) shows the EDS spectra of α-Fe2O3 cocoons as a representative sample and the results are consistent with the XRD data. The detected platinum (Pt) was sputter-coated onto the samples prior to EDS and no impurities are being detected.
(a) XRD patterns for α-Fe2O3 samples and (b) EDS spectra for α-Fe2O3 cocoons.

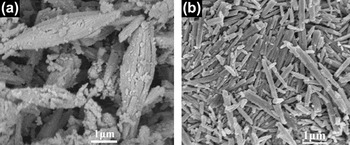
From the FESEM micrographs in Fig. 2, α-Fe2O3 cocoons are seen to be boat-shaped and have onion-like layered structure. It is clear that cocoons have rough surfaces and dimensions of 0.3–2 μm in width and 3–5 μm in length. For the case of α-Fe2O3 rods, it is observed that average diameter is ∼0.3 μm and length in the range of submicrometer to micrometer having length/diameter ratio as high as 13. It can also be observed that the rods have relatively smooth surfaces and are much densely packed, as compared with the cocoons. It is observed that there are no significant changes in the morphology of the precipitate (i.e., iron oxalates) after sintering, whereas only crystallization from iron oxalates to α-Fe2O3 products occurs. The type and feeding order of solvent clearly play a key role in the morphologies of the precipitate prepared in DEAc (cocoon) and NMP (rods). Previous reports show that variation in solubility, nucleation and growth of the products, reaction kinetics, solution properties and stability of particles in different solvent systems, are important factors for forming different shapes.Reference Polleux, Antonietti and Niederberger17 Similarly, there exist other forms of driving force for particle structural organization that can be based on ionic, covalent, hydrogen, noncovalent, metal-ligand and colloidal interactions.Reference Ozin18 Due to the low dielectric constant of DEAc (32.1) and NMP (32.5), oxalic acid does not dissociate readily (as opposed to in water) and hence iron ion and oxalic acid do not react immediately in an organic solvent medium.Reference Fuoss19 As a result, the large differences in surface energy between crystallographic planes lead to anisotropic growth of crystal structure forming distinct morphologies.Reference Jun, Choi and Cheon20 The differences in the molecular structure and weight of the solvents are also the probable reasons for variation in the kinetics factor and ion exchange reactions between iron (Fe2+) cations and intermediate oxalate (C2O42-) anions in DEAc and NMP, thus resulted in α-Fe2O3 with distinct morphologies.
FESEM micrograph: α-Fe2O3(a) cocoons (b) rods.

Figure 3 shows the TEM/HRTEM micrographs and corresponding selected area electron diffraction (SAED) pattern of α-Fe2O3 cocoons and rods. As shown in the TEM, cocoon’s onion-like layered structure is clearly portrayed in details. TEM shows that α-Fe2O3 cocoons and rods are composed of multiple small crystallites/grains, which indicate the polycrystalline nature of the samples. There are well-defined lattice fringes observed from HRTEM micrograph [Figs. 3(e) and 3(f)], which further demonstrates its polycrystalline characteristic. It is also observed that both samples are mesoporous in nature. SAED patterns of cocoons and rods [Figs. 3(c) and 3(d)] display the diffraction rings confirming polycrystalline α-Fe2O3 phase. The calculated ring spot distances of 0.36, 0.27, 0.25 and 0.22 nm can be referred to crystal planes of (012), (104), (110) and (113) respectively. These results are in good agreement with the crystallographic direction of (hkl) planes observed in XRD data.
TEM, SAED pattern, HRTEM micrographs: α-Fe2O3(a), (c) and (e) cocoons; (b), (d) and (f) rods.

B. Porosity and surface area
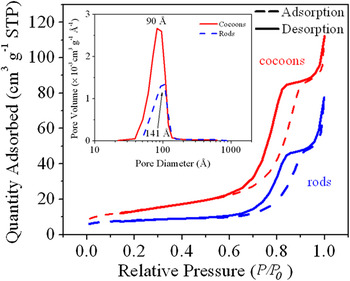
BET gas-sorption measurements were carried out on α-Fe2O3 samples to study the porosity and specific surface area. The nitrogen adsorption-desorption isotherms (at 77 K) of these samples are shown in Fig. 4. The isotherms are clearly of Type IV showing a hysteresis loop at high values of P/P0 (0.65–1.0).Reference Webb and Orr21 The sudden increase after relative pressure P/P0 > 0.65 indicates the presence of secondary pores due to aggregation of the micrometer-sized particles. In the intermediate relative pressure, the adsorption of N2 for α-Fe2O3 cocoons gradually increases with P/P0 and show higher adsorptive capacity as as compared with rods. The initial gas adsorbed by α-Fe2O3 cocoons is 8.94 cm3/g which is ∼148% higher than rods. The BET surface area of α-Fe2O3 cocoon and rods is 48.4 and 27.9 m2/g respectively. The high surface area of α-Fe2O3 cocoon is considered as one of the important factors for achieving enhanced reversible Li storage capacity. The inset (Fig. 5) shows the pore size distribution data corresponding to N2 desorption isotherm obtained by Barrett-Joyner-Halenda (BJH) method. The pore size distribution for α-Fe2O3 displays a dominant peak at 90 and 141 Å for cocoon and rods respectively, indicating that the mesopores are widely distributed over the range of 39 and 155 Å. The mesoporous structure for α-Fe2O3 cocoons and rods confirmed by BET measurements is in good agreement with HRTEM analysis.
N2 adsorption-desorption isotherm curves. Inset: BJH pore-size distribution.

C. Cyclic voltammetry
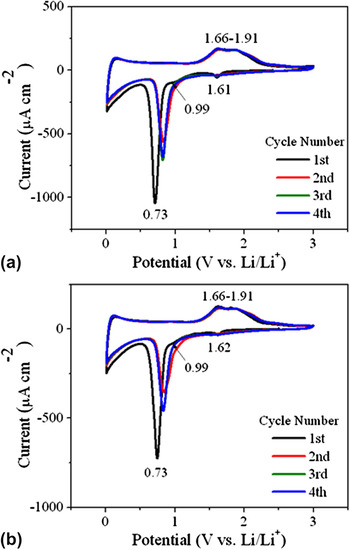
Figure 5 shows the cyclic voltammogram of α-Fe2O3 anodes for the first 4 cycles at a scan rate of 0.1 mV/s cycled between 0.01 and 3 V. It is clear that there is substantial difference between first and the subsequent cycles. Three cathodic current peaks positioned at about 1.61, 0.99 and 0.73 V is observed in the first cycle. In subsequent cycles, the high intensity peak initially located at 0.73 V is shifted slightly to higher potential (0.8 V) with decreased peak intensity and other peaks have disappeared. This may be associated with the decomposition of electrolyte to form an organic layer deposited on the surface of the electrodes i.e., solid-electrolyte interface (SEI) layer,Reference Chen, Xu, Li and Gou7 lithium-ion intercalation into the crystal structure of α-Fe2O3, reversible conversion reaction of α-Fe2O3 to form Li2O and metallic iron (Fe0) particles.Reference Liu, Wang, Park, Wang, Liu and Zhang22 In the anodic process, only one broad peak (1.66–1.91 V) which corresponds to the reversible oxidation step of Fe0 to Fe3+ is seen in the first and subsequent cycles. There are no differences observed for the anodic peak during cycling. From the first to third cycle, both the peak current and the integrated area of the CV curve are decreased, which indicate irreversible capacity loss during discharge. However, integrated area of the CV curve remains constant and well matched after 3rd cycle indicating good reversibility of α-Fe2O3 cocoons and rods. The fact that the peak current and integrated peak area are much higher for α-Fe2O3 cocoons than for the rods, reveals that α-Fe2O3 cocoons electrode has higher capacity and reactivity.
CV profile at 0.01–3 V at a scan rate of 0.1 mV/s: α-Fe2O3(a) cocoons and (b) rods.

D. Evaluation in half-cells
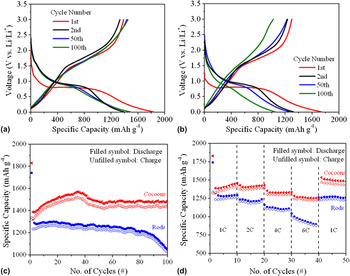
Figures 6(a) and 6(b) shows the selected charge-discharge voltage profiles of α-Fe2O3 electrodes cycled between 0.01–3 V and constant current rate of 1 C (∼1005 mA/g). It is observed that the charge-discharge curves are almost similar for cocoons and rods, indicating identical electrochemical behavior of α-Fe2O3 with Li and are in good agreement to earlier reports.Reference Wu, Yu, Zhang and Xie8, Reference Liu, Wexler and Wang10, Reference Hassan, Rahman, Guo, Chen and Liu23 In the first discharge curve, it is observed that potential decreases sharply to ∼1.5 V for α-Fe2O3 cocoons and ∼1 V for the rods, followed by a weak slope corresponding to Li insertion into the crystal structure of α-Fe2O3. When the potential decreases to ∼0.8 V, an obvious voltage plateau is seen, indicating the reduction of iron from Fe3+ to Fe0 and thereafter followed by a smooth decrease in the voltage during discharge. The electrochemical behavior is in good agreement with the results observed in CV measurements.
Charge-discharge profile versus specific capacity (1 C-rate): α-Fe2O3(a) cocoons (b) rods, (c) galvanostatic cycling performance (1 C-rate) and (d) rate capabilities performance.

It is observed that initial discharge capacity of 1830 and 1741 mAh/g for cocoons and rods respectively is much higher than the theoretical capacity of α-Fe2O3 (1005 mAh/g). This is probably due to the well-known phenomenon of decomposition of the electrolyte, SEI layer formation and the reversible formation of a gel-like layer.Reference Hassan, Rahman, Guo, Chen and Liu23–Reference Hassan, Guo, Chen and Liu25 From the second discharge profile, only one voltage plateau between 1 and 0.8 V corresponding to the final reduction of α-Fe2O3 to metallic Fe0 is observed. The cell delivers with a discharge capacity of ∼1481 and 1490 mAh/g for α-Fe2O3 cocoons and ∼1263 and 1050 mAh/g for rods after 50 and 100 cycles respectively.
Figure 6(c) shows the cycle performance of α-Fe2O3 cell cycled at 1 C-rate for 100 cycles. It is observed that there is no significant capacity loss for α-Fe2O3 cocoons after 100 cycles while a sharp capacity fade is observed for rods after 80 cycles amounting to ∼16.8% capacity fade (based on 50th cycle). The stable cycling performance of α-Fe2O3 cocoons is better than the same for the composite reported elsewhere.Reference Hassan, Rahman, Guo, Chen and Liu23 These results revealed that morphological discrepancies such as particle size, surface area and porosity affect the Li+ intercalation/deintercalation in the crystal structure of α-Fe2O3. It is worth noting that α-Fe2O3 cocoons exhibit better cycling performance than rods, which may be due to size effect and morphology-dependent electrochemical properties. The high surface area of α-Fe2O3 cocoons favor Li+ insertion/extraction in the process of charge/discharge and maintain the integrity of the electrode materials leading to better cycling performance.
The electrochemical performance of α-Fe2O3 electrodes at different current densities (at 1, 2, 4, 6 C-rate and back to 1 C-rate for 10 cycles each continuously) are evaluated and shown in Fig. 6(d). The cell is capable of delivering a discharge capacity of 1253 and 896 mAh/g for α-Fe2O3 cocoons and rods respectively even at high current density of 6 C-rate. It is observed that α-Fe2O3 cocoons exhibit better and stable capacity retention at 6 C-rate as as compared with rods. The cells exhibit a discharge capacity of 1535 and 1263 mAh/g for α-Fe2O3 cocoons and rods respectively after the current density is changed back to 1 C-rate after 40 cycles, which clearly demonstrates a high capacity retention of ∼84 and 73% (based on its initial discharge capacity) for α-Fe2O3 cocoons and rods respectively.
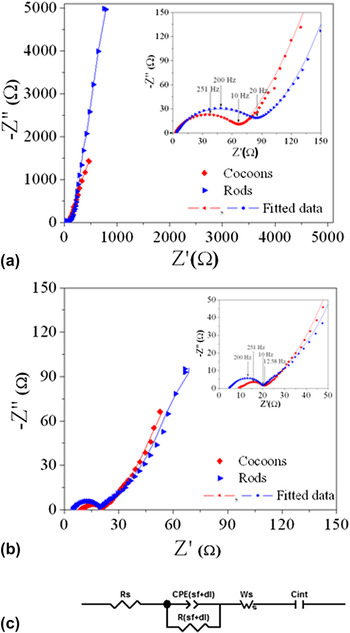
For understanding the reaction kinetics during intercalation/deintercalation process, EIS has been carried out. The Nyquist plots of Li/α-Fe2O3 symmetric cells at an open circuit potential using the fresh cells equilibrated overnight and after 100 galvanostatic charge-discharge cycles are shown in Fig. 7. Nyquist plots in Figs. 7(a) and 7(b) showed almost similar electrochemical impedance response irrespective of distinct morphological characteristics and can be generally divided into two regions: (i) one depressed semicircle in the high-to-middle frequency (100 kHz–20 Hz) region, and (ii) a sloped line in the low-frequency region. The semicircle with characteristic frequency of 251 and 200 Hz can be observed [inset of Figs. 7(a) and 7(b)] for α-Fe2O3 cocoons and rods, respectively while the magnitude of the semicircle decreases for α-Fe2O3 cocoons and rods after galvanostatic charge–discharge cycles. An equivalent circuit as shown in Fig. 7(c) is proposed to fit the impedance spectra. An intercept at the Z real axis (Z′) in high frequency corresponded to the ohmic resistance (R s), which accounts for the total resistance of the electrolyte, separator, and electrical contacts. The depressed semicircle in the high-to-medium frequency range is related to the combination of Li-ion migration resistance (R sf) through the SEI film formed on the electrode and the charge transfer resistance (R ct). The inclined line in the lower frequency represents a finite length Warburg diffusion element (W s) that includes the impedances encountered when the electrolyte ions diffuse from the bulk (α-Fe2O3 cocoons and rods particles) to the electrode–electrolyte interfaces. A double-layer capacitor [CPE (sf+dl)] is indicated for the double layers formed on the surfaces of the electrode in contact with the electrolyte. The introduction of constant phase element (CPE) in the equivalent circuit can obtain a good approach to the surface roughness, physical nonuniformity or nonuniform distribution of surface reaction site.Reference Kang, Ko, Park and Kim26
Nyquist plots of α-Fe2O3 samples: (a) fresh cells, (b) after 100 cycles and (c) equivalent circuit.

Table I displays the analysis results obtained by modeling the experimental Nyquist plots recorded for the fresh cell and the cell after 100 cycles. In particular, the R ct of the fresh α-Fe2O3 cocoons as well as rods electrode decreased after 100 cycles; whereas R s of α-Fe2O3 cocoons is increased drastically after 100 cycles. R (sf+ct) of α-Fe2O3 fresh cell is observed to be 60.25 and 72.16 Ω for cocoons and rods respectively. The result of small charge transfer resistance after cycling might be attributable to the larger contact area between α-Fe2O3 electrode and electrolyte. The R (sf+ct) values are observed to be slightly lower for α-Fe2O3 cocoons, suggesting that the resistance of Li+ migration was decreased when cycling. The corresponding CPE (sf+dl) is observed to be almost same for the fresh cells, while the value is 941 and 245 μF, respectively for cocoons and rods after 100 cycles. After cycling, the diameter of the semicircle reduces drastically followed by the well-defined Warburg region at low frequencies. This shows that R sf is reduced significantly and R ct comes in to prominence because of the initiation of the intercalation/deintercalation reaction of Li into α-Fe2O3 cocoons and rods. The EIS results are consistent with cyclic voltammetry and galvanostatic charge-discharge tests. The improved electrochemical properties of α-Fe2O3 cocoons, therefore, appeared to be due to following factors: (i) enhanced BET surface area facilitates electrode–electrolyte interface, (ii) intrapores within α-Fe2O3 cocoons, which effectively enhanced the Li+ diffusion and restrained the increase of interfacial resistance among particles during the cycles and (iii) the improved electrical conductivity of α-Fe2O3 cocoons due to small micrometer-sized particles.
Fitting parameters of the cell with α-Fe2O3 electrodes for the fresh cell equilibrated overnight and after 100 charge-discharge cycles at an open circuit potential.

IV. CONCLUSIONS
Unique α-Fe2O3 cocoons and rods were successfully prepared by surfactant-free chimie douce synthesis and tested as anode materials for LIBs. The morphology of α-Fe2O3 is dependent on the solvent used during synthesis. The initial discharge capacity is 1830 and 1741 mAh/g for cocoons and rods respectively and showed stable cycling performance. The studies showed that α-Fe2O3 cocoons exhibit better electrochemical performance as compared with rods, which reveals size effect and morphology-dependent electrochemical properties of α-Fe2O3. This synthesis technique is a viable option to be applied to synthesize other functional materials with controlled morphologies. The investigation indicates that there are good prospects for using α-Fe2O3 as anode materials in LIBs.
ACKNOWLEDGMENTS
The authors are grateful for the support by funding from the National Research Foundation, Clean Energy Research Project (Grant Number: NRF2009EWT-CERP001-036). The electron microscopy and XRD work were performed at the Facility for Analysis, Characterization, Testing and Simulation (FACTS) in Nanyang Technological University, Singapore.