





An estimated 82 million people in the United States live in counties with air quality below the national standard (US EPA, 2016). One dominant air pollutant, arising from traffic and power plant emissions, is fine particulate matter <2.5 micrometers (PM2.5); recent research has raised concerns that even short-term exposures to PM2.5 have been linked with respiratory diseases, neurodegenerative disease, and cognitive functioning impairments (Costa et al., Reference Costa, Chang and Cole2017; Lim et al., Reference Lim, Kim, Kim, Bae, Park and Hong2012; Myhre et al., Reference Myhre, Låg, Villanger, Oftedal, Øvrevik, Holme, Aase, Paulsen, Bal-Price and Dirven2018; Oudin et al., Reference Oudin, Forsberg, Adolfsson, Lind, Modig, Nordin, Nordin, Adolfsson and Nilsson2016; Power et al., Reference Power, Adar, Yanosky and Weuve2016).
PM 2.5 can reach the brain through several pathways: direct translocation from the lungs to the circulatory system, note-to brain transport, or indirectly via systemic inflammation triggering neuroinflammatory processes and hypothalamic–pituitary–adrenal (HPA) axis activation (Anderson et al., Reference Anderson, Thundiyil and Stolbach2012; Babadjouni et al., Reference Babadjouni, Patel, Liu, Shkirkova, Lamorie-Foote, Connor, Hodis, Cheng, Sioutas, Morgan, Finch and Mack2018; Bergamaschi et al., Reference Bergamaschi, Cortese, Pichiecchio, Berzolari, Borrelli, Mallucci, Bollati, Romani, Nosari, Villa and Montomoli2018; Block et al., Reference Block, Elder, Auten, Bilbo, Chen, Chen, Cory-Slechta, Costa, Diaz-Sanchez, Dorman, Gold, Gray, Jeng, Kaufman, Kleinman, Kirshner, Lawler, Miller, Nadadur, Ritz, Semmens, Tonelli, Veronesi, Wright and Wright2012; Braithwaite et al., Reference Braithwaite, Zhang, Kirkbride, Osborn and Hayes2019; Brook et al., Reference Brook, Rajagopalan, Pope, Brook, Bhatnagar, Diez-Roux, Holguin, Hong, Luepker, Mittleman, Peters, Siscovick, Smith, Whitsel and Kaufman2010; Calderón-Garcidueñas et al., Reference Calderón-Garcidueñas, Solt, Henríquez-Roldán, Torres-Jardón, Nuse, Herritt, Villarreal-Calderón, Osnaya, Stone, García, Brooks, González-Maciel, Reynoso-Robles, Delgado-Chávez and Reed2008; Genc et al., Reference Genc, Zadeoglulari, Fuss and Genc2012; Thomson, Reference Thomson2019; Woodward et al., Reference Woodward, Levine, Haghani, Shirmohammadi, Saffari, Sioutas, Morgan and Finch2017). Notably, young children and adolescents may be more vulnerable to PM2.5 compared to adults, due to higher inhalation rates and premature lungs (Vanos, Reference Vanos2015). Additionally, adolescence is a critical time of brain development, marked by accelerated white matter (WM) maturation, characterized by microstructural tissue changes including increased myelination and axonal packing (Asato et al., Reference Asato, Terwilliger, Woo and Luna2010; Barnea-Goraly et al., Reference Barnea-Goraly, Menon, Eckert, Tamm, Bammer, Karchemskiy, Dant and Reiss2005). In particular, maturation of fronto-limbic WM enhances structural organization and top-down executive functioning (Asato et al., Reference Asato, Terwilliger, Woo and Luna2010; Simmonds et al., Reference Simmonds, Hallquist, Asato and Luna2014), including in tracts such as the fornix (Goddings et al., Reference Goddings, Roalf, Lebel and Tamnes2021), superior longitudinal fasciculus (SLF) (Østby et al., Reference Østby, Tamnes, Fjell and Walhovd2011; Vestergaard et al., Reference Vestergaard, Madsen, Baaré, Skimminge, Ejersbo, Ramsøy, Gerlach, Akeson, Paulson and Jernigan2011), uncinate fasciculus (UNC) (Krogsrud et al., Reference Krogsrud, Fjell, Tamnes, Grydeland, Due-Tønnessen, Bjørnerud, Sampaio-Baptista, Andersson, Johansen-Berg and Walhovd2018), and anterior thalamic radiation (ATR) (Olson et al., Reference Olson, Collins, Hooper, Muetzel, Lim and Luciana2009). Myelination promotes axonal insulation and organization, supporting directional water diffusion along axons, reflected by higher fractional anisotropy (FA) and lower mean diffusivity (MD), indicators of greater WM integrity (Casey et al., Reference Casey, Cannonier, Conley, Cohen, Barch, Heitzeg, Soules, Teslovich, Dellarco, Garavan, Orr, Wager, Banich, Speer, Sutherland, Riedel, Dick, Bjork, Thomas, Chaarani, Mejia, Hagler, Daniela Cornejo, Sicat, Harms, Dosenbach, Rosenberg, Earl, Bartsch, Watts, Polimeni, Kuperman, Fair and Dale2018; Olson et al., Reference Olson, Collins, Hooper, Muetzel, Lim and Luciana2009). Oxidative stress, including that caused by PM2.5 exposure, may disrupt normal myelination and compromise WM integrity, especially during neurodevelopment (Nasrabady et al., Reference Nasrabady, Rizvi, Goldman and Brickman2018). Thus, children transitioning to adolescence may be particularly susceptible to PM 2.5 exposure, with potential effects on the timing and trajectory of fronto-limbic WM development rather than uniform disruption.
Animal evidence supports links between PM2.5 and disrupted WM development, including olfactory bulb and frontal WM lesions in young male and female dogs (Calderón-Garcidueñas et al., Reference Calderón-Garcidueñas, Solt, Henríquez-Roldán, Torres-Jardón, Nuse, Herritt, Villarreal-Calderón, Osnaya, Stone, García, Brooks, González-Maciel, Reynoso-Robles, Delgado-Chávez and Reed2008) and altered WM tracts. Specifically, it has been linked with decreased FA in the optic tract, anterior commissure, corpus callosum, and fimbria and increased MD in the optic tract in mice (Chen et al., Reference Chen, Tang, Fan, Qiao, Wang, Wen, Wang, Wang, Yang and Sheng2022). Human neuroimaging studies, while limited, suggest similar associations; in one small study in children (ages 7–8 years) living in highly polluted regions of Mexico, PM2.5 exposure was associated with reduced WM volume in temporal and parietal regions and higher levels of systemic inflammation compared to individuals living in cities with lower emission sources (Calderón-Garcidueñas et al., Reference Calderón-Garcidueñas, Solt, Henríquez-Roldán, Torres-Jardón, Nuse, Herritt, Villarreal-Calderón, Osnaya, Stone, García, Brooks, González-Maciel, Reynoso-Robles, Delgado-Chávez and Reed2008). More recently, a cross-sectional analysis using Adolscent Brain Cognitive Development (ABCD) Study data found associations between increased PM2.5 and altered WM tracts among children aged 9-10, including decreased MD and increased isotropic diffusion in fronto-limbic and frontoparietal WM tracts (SLF, UNC, and fornix) (Burnor et al., Reference Burnor, Cserbik, Cotter, Palmer, Ahmadi, Eckel, Berhane, McConnell, Chen, Schwartz, Jackson and Herting2021). While decreased MD is often interpreted as greater WM organization, in the context of environmental exposures such as PM2.5, these patterns may reflect atypical or accelerated maturation processes that differ across developmental stages. Importantly, this prior work was limited to a single developmental time point and did not account for other social and environmental drivers of health (e.g., green space, population density, and poverty level) that potentially covary with air pollution.
Alterations in WM integrity may also lead to downstream cognitive funtion. Human studies have linked prenatal and postnatal PM2.5 to detrimental effects on downstream cognition (executive functioning) in childhood (ages 6-10) (Brook et al., Reference Brook, Rajagopalan, Pope, Brook, Bhatnagar, Diez-Roux, Holguin, Hong, Luepker, Mittleman, Peters, Siscovick, Smith, Whitsel and Kaufman2010; Evans & Jacobs, Reference Evans and Jacobs1981; Guxens et al., Reference Guxens, Lubczyńska, Muetzel, Dalmau-Bueno, Jaddoe, Hoek, van der Lugt, Verhulst, White, Brunekreef, Tiemeier and El Marroun2018; Kioumourtzoglou et al., Reference Kioumourtzoglou, Schwartz, Weisskopf, Melly, Wang, Dominici and Zanobetti2016; Peterson et al., Reference Peterson, Rauh, Bansal, Hao, Toth, Nati, Walsh, Miller, Arias, Semanek and Perera2015) with some studies have additionally reported PM2.5-related WM abnormalities that co-occur with cognitive deficits (Calderón-Garcidueñas et al., Reference Calderón-Garcidueñas, Engle, Mora-Tiscareño, Styner, Gómez-Garza, Zhu, Jewells, Torres-Jardón, Romero, Monroy-Acosta, Bryant, González-González, Medina-Cortina and D’Angiulli2011; Evans & Jacobs, Reference Evans and Jacobs1981). To date, there are no large-scale, nationally representative, longitudinal studies examining the impact of PM2.5 on fronto-limbic WM integrity and cognition in children as they age into mid-adolescence, controlling for potentially confounding factors such as household socioeconomic status and social determinants of health.
Several studies have identified notable sex-related differences of vulnerability to PM2.5 exposure, particularly during adolescence. Biological factors such as sex differences in lung maturation (Laube & Thome, Reference Laube and Thome2022) and neuroendocrine development (Ide et al., Reference Ide, Tsutsui, Ohashi, Hayashidani, Suematsu, Tsuchihashi, Tamai and Takeshita2002; Niveditha et al., Reference Niveditha, Deepashree, Ramesh and Shivanandappa2017) may contribute to differential susceptibility to air pollution during this developmental window, motivating examination of sex as a potential moderator. For example, females generally exhibit earlier lung maturation, partly driven by estrogen-related acceleration, while sex hormomes also influence neuroendocrine and inflammatory processes that shape responses to environmental exposures (Ide et al., Reference Ide, Tsutsui, Ohashi, Hayashidani, Suematsu, Tsuchihashi, Tamai and Takeshita2002; Laube & Thome, Reference Laube and Thome2022; Niveditha et al., Reference Niveditha, Deepashree, Ramesh and Shivanandappa2017). Given the sex-specific developmental trajectories of WM development (De Bellis et al., Reference De Bellis, Keshavan, Beers, Hall, Frustaci, Masalehdan, Noll and Boring2001; Lenroot et al., Reference Lenroot, Gogtay, Greenstein, Wells, Wallace, Clasen, Blumenthal, Lerch, Zijdenbos, Evans, Thompson and Giedd2007), examining longitudinal sex differences in associations between PM2.5, brain development, and cognition is warranted.
Finally, parallel to neurodevelopmental changes, adolescence is characterized by heightened vulnerability to risk-taking behaviors, including substance use (SU) (Casey et al., Reference Casey, Cannonier, Conley, Cohen, Barch, Heitzeg, Soules, Teslovich, Dellarco, Garavan, Orr, Wager, Banich, Speer, Sutherland, Riedel, Dick, Bjork, Thomas, Chaarani, Mejia, Hagler, Daniela Cornejo, Sicat, Harms, Dosenbach, Rosenberg, Earl, Bartsch, Watts, Polimeni, Kuperman, Fair and Dale2018). Although human studies eamining links between air pollution and SU are limited, emerging evidence suggests associations between PM2.5 and SU-related emergency department visits (Kim et al., Reference Kim, Shin, Song, Ro, Kong, Kim, Ko and Lee2019; Pignon et al., Reference Pignon, Borel, Lajnef, Richard, Szöke, Hemery, Leboyer, Foret and Schürhoff2022). Thus, an exploratory goal of this study is to investigate whether PM2.5 exposure is associated with early adolescent novel SU initiation.
The present study aimed to characterize the independent longitudinal associations between baseline exposure to PM2.5 and fronto-limbic WM integrity, cognition, and SU initiation from late childhood to early adolescence (9–15 years old). We leveraged data from the ABCD Study, a large prospective, multi-site cohort in the United States with rich characterization of neighborhood-level social and environmental factors, including neighborhood-level income, education, exposure to environmental toxins, and US Census-level measures of neighborhood resources (e.g., green space). Given the dynamic nature of WM and cognitive development during this period, we examined whether the associations between PM2.5 and WM integrity and cognition varied as a function of age and sex. We hypothesized that higher baseline average exposure levels of PM2.5 (ages 9–11) would be associated with lower FA and higher MD at each time point (ages 9–11, 11–13, 13–15), demonstrating that the association between increased air pollution and WM integrity differs across late childhood and early adolescence. We also hypothesized more robust findings between baseline PM2.5 and reduced WM integrity (FA: reduced; MD: increased) in males compared to females. We also hypothesized that increased PM2.5 exposure would be linked with lower performance on inhibitory control, processing speed, and working memory; with associations that may differ by age at assessment, especially in males. All models controlled for time-variant covariates including household income, parent education, perceived safety, and time-invariant covariates including sex assigned at birth, neighborhood crime rate, green space, and median household income. Finally, we explored whether PM2.5 exposure was independently associated with novel SU initiation between the two-year and four-year time points (ages 9–11, 11–13, and 13–15). We hypothesized that increased exposure to PM2.5 would be linked with higher odds of new SU onset during pre- and early adolescence, especially in males. Specifically, we hypothesized that the association between PM2.5 exposure and SU risk would differ by age and sex. The results from this proposed study will help better describe independent associations between PM2.5 and WM development, cognition, and SU and may create avenues for targeted interventions and public health policies which may intervene with SU in adolescents.
Method
Participants
Data was collected from the Adolescent Brain Cognitive Development Study (ABCD; Data Release 5.1), a diverse, national, prospective, longitudinal cohort that recruited 11,878 youth and their caregivers (youth = 9–10 years old; female at birth = 48%; male at birth = 52%; White = 52.1%; Black = 15%; Hispanic/Latino/x = 20.3%; Asian = 2.1%; Other [e.g., biracial] = 10.5%) at baseline between 2016-2018 (Barch et al., Reference Barch, Albaugh, Avenevoli, Chang, Clark, Glantz, Hudziak, Jernigan, Tapert, Yurgelun-Todd, Alia-Klein, Potter, Paulus, Prouty, Zucker and Sher2017; Jernigan et al., Reference Jernigan, Brown and Dowling2018; Volkow et al., Reference Volkow, Koob, Croyle, Bianchi, Gordon, Koroshetz, Pérez-Stable, Riley, Bloch, Conway, Deeds, Dowling, Grant, Howlett, Matochik, Morgan, Murray, Noronha, Spong, Wargo, Warren and Weiss2018). All protocols were approved by the centralized University of California, San Diego (UCSD) institutional review board and informed consent/assent was obtained from caregivers and youth. See Garavan et al. (Reference Garavan, Bartsch, Conway, Decastro, Goldstein, Heeringa, Jernigan, Potter, Thompson and Zahs2018) for more details on recruitment methods and inclusion/exclusionary criteria at baseline (Garavan et al., Reference Garavan, Bartsch, Conway, Decastro, Goldstein, Heeringa, Jernigan, Potter, Thompson and Zahs2018).
Procedures
At baseline and every other annual follow-up, youth and at least one caregiver completed a comprehensive battery of behavioral and biological assessment including mental and physical health (Barch et al., Reference Barch, Albaugh, Avenevoli, Chang, Clark, Glantz, Hudziak, Jernigan, Tapert, Yurgelun-Todd, Alia-Klein, Potter, Paulus, Prouty, Zucker and Sher2017), SU (Lisdahl et al., Reference Lisdahl, Sher, Conway, Gonzalez, Feldstein Ewing, Nixon, Tapert, Bartsch, Goldstein and Heitzeg2018), peer, family, culture, and environment (Zucker et al., Reference Zucker, Gonzalez, Feldstein Ewing, Paulus, Arroyo, Fuligni, Morris, Sanchez and Wills2018), biological functioning (Uban et al., Reference Uban, Horton, Jacobus, Heyser, Thompson, Tapert, Madden, Sowell and Study2018), genetics (Iacono et al., Reference Iacono, Heath, Hewitt, Neale, Banich, Luciana, Madden, Barch and Bjork2018), and neuropsychological and magnetic resonance imaging brain scans (Casey et al., Reference Casey, Cannonier, Conley, Cohen, Barch, Heitzeg, Soules, Teslovich, Dellarco, Garavan, Orr, Wager, Banich, Speer, Sutherland, Riedel, Dick, Bjork, Thomas, Chaarani, Mejia, Hagler, Daniela Cornejo, Sicat, Harms, Dosenbach, Rosenberg, Earl, Bartsch, Watts, Polimeni, Kuperman, Fair and Dale2018; Luciana et al., Reference Luciana, Bjork, Nagel, Barch, Gonzalez, Nixon and Banich2018). The current study utilized data from baseline to the four-year follow-up and included demographic, cognitive, neuroimaging, residential history, and SU modules (Barch et al., Reference Barch, Albaugh, Avenevoli, Chang, Clark, Glantz, Hudziak, Jernigan, Tapert, Yurgelun-Todd, Alia-Klein, Potter, Paulus, Prouty, Zucker and Sher2017; Fan et al., Reference Fan, Marshall, Smolker, Gonzalez, Tapert, Barch, Sowell, Dowling, Cardenas-Iniguez, Ross, Thompson and Herting2021; Lisdahl et al., Reference Lisdahl, Sher, Conway, Gonzalez, Feldstein Ewing, Nixon, Tapert, Bartsch, Goldstein and Heitzeg2018).
Demographics
Surveys consisted of items which assessed self-reported information including age, sex assigned at birth, and race and ethnicity of both child and parent or guardian and their partner. Baseline sex assigned at birth was used as time-invariant covariates. Age was reported in months at the time of baseline, two-year follow-up, and four-year follow-ups. For the linear mixed-effects models, age was converted to years and mean-centered to improve interpretability of model intercepts and lower-order terms in the presence of interaction effects. SES was assessed via parental education and household income at baseline, two-year follow-up, and four-year follow-up. Parental education was measured by self-reported highest level of educational attainment of both parents and categorized as: (1) <HS Diploma, (2) HS Diploma/GED, (3) Some College, (4) Bachelor, and (5) Post Graduate Degree. Household income was measured by asking the parent, “What is your total combined family income for the past 12 months? This should include income (before taxes and deductions) from all sources, wages, rent from properties, social security, disability and veteran’s benefits, unemployment benefits, workman.” Responses included 1 = Less than USD 50,000; 2 = USD 50,000–100,000; 3 = USD 100,000+.
Fine particulate matter exposure (PM2.5)
PM2.5 was extracted from the Environmental Protection Agency (EPA) Air Quality System (AQS) network. PM2.5 estimates were modeled by Di et al.’s (Reference Di, Amini, Shi, Kloog, Silvern, Kelly, Sabath, Choirat, Koutrakis, Lyapustin, Wang, Mickley and Schwartz2019) spatio-temporal ensemble model that uses inputs of satellite imagery, land-use predictors, and chemical transport integrated with machine learning algorithms, outputting 2016 annual-average PM2.5 concentrations at a 1 km2 grid resolution (Di et al., Reference Di, Amini, Shi, Kloog, Silvern, Kelly, Sabath, Choirat, Koutrakis, Lyapustin, Wang, Mickley and Schwartz2019; Fan et al., Reference Fan, Marshall, Smolker, Gonzalez, Tapert, Barch, Sowell, Dowling, Cardenas-Iniguez, Ross, Thompson and Herting2021). Once the PM2.5 estimates were extracted, they were linked to a participant’s self-reported residential address at the baseline visit, completed by the ABCD Linked External Data (LED) working group (Fan et al., Reference Fan, Marshall, Smolker, Gonzalez, Tapert, Barch, Sowell, Dowling, Cardenas-Iniguez, Ross, Thompson and Herting2021).
Neighborhood-related variables
The ABCD Study provides scores from linked external datasets, including the Area Deprivation Index (ADI) (Kind et al., Reference Kind, Jencks, Brock, Yu, Bartels, Ehlenbach, Greenberg and Smith2014), the Uniform Crime Reporting Data, and the Child Opportunity Index (COI 2.0) (Uniform Crime Reporting Program Data, 2014). We selected green space (% of impenetrable surface areas multiplied by –1) from the Child Opportunity Index 2.0 (COI 2.), an index of 29 economic, education, and health/environment variables. Median household income for each census block was derived from the American Community Survey as part of the ADI, a composite measure of 17 neighborhood deprivation variables at the level of census block group. County level crime (derived from the Uniform Crime Reporting Data) detailing counts of arrests and offenses within the respective county. These variables (i.e., green space, median household income, crime reports, etc.) have been consistently linked to both air pollution exposure and cognitive outcomes, allowing us to adjust for key neighborhood confounders while minimizing collinearity among the broader set of neighborhood variables available in the ABCD Study.
Diffusion tensor imaging (DTI)
Baseline, two-year follow-up, and four-year follow-up imaging were used in the models. Each child was placed in an MRI scanner (T1- and T2-weighted) and was shown an age-appropriate movie. All neuroimaging data were processed and quality controlled by the ABCD Data Analysis and Informatics Resource Core using standardized pipelines, and detailed documentation of image acquisition, preprocessing, and quality control procedures is provided elsewhere (Hagler et al., Reference Hagler, Hatton, Cornejo, Makowski, Fair, Dick, Sutherland, Casey, Barch, Harms, Watts, Bjork, Garavan, Hilmer, Pung, Sicat, Kuperman, Bartsch, Xue, Heitzeg, Laird, Trinh, Gonzalez, Tapert, Riedel, Squeglia, Hyde, Rosenberg, Earl, Howlett, Baker, Soules, Diaz, de Leon, Thompson, Neale, Herting, Sowell, Alvarez, Hawes, Sanchez, Bodurka, Breslin, Morris, Paulus, Simmons, Polimeni, van der Kouwe, Nencka, Gray, Pierpaoli, Matochik, Noronha, Aklin, Conway, Glantz, Hoffman, Little, Lopez, Pariyadath, Weiss, Wolff-Hughes, DelCarmen-Wiggins, Feldstein Ewing, Miranda-Dominguez, Nagel, Perrone, Sturgeon, Goldstone, Pfefferbaum, Pohl, Prouty, Uban, Bookheimer, Dapretto, Galvan, Bagot, Giedd, Infante, Jacobus, Patrick, Shilling, Desikan, Li, Sugrue, Banich, Friedman, Hewitt, Hopfer, Sakai, Tanabe, Cottler, Nixon, Chang, Cloak, Ernst, Reeves, Dale and A.2019). WM was calculated by combining tissue samples and weighted averages based on the proportion of WM in each voxel (Elman et al., Reference Elman, Panizzon, Hagler, Fennema-Notestine, Eyler, Gillespie, Neale, Lyons, Franz, McEvoy, Dale and Kremen2017) and was then calculated using tractography (Hagler et al., Reference Hagler, Ahmadi, Kuperman, Holland, McDonald, Halgren and Dale2009, Reference Hagler, Hatton, Cornejo, Makowski, Fair, Dick, Sutherland, Casey, Barch, Harms, Watts, Bjork, Garavan, Hilmer, Pung, Sicat, Kuperman, Bartsch, Xue, Heitzeg, Laird, Trinh, Gonzalez, Tapert, Riedel, Squeglia, Hyde, Rosenberg, Earl, Howlett, Baker, Soules, Diaz, de Leon, Thompson, Neale, Herting, Sowell, Alvarez, Hawes, Sanchez, Bodurka, Breslin, Morris, Paulus, Simmons, Polimeni, van der Kouwe, Nencka, Gray, Pierpaoli, Matochik, Noronha, Aklin, Conway, Glantz, Hoffman, Little, Lopez, Pariyadath, Weiss, Wolff-Hughes, DelCarmen-Wiggins, Feldstein Ewing, Miranda-Dominguez, Nagel, Perrone, Sturgeon, Goldstone, Pfefferbaum, Pohl, Prouty, Uban, Bookheimer, Dapretto, Galvan, Bagot, Giedd, Infante, Jacobus, Patrick, Shilling, Desikan, Li, Sugrue, Banich, Friedman, Hewitt, Hopfer, Sakai, Tanabe, Cottler, Nixon, Chang, Cloak, Ernst, Reeves, Dale and A.2019). From this data, average FA was computed to assess directionality estimates of water diffusion in order to make inferences about WM tissue characteristics (e.g., myelination and fiber density). Average MD values were extracted from predefined brain regions of interest to assess the average rate of water diffusion in order to make inferences about WM microstructural integrity (Hagler et al., Reference Hagler, Ahmadi, Kuperman, Holland, McDonald, Halgren and Dale2009, Reference Hagler, Hatton, Cornejo, Makowski, Fair, Dick, Sutherland, Casey, Barch, Harms, Watts, Bjork, Garavan, Hilmer, Pung, Sicat, Kuperman, Bartsch, Xue, Heitzeg, Laird, Trinh, Gonzalez, Tapert, Riedel, Squeglia, Hyde, Rosenberg, Earl, Howlett, Baker, Soules, Diaz, de Leon, Thompson, Neale, Herting, Sowell, Alvarez, Hawes, Sanchez, Bodurka, Breslin, Morris, Paulus, Simmons, Polimeni, van der Kouwe, Nencka, Gray, Pierpaoli, Matochik, Noronha, Aklin, Conway, Glantz, Hoffman, Little, Lopez, Pariyadath, Weiss, Wolff-Hughes, DelCarmen-Wiggins, Feldstein Ewing, Miranda-Dominguez, Nagel, Perrone, Sturgeon, Goldstone, Pfefferbaum, Pohl, Prouty, Uban, Bookheimer, Dapretto, Galvan, Bagot, Giedd, Infante, Jacobus, Patrick, Shilling, Desikan, Li, Sugrue, Banich, Friedman, Hewitt, Hopfer, Sakai, Tanabe, Cottler, Nixon, Chang, Cloak, Ernst, Reeves, Dale and A.2019). The regions selected for this project were selected a priori based on previous research of the ongoing development of bilateral fronto-limbic regions (Casey et al., Reference Casey, Cannonier, Conley, Cohen, Barch, Heitzeg, Soules, Teslovich, Dellarco, Garavan, Orr, Wager, Banich, Speer, Sutherland, Riedel, Dick, Bjork, Thomas, Chaarani, Mejia, Hagler, Daniela Cornejo, Sicat, Harms, Dosenbach, Rosenberg, Earl, Bartsch, Watts, Polimeni, Kuperman, Fair and Dale2018) including the following: (1) the fornix; (2) SLF, (3) ATR; and (4) UNC (Hagler et al., Reference Hagler, Ahmadi, Kuperman, Holland, McDonald, Halgren and Dale2009, Reference Hagler, Hatton, Cornejo, Makowski, Fair, Dick, Sutherland, Casey, Barch, Harms, Watts, Bjork, Garavan, Hilmer, Pung, Sicat, Kuperman, Bartsch, Xue, Heitzeg, Laird, Trinh, Gonzalez, Tapert, Riedel, Squeglia, Hyde, Rosenberg, Earl, Howlett, Baker, Soules, Diaz, de Leon, Thompson, Neale, Herting, Sowell, Alvarez, Hawes, Sanchez, Bodurka, Breslin, Morris, Paulus, Simmons, Polimeni, van der Kouwe, Nencka, Gray, Pierpaoli, Matochik, Noronha, Aklin, Conway, Glantz, Hoffman, Little, Lopez, Pariyadath, Weiss, Wolff-Hughes, DelCarmen-Wiggins, Feldstein Ewing, Miranda-Dominguez, Nagel, Perrone, Sturgeon, Goldstone, Pfefferbaum, Pohl, Prouty, Uban, Bookheimer, Dapretto, Galvan, Bagot, Giedd, Infante, Jacobus, Patrick, Shilling, Desikan, Li, Sugrue, Banich, Friedman, Hewitt, Hopfer, Sakai, Tanabe, Cottler, Nixon, Chang, Cloak, Ernst, Reeves, Dale and A.2019). We took the averages for both left and right ROIs.
NIH toolbox cognitive battery
Baseline, two-year follow-up, and four-year follow-up cognitive performance were used. The NIH Toolbox is a neurocognitive battery that spans across 7 domains of cognition encompassing working and episodic memory, inhibitory control, attention, processing speed, vocabulary, and language and was developed to accommodate to the needs of longitudinal studies as it has optimal administration times and good psychometric properties (Bleck et al., Reference Bleck, Nowinski, Gershon and Koroshetz2013). The battery was administered through an iPad and took about 35 minutes to complete. Each youth were administered the List Sorting Working Memory Test, Flanker Attention Test, Dimensional Card Sorting Task, Picture Vocabulary Test, Oral Reading Recognition Test, Picture Sequence Memory Test, and Pattern Comparison Processing Speed Test. The NIH Toolbox Cognitive Battery includes composite scores for each subtest in addition to a total score composite, a crystallized intelligence composite, and a fluid intelligence composite. Due to missing data related to COVID-19 pandemic at the two-year and incomplete data at the four-year, we were unable to complete analyses on Dimensional Card Sorting Task (N at baseline = 4,581; N at two-year = 16, and N at four-year = 112), List Sorting Working Memory Test (N at baseline = 4,569; N at two-year = 22, and N at four-year = 4,428), and Fluid Intelligence composite scores (N at baseline = 4,557; N at two-year = 19, and N at four-year = 84), since the Dimensional Card Sorting Task and List Sorting Working Memory Task scores are included in this composite.
SU initiation
At each annual follow-up (baseline, one year, two years, etc.), youth were asked if they had used each major drug category, and follow-up questions were administered if they had used any drug (see reference Lisdahl et al., Reference Lisdahl, Sher, Conway, Gonzalez, Feldstein Ewing, Nixon, Tapert, Bartsch, Goldstein and Heitzeg2018 for more details). If endorsed, they were administered the Timeline Follow Back Interview (TLFB [Sobell et al., Reference Sobell, Brown, Leo and Sobell1996]). Each annual follow-up, the TLFB was used to cover time since the last assessment. For this study, we used novel SU initiation that occurred between the two-year and four-year follow-up. We quantified early SU onset into a dichotomous variable: any SU initiation (after 2YR) (e.g., any alcohol use including sipping outside of a religious setting, any nicotine/tobacco, cannabis, cocaine, bath salts, methamphetamine, prescription stimulants, MDMA, ketamine, GHB, heroin/opium, hallucinogens, steroids, non-medical use of amphetamines, tranquilizers, and opioids, and other drug use) that occurred at the mid-year follow-up after two-year visit, three-year visit, mid-year follow-up after three-year visit, and four-year visit. Variables were created using the coding logic from previous studies (Sullivan et al., Reference Sullivan, Wade, Wallace, Tapert, Pelham, Brown, Cloak, Feldstein Ewing, Madden, Martz, Ross, Kaiver, Wirtz, Heitzeg and Lisdahl2022), and individuals who had prior initiation of substances before the two-year visit (since baseline) were excluded from the analysis to focus on novel SU initiation and to establish a clearer temporal relationship with baseline air pollution.
Data analysis
We performed all analyses in R and used Benjamini–Hochberg false discovery rate correction to account for multiple testing (Benjamini & Hochberg, Reference Benjamini and Hochberg1995). To test whether higher exposure to PM2.5 at baseline was associated with fronto-limbic WM from baseline-4YR follow-up, we performed repeated-measures general linear mixed effects (LMEs) models for each outcome (four a priori selected WM tracts: fornix, SLF, ATR, and UNC for both MD and FA outcomes, a total of eight models). In each LME model, we nested participants among MRI manufacturer, subject ID, and family membership. Site was not included as a covariate because scanner-related variability in ABCD is more directly captured by MRI manufacturer, which has been shown in previous studies to account for site-related variance in diffusion measures (Fortin et al., Reference Fortin, Parker, Tunç, Watanabe, Elliott, Ruparel, Roalf, Satterthwaite, Gur, Gur, Schultz, Verma and Shinohara2017). All models controlled for time-variant covariates including age at outcome assessment (as a continuous term), household income (as a categorical term), and parent education (as a categorical term), and time-invariant covariates including sex assigned at birth, census level crime rate (log transformed as a continuous term), neighborhood green space (log transformed as a continuous term), neighborhood perceived safety (as a continuous term), and neighborhood median household income (log transformed as a continuous term). To evaluate whether the impact of baseline PM2.5 on WM differed as youth age into adolescence, we tested the interaction between PM2.5 × age. When an interaction was significant, we used the emtrends function from the emmeans package to estimate the simple slopes of PM2.5 at mean ages of each time point (baseline = 9.96, 2YR follow-up = 12.00, and 4YR follow-up: 14.10 years), derived from the observed age distribution across sessions. We also examined sex differences by testing the interactions PM2.5 × sex assigned at birth and PM2.5 × age × sex assigned at birth.
We used an equivalent modeling approach to test the impact of PM2.5 and PM2.5 × age on cognition, performing six separate models for the selected cognitive task outcomes: Flanker Attention Test, Picture Vocabulary Test, Oral Reading Recognition Test, Picture Sequence Memory Test, Pattern Comparison Processing Speed Test, and Crystallized Composite. These models adjusted for the same covariates from above and held family ID, subject ID, and site, rather than MRI manufacturer as random effects. When an interaction was significant, we used the emtrends function from the emmeans package to estimate the simple slopes of PM2.5 at mean ages of each time point (9.96, 12, and 14.10 years), derived from the observed age distribution across sessions. To examine sex differences, we ran equivalent models to test the impact of PM2.5 × sex and PM2.5 × age × sex on cognitive performance. These models adjusted for the same covariates from above and held family ID, subject ID, and site as random effects.
For the final exploratory aim, we evaluated the association of PM2.5 at baseline with self-report of novel SU initiation after the two-year visit (n = 330 reporting initiation) using logistic regression models. We considered a random effect model to account for family clustering, but due to convergence problems and negligible random effect variance, we ran a standard logistic regression. This model adjusted for the same covariates as prior models and similarly tested cross-products between PM2.5 × age, PM2.5 × sex assigned at birth, and PM2.5 × age × sex assigned at birth.
Results
Descriptives
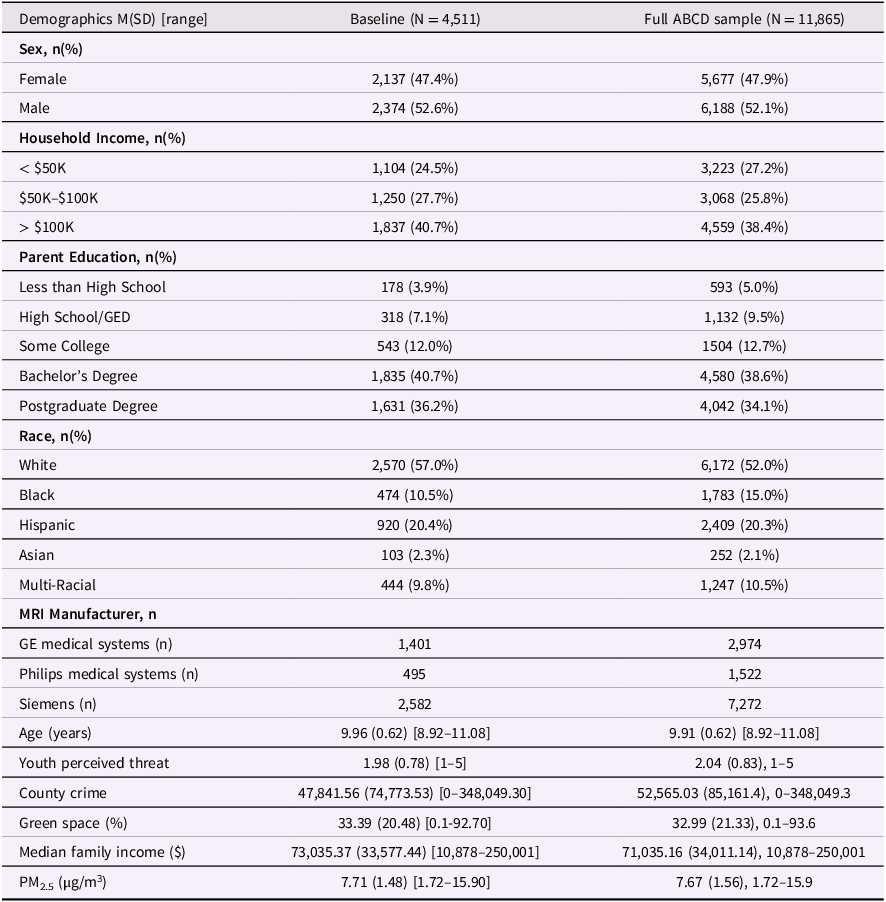
At baseline, our primary analysis sample (N = 4,511) was 47.4% female, with a mean age of 9.96 years (SD = 0.62) and diverse racial/ethnic composition (57.0% White, 10.5% Black, 20.4% Hispanic, 2.3% Asian, 9.8% multiracial). Household income and parent education levels were broadly distributed, with 24.5% of families reporting income < $50K and 36.2% of parents holding postgraduate degrees. For descriptive information on participants and variables included in models, see Tables 1 and 2. Correlations are presented in the Supplementary Table S1. Descriptive statistics by median split of PM2.5 are presented in Supplementary Tables S2–S4.
Baseline demographics and covariates of primary analysis sample and full ABCD sample at baseline

Table 1. Long description
The table compares demographics and covariates of a baseline sample (N = 4,511) and the full ABCD sample (N = 11,865). It includes data on sex, household income, parent education, race, MRI manufacturer, age, youth perceived threat, county crime, green space, median family income, and PM2.5 levels. The table has 12 rows and 7 columns. Column headers are Demographics M(SD) [range], Baseline (N = 4,511), and Full ABCD sample (N = 11,865). Row labels include categories such as Sex, Household Income, Parent Education, Race, MRI Manufacturer, Age, Youth perceived threat, County crime, Green space, Median family income, and PM2.5. Each row provides specific data points for the baseline sample and the full ABCD sample. For example, the sex distribution in the baseline sample is 47.4% female and 52.6% male, while in the full ABCD sample, it is 47.9% female and 52.1% male. The table also includes detailed data on household income, parent education levels, racial composition, MRI manufacturers, age, youth perceived threat, county crime rates, green space percentages, median family income, and PM2.5 levels.
Note. Values are presented as counts with percentages in parentheses, calculated based on the total sample (N = 4,511).
Cognitive and brain outcomes
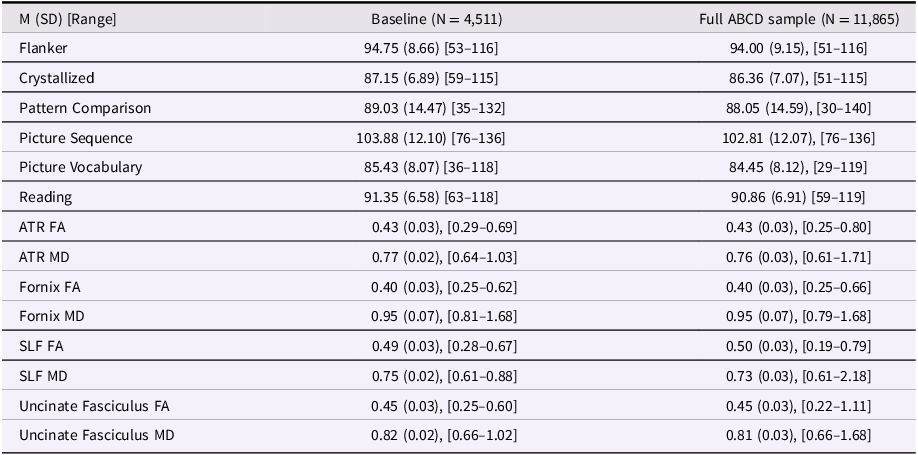
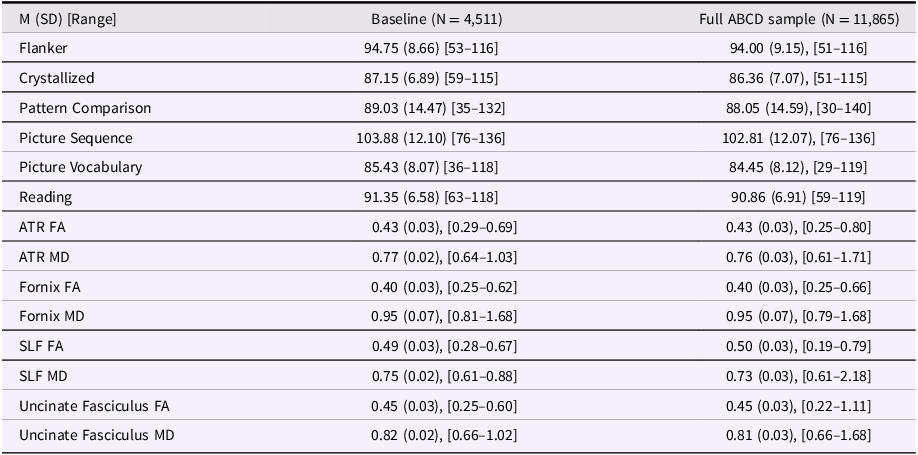
Table 2. Long description
The table presents a comparison of cognitive and brain outcomes between a baseline sample of 4,511 participants and a full ABCD sample of 11,865 participants. The table has 15 rows and 4 columns. The columns are labeled ‘M (SD) [Range]’, ‘Baseline (N = 4,511)’, and ‘Full ABCD sample (N = 11,865)’. The rows are labeled with different cognitive and brain metrics. Each row provides the mean (M), standard deviation (SD), and range for each metric in both samples. The metrics include Flanker, Crystallized, Pattern Comparison, Picture Sequence, Picture Vocabulary, Reading, ATR FA, ATR MD, Fornix FA, Fornix MD, SLF FA, SLF MD, Uncinate Fasciculus FA, and Uncinate Fasciculus MD. The table shows the values for each metric in both samples, allowing for a comparison of the cognitive and brain outcomes between the baseline and full ABCD samples.
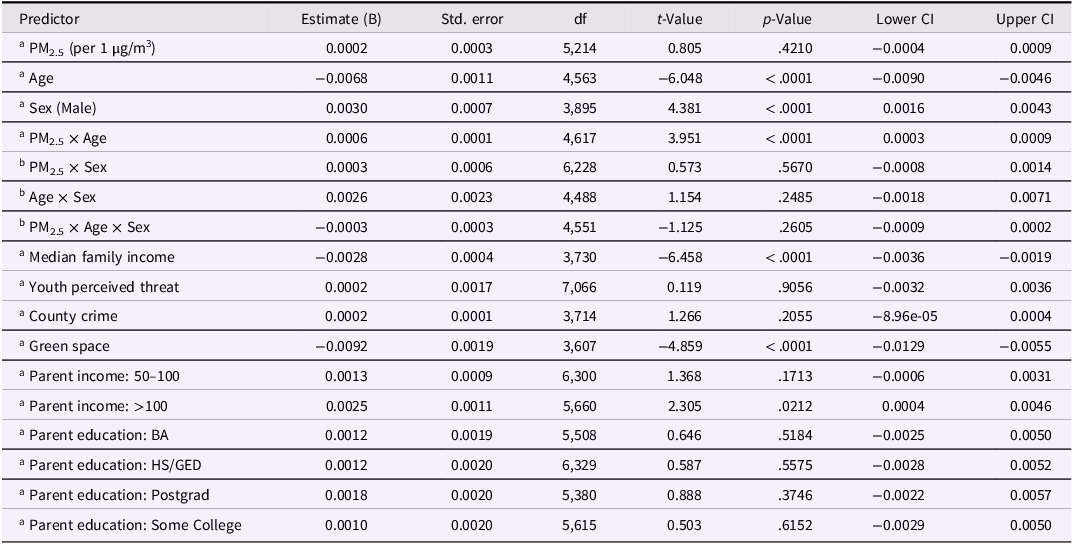
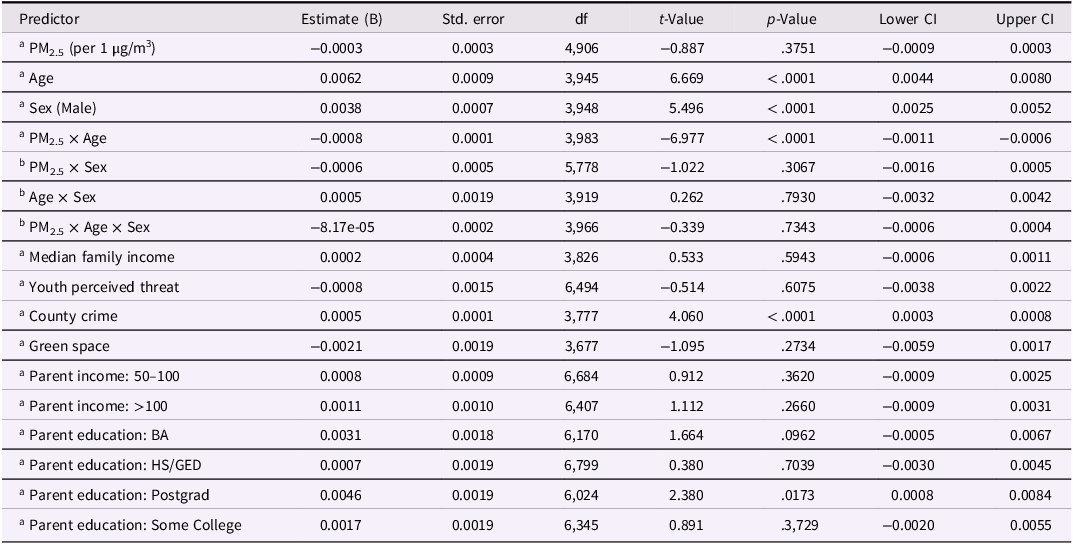
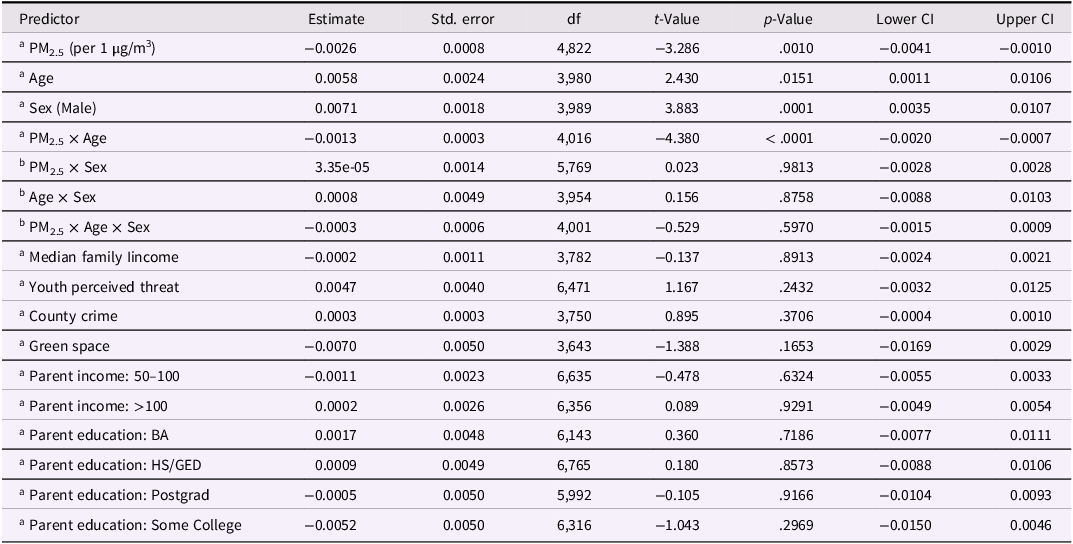
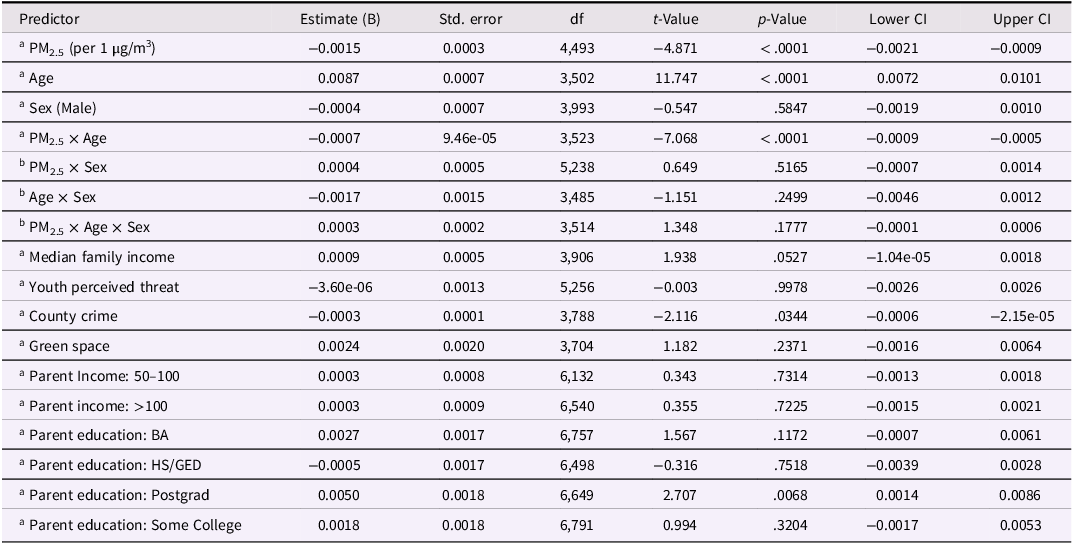
Note: FDR-corrected p-values are reported via the Benjamini–Hochberg method (alpha thresholded at p = 0.05). Models controlled for parent income, parent education, median family income, neighborhood threat, county level crime, green space, and held subject ID, family ID, and MRI manufacturer as random effects. Age was mean-centered prior to analysis. aAll estimates come from a model that includes a 2-way interaction PM2.5 x Age interaction term. bAll estimates come from a model that includes a 3-way interaction PM2.5 x Sex × Age and the lower-order 2-way interaction terms.
Anterior thalamic radiation (ATR)
-
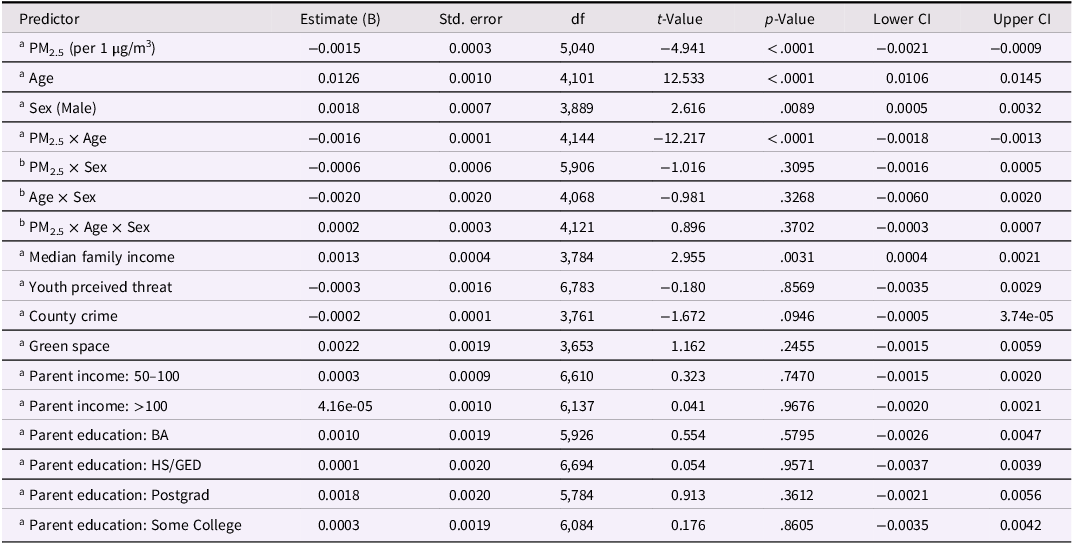
Fractional Anisotropy (FA): The PM2.5 × age interaction showed a significant negative association with ATR FA, b = −0.0016, SE = 0.0001, FDR p < .0001, indicating that the association between PM2.5 and ATR FA varied with age. Specifically, the association between one µg/m3 increase in PM2.5 and ATR FA was positive at age 9.96 (b = 0.00170, FDR p < .0001), negative at age 12 (b = −0.0015, FDR p = <.0001), and negative for ATR FA at age 14.10 (b = −0.00479, FDR p < .0001). See Tables 3, S5, and Figure 1.
-
Mean Diffusivity (MD): The PM2.5 × age interaction was significant (b = 0.0006, SE = 0.0001, FDR p < .0001); the association between PM2.5 and MD at age 9.96 was negative (b = −0.00091, FDR p = .0048), and non-significant for ages 12, and positive at age 14.10 (b = 0.001448, FDR p = .0121). See Tables 4 and S6.
Fractional anisotropy of the anterior thalamic radiation (ATR)

Table 3. Long description
A table with 18 rows and 9 columns showing the association between PM2.5, age, sex, and other factors with fractional anisotropy of the anterior thalamic radiation. The columns are Predictor, Estimate (B), Std_error, df, t-Value, p-Value, Lower CI, and Upper CI. The predictors include PM2.5 (per 1 µg/m3), Age, Sex (Male), PM2.5 × Age, PM2.5 × Sex, Age × Sex, PM2.5 × Age × Sex, Median family income, Youth perceived threat, County crime, Green space, Parent income: 50–100, Parent income: >100, Parent education: BA, Parent education: HS/GED, Parent education: Postgrad, and Parent education: Some College. Each row provides the estimate, standard error, degrees of freedom, t-value, p-value, and confidence intervals for the respective predictor.
Series of marginal effects of PM2.5 on fractional anisotropy and mean diffusivity of anterior thalamic radiation (ATR), fornix, and uncinate fasciculus. Description: PM2.5 (per 1 ug/m3) units are on a scale of 1. Emm_trends in R selected ages that were representative values based on the observed distribution of age in the sample (9.96, 12, 14.10). The ages reflect the variation in age across participants. Predicted FA Values (range 0–1) and MD Values (mm²/s) reflect estimated marginal means (95% confidence intervals), adjusting for covariates. Each colored line represents a specific age group, such that the age groups are superimposed within the same graph and represent different time points.

Mean diffusivity (mm2/s) of the anterior thalamic radiation (ATR)

Table 4. Long description
A table with 20 rows and 8 columns. The columns are labeled Predictor, Estimate (B), Std. error, df, t-Value, p-Value, Lower CI, and Upper CI. The table presents statistical data for various predictors including PM2.5, Age, Sex (Male), PM2.5 × Age, PM2.5 × Sex, Age × Sex, PM2.5 × Age × Sex, Median family income, Youth perceived threat, County crime, Green space, Parent income, and Parent education. Each row provides the estimate, standard error, degrees of freedom, t-value, p-value, and confidence intervals for the respective predictor. Notable trends include significant p-values for Age, Sex (Male), PM2.5 × Age, Median family income, and Green space, indicating strong associations. The table also shows interactions between PM2.5 and other variables like Age and Sex.
Fornix
-
FA: The PM2.5 × age interaction showed a significant negative association with the FA of the fornix: b = −0.0008, SE = 0.0001, FDR p < .0001. At age 9.96 fornix FA, the association with PM2.5 exposure was positive (b = 0.00143, FDR p < .001), non-significant at age 12, and negative at age 14.10 (b = −0.00200, FDR p < .0001). See Tables 5 and S7.
-
MD: The PM2.5 × age interaction was significant (b = −0.0013, SE = 0.0003, FDR p < .0001); the associations between PM2.5 and MD at age 9.96 was non-significant, negative at age 12 (b = −0.002590, FDR p = .0024), and negative at age 14.10 (b = −0.005423, FDR p < .0001). See Tables 6 and S8 and Figure 2.
Fractional anisotropy of the fornix

Table 5. Long description
A table with 20 rows and 9 columns. The columns are labeled Predictor, Estimate (B), Std. error, df, t-Value, p-Value, Lower CI, and Upper CI. The table presents statistical data for various predictors affecting fractional anisotropy of the fornix. The predictors include PM2.5 (per 1 µg/m³), Age, Sex (Male), PM2.5 × Age, PM2.5 × Sex, Age × Sex, PM2.5 × Age × Sex, Median family income, Youth perceived threat, County crime, Green space, Parent income (50–100 and >100), and Parent education (BA, HS/GED, Postgrad, and Some College). Each row provides the estimate, standard error, degrees of freedom, t-value, p-value, and confidence intervals for the respective predictor.
Mean diffusivity (mm2/s) of the fornix

Table 6. Long description
A table with 20 rows and 8 columns. The columns are labeled Predictor, Estimate, Std. error, df, t-Value, p-Value, Lower CI, and Upper CI. The table presents statistical data for various predictors, including PM2.5, Age, Sex, interactions between these factors, median family income, youth perceived threat, county crime, green space, parent income, and parent education. Each row provides the estimate, standard error, degrees of freedom, t-value, p-value, and confidence intervals for the respective predictor. Notable predictors include PM2.5 (per 1 µg/m3), Age, Sex (Male), PM2.5 × Age, PM2.5 × Sex, Age × Sex, PM2.5 × Age × Sex, Median family income, Youth perceived threat, County crime, Green space, Parent income (50–100 and >100), and Parent education (BA, HS/GED, Postgrad, Some College). The table shows the statistical significance and confidence intervals for each predictor.
Series of marginal Effects of PM2.5 on fractional anisotropy and mean diffusivity of anterior thalamic radiation (ATR), fornix, and uncinate fasciculus. Description: PM2.5 (per 1 ug/m3) units are on a scale of 1. Emm_trends in R selected ages that were representative values based on the observed distribution of age in the sample (9.96, 12, 14.10). The ages reflect the variation in age across participants. Predicted FA Values (range 0–1) and MD Values (mm²/s) reflect estimated marginal means (95% confidence intervals), adjusting for covariates. Each colored line represents a specific age group, such that the age groups are superimposed within the same graph and represent different time points.

Superior longitudinal fasciculus (SLF)
-
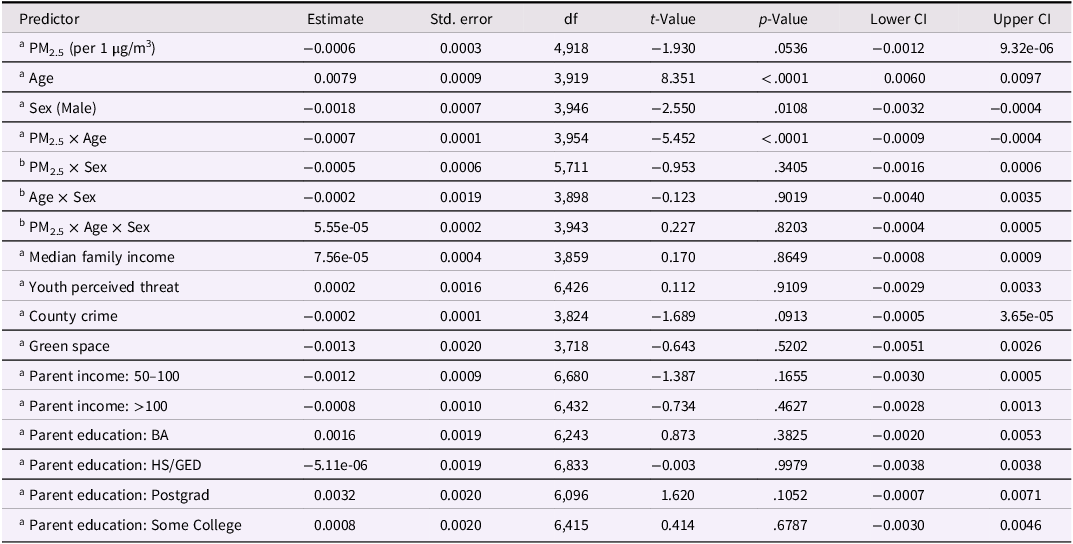
FA: The PM2.5 × age interaction showed a significant negative association with the FA of the SLF: b = −0.0007, SE = 0.00009, FDR p < .0001. At age 9.96 SLF FA, the association with PM2.5 was non-significant, negative at age 12 (b = −0.001491, FDR p < .0001), and negative at age 14.10 (b = −0.002894, FDR p < .0001). See Tables 7 and S9.
-
MD: The PM2.5 × age interaction was significant (b = −0.0006, SE = 0.0001, FDR p < .0001). The associations were positive at age 9.96 (b = 0.000965, FDR p = .0169), non-significant at age 12, and negative at age 14.10 (b = −0.001571, FDR p = .0028). See Tables 8 and S10.
Fractional anisotropy of the superior longitudinal fasciculus (SLF)

Table 7. Long description
A table with 20 rows and 9 columns. The columns are labeled Predictor, Estimate (B), Std. error, df, t-Value, p-Value, Lower CI, and Upper CI. The table presents statistical data for various predictors affecting fractional anisotropy. The predictors include PM2.5, Age, Sex (Male), PM2.5 × Age, PM2.5 × Sex, Age × Sex, PM2.5 × Age × Sex, Median family income, Youth perceived threat, County crime, Green space, Parent Income: 50–100, Parent income: >100, Parent education: BA, Parent education: HS/GED, Parent education: Postgrad, and Parent education: Some College. Each row lists the estimate, standard error, degrees of freedom, t-value, p-value, lower confidence interval, and upper confidence interval for each predictor. Notable trends include significant p-values for PM2.5, Age, PM2.5 × Age, and other predictors, indicating their impact on fractional anisotropy.
Mean diffusivity (mm2/s) of the superior longitudinal fasciculus (SLF)

Table 8. Long description
A table with 21 rows and 9 columns. The columns are labeled Predictor, Estimate, Std. error, df, t-Value, p-Value, Lower CI, and Upper CI. The table presents statistical data for various predictors, including PM2.5, Age, Sex, and interactions between these variables. It also includes predictors like Median family income, Youth perceived threat, County crime, Green space, and Parent income and education levels. Each row provides the estimate, standard error, degrees of freedom, t-value, p-value, and confidence intervals for the respective predictor. Notable trends include significant p-values for Age, Sex, PM2.5 × Age, and other interactions, indicating strong associations. The table also shows varying effects of predictors like Green space and Parent income on the outcomes measured.
Uncinate fasciculus
-
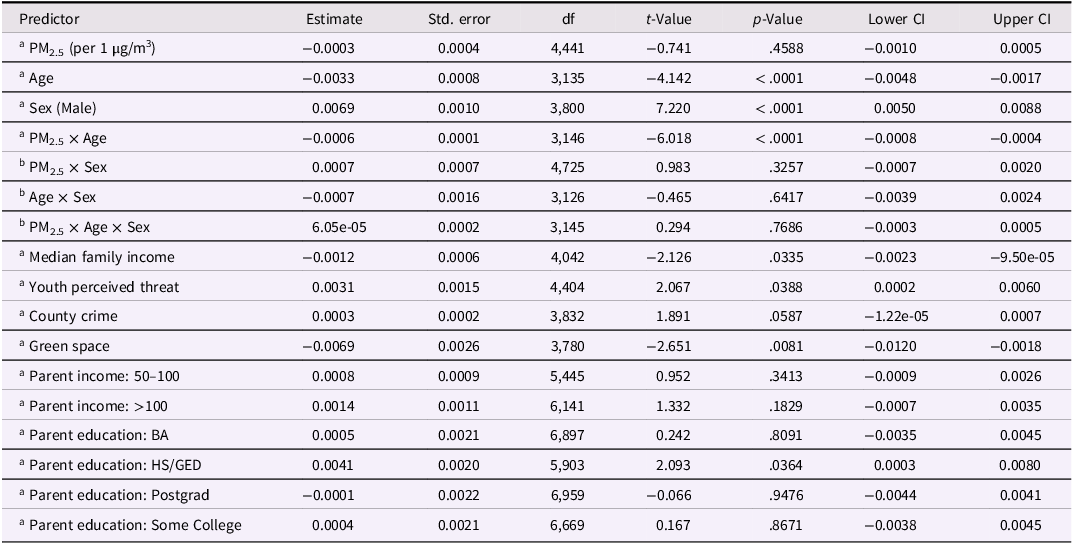
FA: The PM2.5 × age interaction showed a significant negative association with the FA of the UNC: b = −0.00065, SE = 0.00012, FDR p < .0001. At age 9.96 UNC FA, the association with PM2.5 exposure was positive (b = 0.000747, FDR p = .0192), but non-significant at age 12, and negative at age 14.10 (b = −0.001982, FDR p < .0001). See Tables 9 and S11.
-
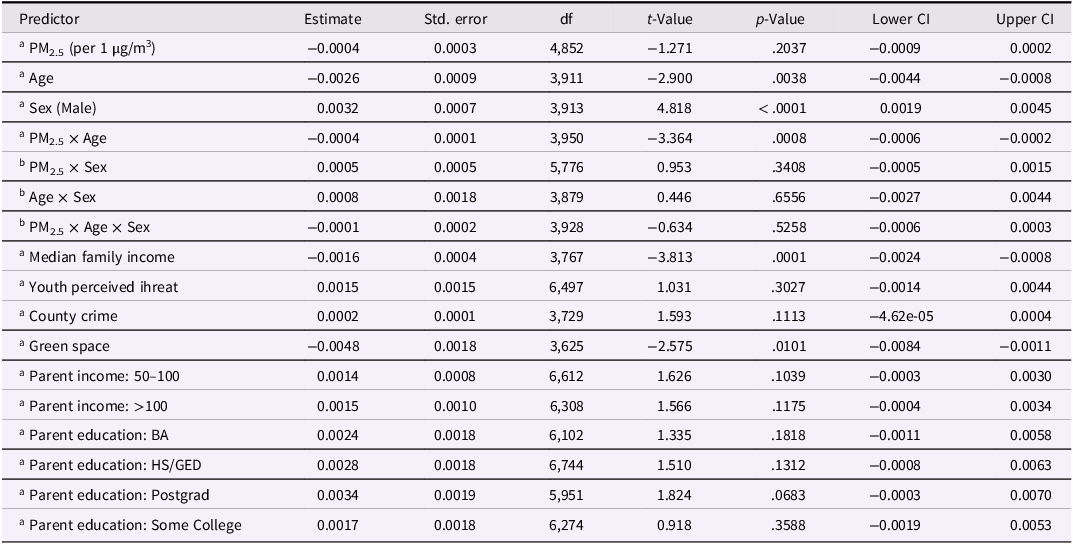
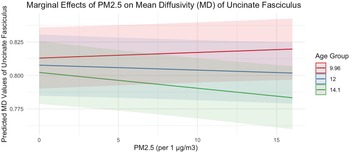
MD: The PM2.5 × age interaction was significant (b = −0.0004, SE = 0.0001, FDR p < .0008). At age 9.96 and 12, the associations were non-significant, but at age 14.10, the association with PM2.5 exposure was negative (b = −0.001181, FDR p = .0088). See Tables 10, S12 and Figure 3.
Fractional anisotropy of the uncinate fasciculus

Table 9. Long description
A table with 18 rows and 9 columns. The columns are labeled Predictor, Estimate, Std. error, df, t-Value, p-Value, Lower CI, and Upper CI. The table presents the results of a statistical analysis, showing the estimates, standard errors, degrees of freedom, t-values, p-values, and confidence intervals for various predictors. The predictors include PM2.5 (per 1 µg/m³), Age, Sex (Male), PM2.5 × Age, PM2.5 × Sex, Age × Sex, PM2.5 × Age × Sex, Median family income, Youth perceived threat, County crime, Green space, Parent income (50–100 and >100), and Parent education (BA, HS/GED, Postgrad, and Some College). Each row provides the specific values for these statistical measures corresponding to each predictor.
Mean diffusivity (mm2/s) of the uncinate fasciculus

Table 10. Long description
A table with 19 rows and 9 columns. The columns are labeled Predictor, Estimate, Std. error, df, t-Value, p-Value, Lower CI, and Upper CI. The table presents statistical data on various predictors and their impact on a specific outcome. Each row lists a different predictor along with its corresponding estimate, standard error, degrees of freedom, t-value, p-value, lower confidence interval, and upper confidence interval. The predictors include environmental factors like PM2.5, demographic factors like Age and Sex, and socio-economic factors like Median family income and Parent income. The table also includes interaction terms between these predictors. Notable trends include significant p-values for Age, Sex (Male), PM2.5 × Age, Median family income, and Green space, indicating these predictors have a notable impact on the outcome. The interaction terms PM2.5 × Age and PM2.5 × Sex also show significant p-values, suggesting complex relationships between these variables.
Series of marginal effects of PM2.5 on fractional anisotropy and mean diffusivity of anterior thalamic radiation (ATR), fornix, and uncinate fasciculus. Description: PM2.5 (per 1 ug/m3) units are on a scale of 1. Emm_trends in R selected ages that were representative values based on the observed distribution of age in the sample (9.96, 12, 14.10). The ages reflect the variation in age across participants. Predicted FA Values (range 0–1) and MD Values (mm²/s) reflect estimated marginal means (95% confidence intervals), adjusting for covariates. Each colored line represents a specific age group, such that the age groups are superimposed within the same graph and represent different time points.

Sex differences among WM
There were no significant PM2.5 × Sex or PM2.5 × Age × Sex interactions for any of the WM tract outcomes.
Cognition
A significant PM2.5 × age interaction was observed with Pattern Comparison Processing Speed scores (b = 0.24, SE = 0.08, p = .0038). However, follow-up simple slope analyses at representative ages were not significant after FDR correction. After FDR correction, PM2.5 was not significantly associated with cognitive measures, including Flanker Attention Task, Picture Vocabulary Test, Reading Test, or Crystallized Intelligence Scores (see Tables S13–S29). Additionally, a PM2.5 × sex interaction indicated a stronger negative effect of PM2.5 in males than females for Picture Sequence Memory Test (b = −3.396; SE = 1.399; FDR p = .015), and a PM2.5 × age × sex interaction (b = 0.2935, SE = 0.1259, FDR p = .0373) suggested age-related changes in this association. However, follow-up simple slope analyses at representative ages were not significant after FDR correction. After FDR correction, main effects of PM2.5 and all interaction terms did not contribute to the prediction of the Pattern Comparison Processing Speed Test, Flanker Attention Task, Picture Vocabulary Test, Reading Test, or Crystallized Intelligence Scores. See Tables S13–S29.
SU initiation
The direct relationship between PM2.5 exposure and SU between two-year and four-year was not significant nor was the interaction of PM2.5 × sex significant.
Discussion
This study examined longitudinal associations between late childhood exposure of PM2.5 and fronto-limbic WM microstructure, cognition, and SU initiation across late childhood to mid-adolescence. The relationships between childhood PM2.5 exposure and fronto-limbic WM integrity varied as a function of age at assessment and WM tract. At younger ages (average age 9.96), increased baseline PM2.5 exposure was linked with greater WM integrity, measured by increased FA, across the ATR, fornix, and UNC. However, at older ages (age 12 and 14), PM2.5 was linked with lower WM integrity (reduced FA) in the ATR and SLF, and mid-adolescence in the fornix and UNC. PM2.5 was associated with increased MD in the SLF at age 9, indicating that the association differed at younger ages. In contrast, PM2.5 exposure was linked with decreased MD (typically reflecting better WM integrity) in the fornix at ages 12 and 14, and in the SLF and UNC at age 14. Notably, we did not observe significant PM2.5 × Sex or PM2.5 × Age × Sex interactions across the WM tract outcomes; this suggests that associations between baseline PM2.5 exposure and fronto-limbic WM microstructure were largely similar for males and females during late childhood and early adolescence. Although some prior studies have reported sex-specific vulnerability to environmental exposures, it is possible that sex differences in susceptibility to PM2.5 may emerge later in adolescence when hormonal and pubertal processes more strongly influence brain development. Additionally, associations between PM2.5 exposure and cognitive performance and SU initiation were modest and did not remain significant after correction for multiple testing. Taken together, these analyses indicate that the association between PM2.5 exposure and fronto-limbic WM microstructure differs across the ages. These findings should be interpreted as age-dependent differences in associations rather than evidence of within-person developmental change, and the observed pattern could reflect less positive change over time rather than absolute differences in WM integrity.
Our findings indicate that increased PM2.5 exposure during childhood was linked with greater FA at age 9 in the ATR, fornix, and UNC, suggesting more anisotropic diffusion aligned along one direction within a tract- an indication of well-organized WM tracts. These findings may suggest that in late childhood, higher PM2.5 exposure is associated with higher FA. While this may reflect premature acceleration or compensatory myelination in response to increased oxidative stress induced by PM2.5 exposure, consistent with previous research (Hanson et al., Reference Hanson, Adluru, Chung, Alexander, Davidson and Pollak2013; Jung et al., Reference Jung, Takiguchi, Hamamura, Mizuno, Kosaka and Tomoda2020), our models did not test this. However, at older ages, PM2.5 exposure was associated with poorer WM integrity via reduced FA in these tracts. It is possible that if myelination occurs too early or too rapidly before axons are fully developed (i.e., weaker structural integrity or functional relationships), thus in time, dys-myelination may occur, resulting in dysfunctional myelination or myelination of defective axons due to the proliferation of astroglia and microglia reactivity (Parolisi et al., Reference Parolisi, Montarolo, Pini, Rovelli, Cattaneo, Bertolotto, Buffo, Bollati and Boda2021). Further, the ongoing oxidative stress induced by PM2.5 may lead to the generation of reactive oxygen species (ROS) and microglial activation, which may in turn damage the myelin and promote inflammation (Iakovou & Kourti, Reference Iakovou and Kourti2022) by mid-adolescence, possibly impairing communication between the limbic system and prefrontal cortex. This pattern, in which associations are positive at younger ages and negative at older ages may reflect age-dependent differences in associations, rather than within-person changes. This is broadly consistent with previous findings suggesting an initial advanced or older phenotype in WM tracts after one year of annual air pollutant exposure and differences in intracellular isotropic diffusion over time as children age into adolescence (Cotter et al., Reference Cotter, Ahmadi, Cardenas-Iniguez, Bottenhorn, Gauderman, McConnell, Berhane, Schwartz, Hackman, Chen and Herting2024; McLaughlin et al., Reference McLaughlin, Sheridan and Nelson2017). However, these studies interpret findings as developmental change, which cannot be directly evaluated in the present analyses. Additionally, because ongoing PM2.5 exposure at later ages was not measured in the current ABCD Study design, we are unable to assess how changes in exposure over time may relate to WM microstructure.
Our findings of positive associations between PM2.5 and FA at younger ages in the ATR, fornix, and UNC are partially consistent with the Stress Acceleration Hypothesis (Callaghan & Tottenham, Reference Callaghan and Tottenham2016), suggesting early-life adversity, including environmental air pollution exposure, may be associated with differences in WM organization across development. Indeed, our findings are broadly consistent with prior work suggesting that early-life stressors (e.g., family stress and caregiver deprivation) can influence WM development during childhood and adolescence. Some studies have suggested that stress-related experiences may be associated with differences in WM maturation across development (Callaghan & Tottenham, Reference Callaghan and Tottenham2016; Sullivan-Toole et al., Reference Sullivan-Toole, Jobson, Hoffman, Stewart, Olson and Olino2023). However, other research has reported reduced WM integrity following early-life stress, including findings of lower FA in association with dysregulation of the HPA axis and stress-related physiological responses (Howell et al., Reference Howell, McCormack, Grand, Sawyer, Zhang, Maestripieri, Hu and Sanchez2013). Together, these findings suggest that disruptions to neuroimmune and stress-regulation systems may influence WM development through multiple mechanisms, potentially reflecting both accelerated maturation in some contexts and disrupted microstructural organization in others. Importantly, biological mechanisms, including actiation of inflammatory cascades and disruption of HYPA-axis functioning have been proposed in studies examining the neurodevelopmental effects of PM2.5 exposure. Similarly, some studies suggest experiencing environmental stress or neighborhood disadvantage are linked with global changes in brain connectivity, particularly in regions implicated in executive functioning, also indicative of early brain maturation as an adaptive or protective factor against child adversity (Brieant et al., Reference Brieant, Sisk and Gee2021). These brain regions have important functions, for example, the ATR projects to the anterior thalamic nuclei and is involved in emotion regulation, attentional control and working memory (Niida et al., Reference Niida, Yamagata, Niida, Uechi, Matsuda and Mimura2018; Sun et al., Reference Sun, Peräkylä, Polvivaara, Öhman, Peltola, Lehtimäki, Huhtala and Hartikainen2015). Additionally, the UNC connects the amygdala and hippocampus to regions of the prefrontal cortex and is involved in emotion regulation and higher-order executive functioning (e.g., processing novel information) (Naidich et al., Reference Naidich, Krayenbühl, Kollias, Bou-Haider, Bluestone, Carpenter, Krayenbühl, Kollias, Bou-Haider, Bluestone, Carpenter, Naidich, Castillo, Cha, Smirniotopoulos, Naidich, Naidich, Castillo, Cha and Smirniotopoulos2013). Finally, the fornix connects the hippocampus to subcortical structures (e.g., hypothalamus) and plays a role in memory. Across these tracts, the ATR matures the earliest, followed by the fornix, and lastly, the UNC. Notably, we observed reduced WM integrity (via increased MD) specifically in the ATR by mid-adolescence, possibly reflecting a specific tract vulnerability of the ATR to PM2.5 due to earlier onset disruption to WM integrity and organization at this age. However, these findings are preliminary, and more research is needed to disentangle the impact of accelerated WM maturation. Alternatively, increased exposure to PM2.5 may co-occur with other facets of childhood adversity that our current analysis did not measure, such as adverse childhood experiences, lead or other neurotoxic exposure, and other indicators of a more disadvantaged neighborhood or reduced access to resources (Fan et al., Reference Fan, Marshall, Smolker, Gonzalez, Tapert, Barch, Sowell, Dowling, Cardenas-Iniguez, Ross, Thompson and Herting2021).
We observed positive associations between PM2.5 and FA at younger ages and negative associations with FA at older ages. In parallel, we observed lower MD in the fornix and uncinate fasciulus at older ages, which is typically interpreted as reflecting greater WM integrity. This pattern is not entirely consistent with what we would expect. Although reduced WM is often considered a marker of improved WM integrity, in the context of environmental exposure, it may instead reflect a reactive or potentially maladaptive neurobiological process. Importantly, these findings should be interpreted as age-dependent differences in associations rather than evidence of within-person developmental change. While not directly studied, a possible mechanism could be PM2.5 exposure may be associated with oxidative stress and acute neuroinflammation, accelerating myelination in late childhood. However, at older ages, this prolonged glial activation may be associated with increased astrocyte and microglia proliferation, which may in turn contribute to cellular crowding and reduced extracellular space, reflected by reduced or restricted water diffusion (i.e., reduced MD) (De Santis et al., Reference De Santis, Drakesmith, Bells, Assaf and Jones2014; Le Bihan & Johansen-Berg, Reference Le Bihan and Johansen-Berg2012; Takeuchi & Kawashima, Reference Takeuchi and Kawashima2018; Vargová & Syková, Reference Vargová and Syková2014). While not directly observed and speculative, it is possible that PM2.5 exposure alters the extracellular space, leading to reduced diffusion, reflecting differences in WM microstructure at these age ranges. Future research should investigate other subcategories of diffusion tensor imaging (DTI) measures including radial diffusivity which may provide a deeper level of understanding of myelin integrity and may disentangle whether these observed simultaneous reductions in FA and MD reflect demyelination, extracellular crowding, or glial density.
In contrast to the other fronto-limbic regions, in the SLF, MD and FA were more dynamic. We found in the SLF, at age 9, increased MD, which may suggest immature or underdeveloped WM integrity, possibly reflecting delayed onset of myelination or sparse axonal density. At ages 12 and 14, we observed reduced FA, indicating demyelination and more disorganization. At the same time, by the age of 14, it was observed that MD also decreased. Similar to the fornix and UNC at age 14, this may be a maladaptive restructuring due to the proliferation of glial and inflammatory cell infiltration that restricts extracellular space. This is consistent with prior findings in the ABCD Study that found effects of PM2.5 linked with higher intracellular isotropic diffusion in fronto-limbic WM at age 9 (Cotter et al., Reference Cotter, Ahmadi, Cardenas-Iniguez, Bottenhorn, Gauderman, McConnell, Berhane, Schwartz, Hackman, Chen and Herting2024). Additionally, this is consistent with studies that suggest a link between air pollution and reduced WM volume in parietal and temporal regions, indicating disruptions to microstructural integrity (Peterson et al., Reference Peterson, Rauh, Bansal, Hao, Toth, Nati, Walsh, Miller, Arias, Semanek and Perera2015). The SLF, a long association tract with one of the most protracted maturational timelines, may be especially vulnerable to early-life environmental exposures such as PM2.5. It is possible that the SLF may be particularly disrupted by exposure to PM2.5 as it is a WM tract with protracted development and implicated in regions that don’t mature until later adolescence (Madhavan et al., Reference Madhavan, McQueeny, Howe, Shear and Szaflarski2014), thus, may be more vulnerable to the negative effects of PM2.5 during late childhood and preadolescence. Together, our findings suggest early PM2.5 exposure is associated with differences in SLF microstructure across ages. Furthermore, the SLF, while implicated in executive functioning, may have a more robust impact on aspects of attention, language production, and comprehension (Madhavan et al., Reference Madhavan, McQueeny, Howe, Shear and Szaflarski2014), which were not investigated in this present study. Future studies should look at the dynamic relationship over time within cognitive domains of language and attentional processing as well as investigate whether these relationships are sustained in later adolescence.
Findings did not reveal significant associations between PM2.5 × Age interaction and cognitive performance after FDR correction. While we observed a significant association between our interaction of PM2.5 × Age and reduced processing speed (Pattern Comparison Processing Speed Test), post hoc pairwise comparisons were not significant following FDR correction. Although non-significant, the relationship between PM2.5 and processing speed performance was trending negative, particularly in younger ages. While we observed subtle WM changes during this developmental period, it’s possible that this neurotoxin–brain relationship may not be directly reflected in cognitive performance at this age. Importantly, because WM, cognition, and SU were independently analyzed outcomes, these findings should not be interpreted as evidence that PM2.5 -related WM differences drive cognitive or risky behavioral changes.
While our linear regressions indicated PM2.5 x Age × Sex interactions and episodic memory (Picture Sequence Memory Tests) and inhibitory control (Flanker Attention Task), none of the relationships remained significant after FDR-corrected pairwise tests. Upon visual inspection, the relationship between PM2.5 and episodic memory was trending negative, particularly in older females, however non-significant. Finally, the relationship between PM2.5 and inhibitory control was trending negative, particularly in older females, however non-significant. It is possible we may be observing subtle changes, however more significant relationships may be observed as youth age into mid to later adolescence.
Our exploratory aim investigating the link between PM2.5 and SU initiation between two-year and four-year time points were non-significant. However, it’s possible that the low prevalence of initiators at this time point may not have provided sufficient power, or unique relationships exist across the SU onset trajectory. Thus, it’s possible this relationship may change as SU escalates as the cohort ages into middle and late adolescence. Future research should include later waves of the ABCD Study and/or examine behavioral aspects that may precede or pose individuals at higher risk of SU, for example a disrupted behavioral inhibition or activation system or emotion regulation problems.
Strengths and limitations
The ABCD Study excels in being a large, prospective cohort study in multiple sites across the United States, with rich and detailed measurements of WM tracts and neurocognitive performance. Furthermore, the ABCD Study provides extensive opportunities to understand ecological characteristics, such as neighborhood opportunity factors, and their potential impact on the development of cognitive and brain health. However, there are several limitations that need to be addressed. Firstly, PM2.5 exposure was based on annual averages at participants’ residential addresses at baseline, rather than direct measurements, potentially leading to discrepancies in exposure estimates. Thus, there may be differences in predicted exposures relative to exact measurements; however, our measurement of PM2.5 utilized advanced and novel hybrid spatio-temporal methods. Additionally, we restricted analyses to FA and MD, which, are robust and interpretable measures for multisite diffusion MRI datasets, due to previous evidence in the literature (Cotter et al., Reference Cotter, Ahmadi, Cardenas-Iniguez, Bottenhorn, Gauderman, McConnell, Berhane, Schwartz, Hackman, Chen and Herting2024; Herting et al., Reference Herting, Bottenhorn and Cotter2024). However, these metrics do not capture all aspects of WM microstructure. Measurements including axial diffusivity or radial diffusivity may provide additional information about fiber-specific properties (e.g., axonal integrity vs. myelination) and may reveal further associations with PM2.5. Future work should examine these metrics to more fully characterize the impact of air pollution on WM development.
Second, neighborhood opportunity was only linked to the youth’s primary residence at baseline, potentially not capturing cumulative lifetime effects. Further, the ABCD Study does not have access to PM2.5 prenatal exposure, which has been linked with childhood executive function and cognition in numerous studies. Importantly, as anticipated, our analyses yielded small effect sizes; however, prior studies within the ABCD Study have found small effect sizes are often reproducible and considered meaningful71. Finally, geocoded, or census-tract data does not translate or reflect lived experiences or subjective experience of exposures and neighborhood opportunity. Thus, future studies should investigate the interaction of lived experiences in combination with geocoded estimates of neighborhood opportunity. Importantly, the present analytic approach does not directly model within-person developmental trajectories of WM. Rather, it tests whether the association between baseline PM2.5 exposure and repeated WM measures varies as a function of age at assessment. As such, the observed pattern of positive associations at younger ages and negative associations at older ages should not be interpreted as evidence of accelerated or altered developmental change, but instead as age-dependent differences in associations.
Conclusion
Taken together, exposure to PM2.5 in childhood is linked with WM integrity (via increased FA and reduced MD) in fronto-limbic tracts, including the ATR and UNC, but poorer WM integrity via reduced FA at later ages (12 and 14) across all tracts. PM2.5 was associated with increased MD in the SLF in late childhood, indicating differences in associations at younger ages; however, we observed lower MD at older ages in the fornix, SLF, and UNC in later ages, an unexpected finding typically interpreted as enhanced integrity; however, in the context of increased PM2.5, it may reflect maladaptive responses of glial activation and extracellular crowding.
This study leveraged the national ABCD Study, the largest longitudinal study of brain development and adolescent health in the United States, and provides unique findings in understanding how associations between PM2.5 and WM integrity in fronto-limbic vary across early adolescence. This may invigorate public health changes toward environmental injustices and motivate the development of novel interventions for preventing or buffering against the risk of neurotoxicity and neuroinflammation. Importantly, these findings underscore the need for interventions that provide a buffer or defense against even low levels of PM2.5 exposure, especially in vulnerable populations including children and adolescence. Together, these studies provide evidence for links between PM2.5 exposure and adolescent brain development, highlighting the potential of these neural markers as predictors for WM microstructural changes.
Supplementary material
The supplementary material for this article can be found at https://doi.org/10.1017/S095457942610159X.
Data availability statement
Availability of data. The data used in this study are publicly available through the Adolescent Brain Cognitive Development (ABCD) Study (https://abcdstudy.org) via the NIMH Data Archive (https://nda.nih.gov/abcd). Access requires registration and completion of a data use certification agreement. Availability of Code. Analysis code is available upon request to the corresponding author and will be shared via secure repository or direct correspondence. Availability of Methods/material. All study methods, measures, and preprocessing procedures are described in the manuscript and detailed in ABCD Study documentation (https://abcdstudy.org). No new materials were developed for this project.
Acknolwedgments
The authors thank the participants and families who made this research possible. We also acknowledge the contributions of research assistants and staff involved in data collection and project coordination.
Funding statement
This is a multisite, longitudinal study designed to recruit more than 10,000 children aged 9–10 and follow them over 10 years into early adulthood. The ABCD Study® is supported by the NIH and additional federal partners. A full list of supporters is available at https://abcdstudy.org/federal-partners.html (accessed on 4 February 2025). A listing of participating sites and a complete listing of the study investigators can be found at https://abcdstudy.org/consortium_members/ (accessed on 4 February 2025). ABCD consortium investigators designed and implemented the study and/or provided data but did not necessarily participate in the analysis or writing of this report. This project was funded by the following award number: 5U01DA041025-09. JH was supported by the National Center for Advancing Translational Sciences, NIH, through grant number 2TL1 TR001437. Its contents are solely the responsibility of the authors and do not necessarily represent the official views of the NIH. This manuscript reflects the views of the authors and may not reflect the opinions or views of the NIH or ABCD consortium investigators.
Competing Interests
None.
AI statement
No generative artificial intelligence tools were used in the writing, analysis, or preparation of this manuscript.
Pre-registration statement
This study was not pre-registered because it was conducted as a secondary data analysis of existing ABCD Study data. The hypotheses and analytic plan were developed after data access but prior to conducting the analyses.




 Open access

